

Engineering and Manufacturing for Biotechnology - Marcel Hofman & Philippe Thonart
.pdfRonald 
The last term in this equation, with sample flow rate  is inserted to take the loss of
 due to sampling in account. Equations 4 and 9 represent the complete carbon dioxide mass balance for liquid and gas phase. It must be noticed that information about cell kinetics is not necessary and for the medium only known physical constants like
 and R, are used.
3. Software sensor design
The software sensor is not based upon an equilibrium model (CTR = CER) but on a dynamic model for the carbon dioxide concentrations in headspace and medium (Equations 4 and 9). This dynamic model is used to reconstruct the actual CER from the measured carbon dioxide in the headspace.
3.1. DYNAMIC MODEL
In systems theory there are two concepts, which must be clearly distinguished from each other. The plant is the actual physical system that needs to be observed. The model is the mathematical description of the physical system, which is used for the filter design stage. Within the control-engineering field it is common to rewrite a model to its state-space representation. In such a presentation all relations are linear or linearised and written in matrix-notation. The input, state, output and noise of the model are given as vectors. The input vector usually contains the manipulatable variables of the model, the state vector consists of those variables that develop through time dependant of each other and of the input, and the output usually contains all the measured variables. The total system can be written as an 
where u is the input vector with m inputs, x the state vector with n states and y the output vector with k outputs. The matrices A and B contain information about the way the states develop through time and with the matrices C and D the output can be calculated. A is a  B a
B a  C a
C a  and D a
  matrix.
In this situation the model, consisting of Equations 4 and 9, are extended with an extra differential equation used for estimating the CER. The prediction of the CER is a zero mean random walk process, i.e. its derivative is zero:
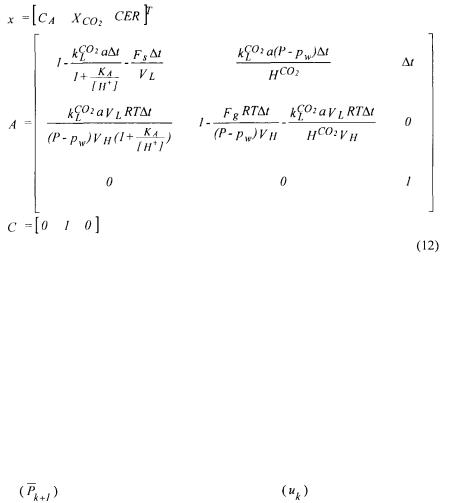
For use in a discrete Kalman Filter algorithm the model is discretised and rewritten to a state-space representation by defining the input, state and output vectors. The state vector consists of the CER, the lumped concentration of both dissolved carbon dioxide
208
Respiration quotient: estimation during batch cultivation in bicarbonate buffered media
and bicarbonate  and the molar fraction of carbon dioxide in the headspace
  There is no input vector and the output vector is constructed from the
measured variables, which is only the molar fraction of carbon dioxide in the off-gas.
This model is linear in the state variables for the equations so the /ISCD-matrices can be developed straightforward. A consequence of computer application for process monitoring is data sampling. Only process values at discrete time moments are available. Therefore, instead of continuous time models, the process behaviour is given by the discrete time equivalents. And since there is no input, there are no B and D matrices. Now the state vector, A matrix and C vector are:
3.2. THE KALMAN FILTER ALGORITHM
Both the plant and the model use the same known input. The state of the plant is, of course, unknown and its output can be measured. The state and output of the model is based on the predictions of the model, as can be seen in Table 1, where  represent process noise and measurement noise vectors, respectively, they are assumed to be random with mean values zero and variances Q and R.
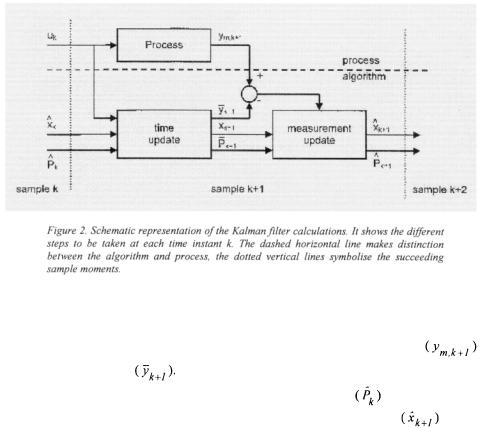
The Kalman Filtering algorithm is depicted in Figure 2. In this figure a distinction is made between the cultivation process which gives the data and the algorithm that processes the data. The algorithm has two steps, respectively the time update and the measurement update. In the time update a one sample ahead prediction is made for the state and output variables (respectively  and the prediction variance of the
states |
. The actual values of the input variables |
and the available estimated |
results of the Kalman filter  at sample moment
  are used for this prediction.
209
Ronald Neeleman
The next step is the measurement update, which takes place as soon as new data becomes available and where the prediction of the output variable i is corrected.
The correction is proportional to the error between measured process output
and predicted output |
The magnitude of the correction |
gain |
varies for |
succeeding samples and aims to minimise the error covariance |
for the state and |
||
output variables. Now, the measurement update gives the best estimate |
of the |
||
states and its variance The values for the state estimate
  i are used as the
software sensor output. The entire set of these equations comprises what is called the discrete time Kalman Filter (Chen, 1993 and Lewis, 1986) and is summarised in
Table 1.
A few remarkable advantageous features of the Kalman filtering algorithm can easily be observed. First, each calculation step only requires the last estimate and a new set of measurement data. The essential advantage of such simple "step-by-step" structure of the computational scheme is that there is no need to store all old results and measurement data for each up-dating state estimate, and this saves computer memory and processor time, especially in real-time (on-line) applications. Second, all recursive formulas of the algorithm are straightforward and linear, consisting of only matrix multiplication and addition, and a single matrix inversion in the calculation of the
Kalman gain.
210

Respiration quotient: estimation during batch cultivation in bicarbonate buffered media
4. Application of the software sensor
The Kalman Filtering algorithm is used as software sensor for the CER. First the performance was validated by an experiment, then the application and use was proven by a series of experiments and finally two experiments show the robustness of the software sensor in coping with disturbances.
4.1. VALIDATION OF THE SOFTWARE SENSOR
Before applying the software-sensor, its performance needs to be validated. The bottleneck in the  procedure is that the software sensor must be able to detect the CER correctly. To validate the sensor at this point medium, to which a known amount of bicarbonate was added, was pumped from a storage vessel into the reactor.
So the carbon production by cells was imitated by pumping an exactly known amount of bicarbonate into the reactor. If the software sensor operates well it should be able to detect this amount of bicarbonate correctly. Moreover, as the software sensor gives also the value of the total carbonate content  the performance can also be checked by analysis of the total carbonate concentration in the solution.
During the experiment there was a minimum of headspace in the storage vessel, which limits the loss of bicarbonate from the liquid phase. As a result the total carbonate concentration in the feed to the reactor remained constant. Feeding of the bicarbonate solution to the fixed volume reactor by a continuous pumping system
211

Ronald Neeleman
imitated the CER by cells. From the measurements of the total carbonate concentration (C/{) in the feed and reactor together with the feed rate, the actual CER was calculated. During the experiment the feed flow rate was manipulated in order to obtain several levels for the CER and 
Figure 3 shows the  and CER obtained by the software sensor compared with the
measured |
and the "imitated" CER (obtained by pumping the bicarbonate medium in |
the reactor). |
At 600 minutes the reactor contained an amount of bicarbonate and the |
feed flow and software sensor were started. The sensor results of the first five minutes are affected by the start-up of the sensor. The total carbonate concentration,  in the reactor decreased during the first 500 minutes due to its high start concentration. At
3200 minutes together with the feed flow rate the CER was increased and at 4700 minutes it was decreased again. During the whole experiment there is a good match between the and CER values obtained from the software sensor and the laboratory measurements. The CER signal from the software sensor in the second part of the experiment reveals some variations, which are a consequence of variations in the measured carbon dioxide concentrations in the off-gas. The good match between the
obtained results confirms the use of the software sensor for |
and CER measurement. |
212
Respiration quotient: estimation during batch cultivation in bicarbonate buffered media
4.2. APPLICATION TO CELL CULTIVATION
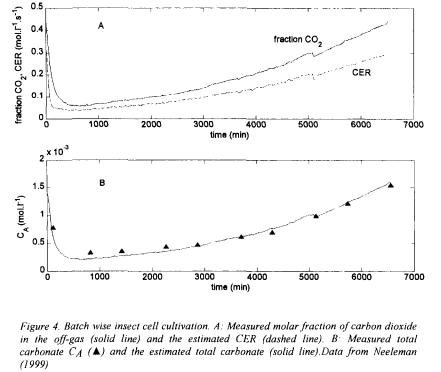
The on-line application of the CER software sensor was evaluated for 18 batch cultivations of insect cells and 2 mammalian cell cultivations. Figure 4A shows standard results for the measured carbon dioxide in the off-gas and the CER-\a\ues from the software sensor during one of the insect cell cultivations. The C£/?-values are in the range that can be expected for the used cells. Due to a recalibration of the pH sensor at 5100 minutes the  controller reacted suddenly, which in turn affected the measured carbon dioxide and the estimated CER. In this experiment, together with the estimation of the CER, the
  is estimated. Figure 4B shows the estimated
  and the laboratory measurements, which correspond well. The mean error between the estimated and measured 'total carbonate concentration' is
  with a standard deviation of
  With the estimated CER and calculated OUR the RQ could be calculated.
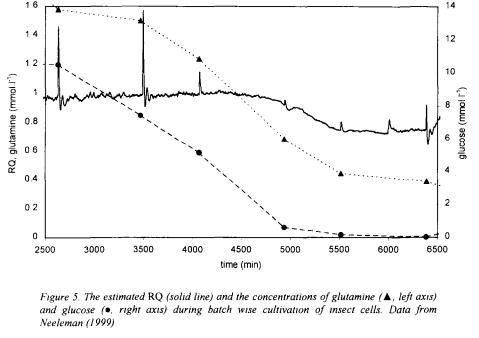
Figure 5 shows the estimated RQ for a part of a batch together with the measured substrate concentrations: glutamine and glucose. The peaks in the RQ signal fall together with the sampling moments when some  containing medium is replaced by the same amount of
  free medium. Figure 5 illustrates that when glucose and glutamine (till 4500 minutes) are in sufficiently high concentration available the
213
Ronald Neeleman
organism grows well with a RQ around 1.0. After 5000 minutes the glucose is depleted and now glutamine is the main substrate for the organism. The  that falls from
1.0 to 0.8 reflects the change in the physiological state of the organism due to the lack of glucose. Thus, with the ability to estimate the RQ on-line the physiological state of the cells can b'e monitored on-line and be used as an indicator for adding extra substrates. This finding confirms the statement of Royce (1992) and Bonarius et al.
(1995) that the RQ can be used as parameter to detect the metabolic activity of the cell.
4.3. ROBUSTNESS OF THE SOFTWARE SENSOR
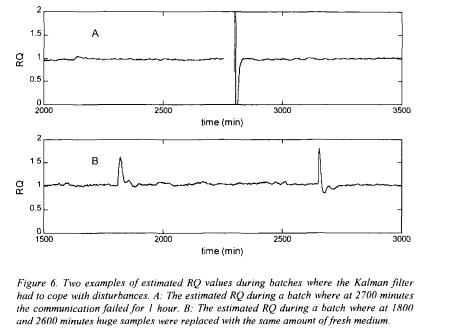
Examples of RQ estimates for other cultures are given in figure 6. Figure 6A shows the estimated RQ during a batch where at 2700 minutes the communication between the computer and the PLC failed for approximately 1 hour. The Kalman filter waited 1 hour before a new measurement update could be calculated. After this disturbance the software sensor quickly recovered the same RQ value. Figure 6B shows the estimated RQ during another batch where at 1800 and 2600 minutes huge samples were taken and replaced with fresh medium. Samples were taken by pressurising the headspace to withdraw the liquid. This way of sample taking gives a major impact on the headspace pressure and  fraction. Furthermore, the fresh medium instantly changes the 'total carbonate concentration' in the medium. Again it can be seen that the software sensor quickly recovers from these disturbances.
214
Respiration quotient: estimation during batch cultivation in bicarbonate buffered media
5. Concluding remarks
For batch cell cultivation in media which buffer carbon dioxide, the carbon dioxide evolution rate (CEK) and respiration quotient (RQ) cannot be obtained from an equilibrium model only. As an alternative a software sensor is used. Main features of the sensor are:
•The CER detection is based on a dynamic model that covers the transient phases for bicarbonate buffering media and batch wise operations. In the model all carbon dioxide and bicarbonate in the liquid phase are lumped to a single component "total carbonate" and as a result no detailed knowledge of the reaction kinetics is necessary; only physical constants are required.
•The sensor uses a discrete time Kalman Filter algorithm.
•In a validation experiment where cell carbon dioxide production was imitated, the software sensor proved to be successful for estimation of the CER from on-line carbon dioxide measurements in the off-gas.
•Results obtained from experiments with insect cells showed that the RQ-value was close to 1.0, a value that is common for cells growing on glucose and glutamine as main substrates. As the physiological state of the organism changes due to substrate limitations the RQ-value reflects this change.
215
Ronald Neeleman
•Results of experiments where disturbances occurred showed that the Kalman Filter could cope efficiently with communication failures and sudden medium or
headspace changes.
Important difference with the work of Stephanopoulos and San (1984) and Bastin and
Dochain (1990) is that a minimum of a priori system knowledge is needed for the estimation of the RQ value. In contrast to a limited amount of information that can be obtained from laboratory samples the software sensor produces a continuous stream of RQ and CER values to monitor the state of the organism. Therefore it is a powerful tool to be used for various cell cultivations.
References
Bastin, G., and Dochain, D. (1990) On-line Estimation and Adaptive Control of Bioreactors. Elsevier Science Publishing Co. Amsterdam.
Bonarius, H.P.J., de Gooijer, C.D., Tramper, J. and Schmid, G. (1995) Determination of the Respiration Quotient in Mammalian Cell Culture in Bicarbonate Buffered Media. Biotechnology and
Bioengineering, Vol. 45, Pp. 524-535.
Chcn, G. (1994) Approximate Kalman Filtering. World Scientific. Singapore. Lewis, F. (1986) Optimal estimation. Wiley Interscience, USA.
Neeleman, R, End, E.J. van den and Boxtel, A.J.B. van (1999). Estimation of Respiration Quotient in Bicarbonate Buffered Media. Ninth European Congress on Biotechnology, Brussels, 
van ‘t Riet, K. and Tramper, H. (1991) Basic Bioreactor Design. Marcel Dekker, Inc., New York, USA. Royce, P.N (1992) Effects of Changes in the pH and Carbon Dioxide Evolution Rate on the Measured
Respiratory Quotient of Fermentations. Biotechnology and Bioengineering, Vol. 40, Pp. 1129-1138.
.Stephanopoulos, G. and San, K. (1984) On-Line Bioreactor Identification. I. Theory. Biotechnology and Bioengineering, Vol. 26, Pp. 1176-1188.
Vallino, J.J., Stephanopoulos, G. (1993) Metabolic flux distributions in Corynebacterium glutamicum during growth and lysine overproduction. Biotechnology and Bioengineering, Vol. 41, Pp. 633-646.
Wang, H.Y., Cooney, C.L, and Wang, D.I.C. (1979) Computer Control of bakers' yeast production. Biotechnology and Bioengineering, Vol. 21, Pp. 975-995.
Wu,  Wang, P -M. (1993) On-line optimal control for ethanol production. Journal of Biotechnology,
Vol. 29, Pp. 257-266.
216
FERMENTATION PHASE DETECTION USING FUZZY CLUSTERING TECHNIQUES AND NEURAL NETWORKS FOR IMPROVED CONTROL
TAKOI K. HAMRITA AND SHU WANG
Dept. of Biological and  Engineering
University of Georgia takoi@bae.uga.edu, Fax (706) 542-8806
\. Introduction
Phase detection is important for supervision and control of fermentation processes. A new approach for phase detection is developed and applied to simulations of a Gluconic acid fermentation. The method uses fuzzy clustering to identify culture phases off-line.
Using clustering results, neural networks are trained and used for on-line phase detection. The fermentation industry is becoming increasingly important as many fermentation products are being commercialised and used in the pharmaceutical, food, and chemical industries. A well-controlled fermentation process can reduce production costs, increase yield and maintain quality of metabolic products (Shimizu, 1996). During fermentation the microbial species continuously undergo physiological changes.
Many researchers define these as different physiological states or phases of the microbial population (Konstantinov et al., 1989; Karim et al., 1997). A new approach, physiological state control, which accounts for fermentation physiological changes, has been proposed recently (Konstantinov et al., 1989). This approach decomposes the fermentation process into several phases. In every phase the cell population expresses stable characteristics and an invariant control strategy is applied to each phase. One of the most important aspects of this new approach is the ability to determine on-line the current phase of the fermentation (Konstantinov et al., 1989). Moreover, since phase transitions occur gradually and in a smooth fashion, it is necessary to develop techniques which identify the phases and the smooth transitions between them in realtime.
Fuzzy clustering has been shown to identify variable structure behaviour of dynamic processes through a study concerning modelling of sleep dynamics (Kosanovic et al.,
1994). The author also pointed out that this method could be used to model physiological processes, where several dynamics act together to produce an overall process (Kosanovic et al., 1995). The only constraint is that the system be quasistationary and that the variables used in clustering reflect the quasi-stationary dynamics. As pointed out by Konstantinov et al. (1989), fermentations do exhibit quasi-stationary
217
M. Hofman and P. Thonart (eds.). Engineering and Manufacturing for Biotechnology, 217–226. © 2001 Kluwer Academic Publishers. Printed in the Netherlands.