

Engineering and Manufacturing for Biotechnology - Marcel Hofman & Philippe Thonart
.pdfTakoi K. Hamrita and Shu Wang
behaviour and certain process variables, especially physiological ones, are indicative of this behaviour.
Hence, in this chapter, a new technique for fermentation phase detection is developed using fuzzy clustering. Clustering results are used to train neural networks to recognise different process phases in real-time. Since the Elman-Jordan network structure is well suited for temporal data, it is used in this study. The resulting real-time phase detection technique based on fuzzy clustering and neural networks is an easier, more effective alternative to using heuristic expert knowledge and fuzzy logic and can be the basis for much improved supervisory, diagnostic and control systems for fermentation. Excellent results have been obtained using simulated data.
2. Fermentation phase detection
2.1. OFF-LINE PHASE DETECTION USING FUZZY CLUSTERING
2.1.1. Variable selection for phase detection
The selection of variables for phase detection should be implemented only after accumulation of a sufficient base of knowledge of physiology and the behaviour characteristics of the population. These variables should have clear relationship with the phase state of the fermentation and have a low-level noise corruption (Konstantinov et al., 1991). Specific Metabolic Rates, especially specific growth rate, are popular variables for phase detection (Konstantinov et al., 1989). But in many cases, the calculation of the desired variables for phase detection might be difficult, inaccurate or impossible. "Then these variables can be replaced with other variables which describe, in a known manner, the phenomena of interest." (Konstantinov et al., 1992).
2.1.2. Fuzzy clustering for off-line phase detection ofpenicillin-G fed-batch fermentation
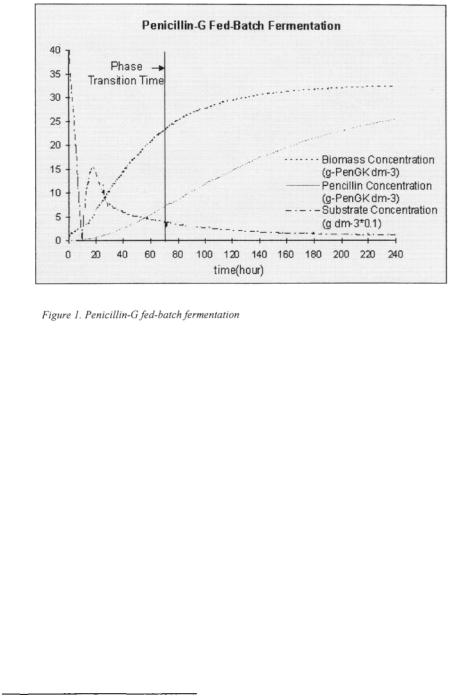
To test effectiveness of the fuzzy clustering algorithm in identifying process phases offline, we will first test this technique using simulations of a process for which phases are known a priori. The Penicillin-G fedbatch fermentation is chosen since a multiphase mathematical model is available for it in the literature (Menezes et al., 1994). There are two phases in this fermentation, growth phase and production phase (Menezes et al., 1994). In the growth phase the process produces large quantities of biomass, predominantly utilising the substrate in the initial media. As the initial substrate becomes exhausted, feed additions being made to the bioreactor are increased. During the production phase the substrate additions are maintained at a rate which keeps the substrate concentration at a low level. This results in a low growth rate (Ignova et al.,
1996). In this phase most Penicillin is produced (Menezes et al., 1994).
Figure 1 shows a simulation of the model in (Menezes et al., 1994). Under the initial conditions used, the phase transition time of this fermentation is known to occur around the 70th hour.
218
Fermentation Phase Detection For Improved Control
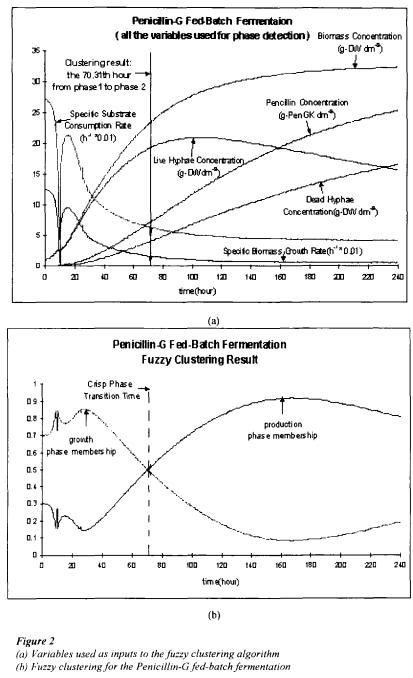
Fuzzy clustering is applied to this process to identify the already known phase transition time. The fuzzy clustering algorithm proposed by Kaufman (1990) is used. The NCSS 6.0 software package 1 is used to implement the clustering algorithm. Seven variables are used for phase detection and they are: specific biomass growth rate, specific substrate consumption rate, biomass concentration, live hyphae concentration, dead hyphae concentration, production concentration and time, see figure 2(a). After converting fuzzy clustering results into crisp results, the identified phase transition time is at 70.31 hours. Compared with the known phase transition time at the 70th hour, it is apparent that fuzzy clustering was effective in phase detection, see figure 2(b). Since these results are encouraging, we will proceed by applying fuzzy clustering to a more complex fermentation, that of Gluconic acid batch fermentation by the microorganism
Pseudomonas ovails.
1 Number Crunch Statistical System. Kaysville, Utah 84037
219
Takoi K. Hamrita and Shu Wang
220
Fermentation Phase Detection For Improved Control
2.1.3. Fuzzy clustering for off-line phase detection ofgluconic acid batch fermentation
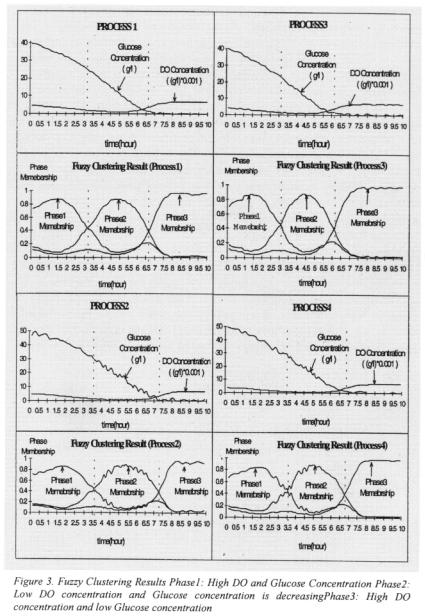
The nonlinear model provided by Foss at al. (1995) is used in this study to simulate the Gluconic acid batch fermentation. This Gluconic acid fermentation consists of three phases. At the beginning of the batch, the production of Gluconolactone is small due to the small concentration of cells. Hence the production of Gluconic acid is small due to the low concentration of Gluconolactone. This phase is characterised by relatively high concentrations of both dissolved oxygen (DO) and glucose. In the intermediate phase of the fermentation, the production of cells and Gluconolactone proceeds at high rate.
Some Gluconic acid is produced. This phase is characterised by a relatively low concentration of DO and a decreasing concentration of glucose. During the final phase of the fermentation, the production of cell and Gluconolactone is reduced due to shortage of glucose. The only significant reaction is production of Gluconic acid from
Gluconolactone. This phase is characterised by low glucose concentration and high DO concentration. Hence, there is strong evidence that phases for this process can be characterised by the concentrations of DO and glucose (Foss et al., 1995).
Fuzzy clustering is applied to identify the three phases of this fermentation process.
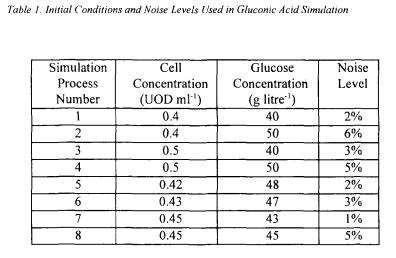
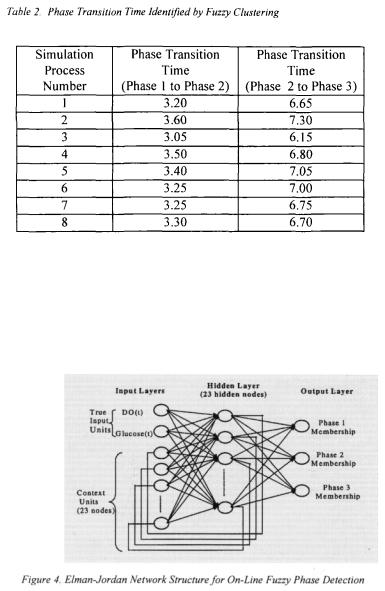
Eight process simulations were carried out. Glucose and DO concentrations were used as inputs to the clustering algorithm. The initial states of cell and glucose concentrations were chosen from the intervals [0.4, 0.5] and [40, 50]. Table 1 shows the initial conditions under which these simulations were conducted as well as the applied noise levels. Fuzzy clustering results for the eight process simulations are shown in table 2 where fuzzy phase results were converted to crisp phase results. Phase transition times identified by clustering are different for all eight simulations. This is expected since each simulation was carried out using different initial conditions and noise levels.
221
Takoi K. Hamrita and Shu Wang
222
Fermentation Phase Detection For Improved Control
Figure 3 shows the fuzzy clustering results. The relationships between Glucose and DO concentrations for each of the identified phases are consistent with those identified by expert knowledge (Foss et al., 1995). These relationships are summarised at the bottom of Figure 3. It is important to note that clustering not only identified the phases of the fermentation but it also identified the smooth transition regions between them.
2.2. NEURAL NETWORKS FOR ON-LINE FUZZY PHASE DETECTIO1
Fuzzy clustering results were used to train NNs for on-line phase detection of the Gluconic acid fermentation. Since the Elman-Jordan NN is well suited for classifying time-series data, it is used in this experiment for phase detection. The input layer consists two true inputs nodes, a time sample of Glucose and DO concentrations. The remaining nodes of the input layer are fed back from the hidden layer. The NN consists of three outputs with each output representing the degree of membership of any time sample to one of the three phases. The optimum number of hidden nodes for this
223
Takoi K. Hamrita and Shu Wang
network was experimenting determined to be nine. The NN is implemented us Neuroshell  Figure 4 shows the architecture of this network.
2 Ward System Group, Inc. Frederick, MD 21702
224

Fermentation Phase Detection For Improved Control
Process simulations one, two, and three in table 1 are used by the NN as training set. Process simulation four is used by the NN as test set to check for convergence of the network. The sequential training approach, which was shown in (Karim et al., 1992) to give best results, is used here to train the NN. The NN is first trained with data from one simulation process out of the training set. After processing 61 data patterns, the network temporarily stops training, reads the test set and computes an average error for it. Test set average error graph is obtained with the test set average errors plotted against the numbers of training patterns. By watching the test set average error graph, training is stopped when the test set average error is no longer decreasing and over-fitting happens. Then the NN weights are saved and used as initial weights for the next data set from another process simulation out of the training set. This training process continues iteratively until the NN can identify the phases of process simulation four effectively.
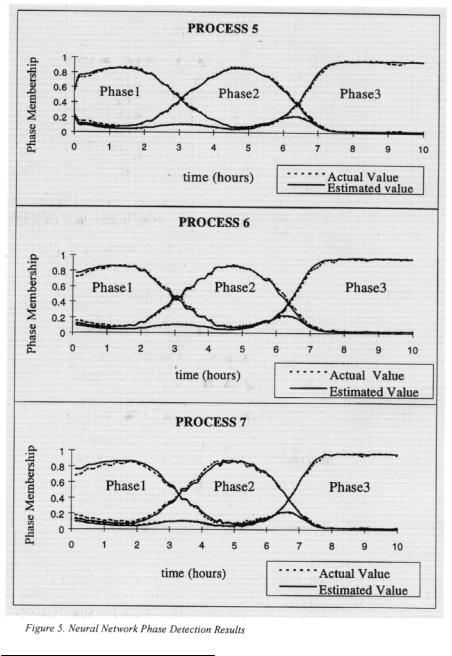
Process simulations five, six, seven and eight in table 1 are used to evaluate effectiveness of the NN in detecting the phases of process simulations it has not seen before. Figure 5 shows phase detection results of the NN for process simulations five,
six, and seven compared to those |
obtained using fuzzy clustering. The |
values for |
each of the membership functions |
for all three process simulations are over 0.99. With |
|
each new time sample of glucose and DO concentrations, the NN predicts precisely to what degree the fermentation is in phase one, two, or three. Since the three testing process simulations were performed with different initial conditions and noise levels than the four training ones, phase transition times were also different for these simulations. The NN successfully identified these new transition times.
3. Conclusion
A new technique for off-line and on-line fermentation phase detection was developed and successfully applied to simulations of a Gluconic acid fermentation. This technique which is based on fuzzy clustering and NNs is a better alternative to simply using expert knowledge for phase detection. In addition to detecting the phases of a fermentation, the technique has the advantage of identifying the smooth transitions between the phases. This information could be used as a basis for developing controllers with smooth control during phase transitions. The technique was tested with simulations at various initial conditions and noise levels and proved to be insensitive to noise.
References
1.Foss B.A., T.A. Johansen and A.V. Sorensen (1995). Nonlinear predictive control using local models applied to a batch fermentation process. Control Engineering Practice 3(3), 389-396.
2.Ignova M, G.C. Paul, J. Glassey, A.C. Ward, G.A. Montague, C.R. Thomas and M.N. Karim (1996).
Toward intelligent process supervision: industrial penicillin fermentation case study. Computers Chem.
Eng. 20, Suppl.. S545-S550.
3.Karim M.N. and S.L. Rivera (1992). Artificial intelligence neural networks in bioprocess state estimation. Adv. Biochem. Eng. Biotechnol. 46, 1-22.
4.Karim M.N., T. Yoshida, S.L. Rivera, V.M. Saucedo, B. Eikcns and G-S OH (1997). Global and local neural network models in biotechnology: application to different cultivation processes. Journal of
Fermentation and Bioengineering, 33(1), 1-11.
225
Takoi K. Hamrita and Shu Wang
5.Kaufman L. (1990). Finding groups in data: an introduction to cluster analysis, John Wiley, New York.
6.Kosanovic B.R., L.F. Chaparro, M-G. Sun, R.I. Sclabassi (1994). Physical system modelling using
temporal fuzzy sets. Proc. of the Inter. Joint Conf. ofNAFIPS/IFlS/NASA '94, 429-433.
7.Kosanovic B., L.F. Chaparro and R.J. Sclabassi. (1995). Hidden process modelling. Proceedings ICASSP-95 (5), 2935-2938.
8.Konstantinov K.B. and T. Yoshida (1991a). A knowledge-based pattern recognition approach for realtime diagnosis and control of fermentation processes as variable structure plants. IEEE Trans. On
Systems, Man and Cybernetics 21 (4), 908-914.
9.Konstantinov K.B., R. Aarts and T. Yoshida (1992). On the selection of variables representing the physiological state control of cell cultures. IFAC Modelling and Control of Biotechnical Processes,
 USA, 263-266.
10.Konstantinov K.B. and T. Yoshida. 1989. Physiological state control of fermentation processes.
Biotechnology and Bioengineering 33, 1145-1156.
1 1 . Menezes J.C. and S.S. Alves (1994). Mathematical modelling of industrial pilot-plant Penicillin-G fed- batch fermentations. J. Chem. tech. Bio/echnol. 61, 123-138.
12.Shimizu K. 1996. A tutorial review on bioprocess systems engineering. Computers Chem. Engng.
20(6/7), 915-941.
226
SIMULATION, DESIGN AND MODEL BASED PREDICTIVE CONTROL OF PHOTOBIOREACTORS
J.-F. CORNET*, C.G. DUSSAP* AND J.-J. LECLERCQ**
*  Blaise Pascal, Laboratoire de Genie Chimique et Biochimique (LGCB), 24 avenue des Landais, F63177 Aubière Cedex. ** ADERSA, 10 rue de la Croix Martre, F91873 Massy.
Abstract
A simple generalised two-flux approach is presented for modelling radiant light transfer in photobioreactors. A predictive method to obtain optical properties for the medium, based on the Lorenz-Mie theory is discussed. In the same way, a biochemically structured approach is proposed to predict stoichiometries of reactions, including energetic aspects. The formulation for coupling available light and kinetic rates is then proposed by defining a working illuminated volume. The obtained model, compared to experimental results in many different conditions, is proved to be a good tool for simulation, design and predictive control of photobioreactors.
1. Introduction
Engineering of photobioreactors (PBRs) becomes a field of increasing importance, for production of valuable products from micro-algae, for CO2 exhaustion or as a part of Closed Ecological Life Support Systems for food production and O2 regeneration. In order to develop processes in axenic conditions, and highly operative in quality and productivity, artificial PBRs illuminated with lamps are preferred to solar open or semiclosed PBRs. Such artificial reactors can then be fully controlled if predictive models exist for biomass quality and productivity.
For the mathematical modelling of photobioreactors it is necessary to understand and formulate the coupling between the metabolism of micro-organisms and the physical phenomenon of light transfer inside the culture medium. PBRs are governed by radiant light energy availability, which is highly heterogeneous within the culture volume (Aiba, 1982; Cornet et al., 1992; Cassano et al., 1995; Acien-Fernandez et al., 1997). This spatial heterogeneity causes varying local reaction rates, which makes it necessary to derive local equations and calculate the mean volumetric growth rate by
227
M. Hofman and P. Thonart (eds.), Engineering and Manufacturing for Biotechnology, 227–238. © 2001 Kluwer Academic Publishers. Printed in the Netherlands.