

Engineering and Manufacturing for Biotechnology - Marcel Hofman & Philippe Thonart
.pdfMETABOLIC FLUX MODELLING AS A TOOL TO ANALYSE THE
BEHAVIOR OF A GENETICALLY MODIFIED STRAIN OF
SACCHAROMYCES CEREVISIAE
URRIETA-SALTIJERAL J.M., DUSSAP C.G., PONS A., CREULY
C. AND GROS J.B.
Laboratoire de Génie Chimique et Biochimique, Université Blaise Pascal.
63177 Aubière cedex-FRANCE - Fax 33 4 73 40 78 29. dussap@gecbio.univ-bpclermont.fr
Abstract
Flux distribution for a wild and a mutant strain of Saccharomyces cerevisiae are compared and investigated in terms of metabolic flux calculation and thermodynamic analysis of central metabolism under anaerobic conditions. Starting from a redundant set of measured rates obtained from batch cultures on glucose or fructose as carbon source, an original data reconciliation technique associated with the calculation of metabolic flux is used. Comparative analysis of carbon split in the metabolic network for the mutant yeast strain lacking the glucose6P-dehydrogenase (CD101-1A) and for the reference wild strain (ATCC 7754) allows to conclude that the pentose phosphate is in priority devoted to its anabolic function rather than to the production of NADPH cofactors. This last function seems to be as well assumed by the specific NADP acetaldehyde dehydrogenase enzyme ; this explains the significantly higher production of acetate by the mutant strain.
1. Introduction
Cellular functions of a micro-organism are closely related to the environmental conditions (temperature, pH, nature and concentrations of substrates) and to the genetic particularities of the strain. Also, the chemical energy conversion systems are intimately linked to the macroscopic behaviour of the strain in a bioreactor. Providing that variations are not lethal, changes in the environment of the cell as well as its genetic material are followed by modifications, leading to observe changes of cellular functions, such as biomass composition and new metabolites synthesis. A useful tool to investigate these metabolic possibilities is the quantification of intracellular flux in the metabolic pathways. This methodology has been confirmed for investigating the
143
M. Hofman and P. Thonart (eds.), Engineering and Manufacturing for Biotechnology, 143–156.
© 2001 Kluwer Academic Publishers. Printed in the Netherlands.
Urrieta-Saltijeral J.M., Dussap C.G., Pons A., Creuly C. and Gros J.B
catabolic, anabolic and the energy conversion pathways of a micro-organism giving an integrated view of the metabolism on the basis of intracellular metabolites conversion constraints (Vallino and Stephanopoulos, 1990 ; Nielsen and Villadsen, 1994 ; Pons et al, 1996 ; Lee and Papoutsakis, 1999).
During the last decade, metabolic engineering has been widely developed to propose a rational analysis of metabolic pathways and to help in deep understanding of cellular metabolism. Metabolic engineering associates genetic engineering and microbial physiology in a mathematical model with the aim to predict the rise of the yield of desired product as well as the decrease of an unwanted metabolite (Goel et al, 1999). Quantification of metabolic flux stands as an important aspect of these studies in providing a direct and accurate picture of the transformation of a particular substrate by a defined micro-organism (Vallino and Stephanopoulos, 1993). It is based on the proposal of a metabolic network including the main functions of the cell and taking into account the eventual genetic modifications. The step of validation of the stoichiometries stipulated in the network stands as a major point, in order to be used in the area of metabolic engineering.
However, until now, only few studies based on metabolic flux analysis are agreed through the use of experimental data (Vanrolleghem et al, 1996 ; Pramanik and Keasling, 1997). In majority, existing models are structured on the basis of a priori knowledge of the metabolism of the micro-organism under study with biochemical reactions and energetic parameters mainly established from literature data (Çalik et al, 1999). To validate the stipulated network, experimental strategy must at least include a study of the environmental culture conditions on the micro-organism behaviour.
An extended study including these aspects was performed with the yeast Saccharomyces cerevisiae , a reference strain and a genetically modified one being under study with various environmental conditions.
Saccharomyces cerevisiae is a versatile organism that is used for production of a whole range of different products. The physiology and the cell function strongly depend on the environment of the cells and on the genetic characteristics of the strains, leading to a great diversity of possible behaviours. An important part of research on S. cerevisiae physiology has been focused on its aerobic growth whereas anaerobic metabolism is generally considered to be simpler, leading to a c.a. equimolar production of carbon dioxide and ethanol. However in many yeast fermentation processes, especially in food industry, production of other by-products in much smaller amounts may become important, calling for a thorough understanding of yeast metabolism in anaerobic conditions. The tool used in the approach for evaluating the cell metabolism is the intracellular flux analysis based on the mass balance technique.
The present study concerns the following aspects:
•obtaining complete experimental sets concerning the carbon compounds excreted during anaerobic growth of two Saccharomyces cerevisiae strains (one ATCC 7754 strain and a genetically modified strain) cultivated on glucose or fructose in batch
|
fermentor; |
• |
determination of specific growth rates and products yields ; |
• |
selection of a consistent metabolic network from a flux computation technique |
|
using a data reconciliation method and an associated statistical analysis ; |
144

Metabolic flux modelling of a genetically modified strain of saccharomyces cerevisiae
•comparison of intracellular metabolic fluxes obtained in the 4 cases (2 strains, 2 substrates) in terms of metabolic bottlenecks and of distance from thermodynamic equilibrium.
2. Materials and methods
2.1. MICROORGANISMS AND GROWTH CONDITIONS
An ordinary baker yeast (ATCC 7754) and a glucose-6P dehydrogenase null mutant strain (CD101-1A: MAT alpha, his3, leu2, ura3, ade2, trpl, met19::URA3) were under study. The mutant strain was constructed and furnished to us by the Centre de Génétique Moléculaire d’Orsay, France (Thomas et al, 1991). Anaerobic batch cultures of the yeasts were done at 30°C in an automatically controlled fermentor Biostat ED (B.BRAUN, Germany) with a volume of 4 litres and a stirring speed of 500 rpm. The pH was regulated at 5 with 2N-NaOH addition. The mineral culture medium was
prepared according to Kristiansen (1994): |
, |
sodium glutamate 
 and supplemented with vitamins and trace metals. A mixture of adenine and amino acids (histidine, leucine, tryptophane and methionine) was added to the cultures of the mutant strain at initial concentration enabling final biomass concentration of c.a. 20 g
  (Oura, 1983). It is well established that addition of sterols and unsaturated fatty acids to the medium is required for optimal growth of S. cerevisiae under strictly anaerobic conditions (Andreasen and Stier, 1953, 1954). The carbon sources used were glucose or fructose with initial concentration in the reactor of
2.2. ANALYSIS OF METABOLITES
Glucose, fructose, ethanol, glycerol, succinic acid, lactic acid, acetic acid and pyruvic acid were determined with High Performance Liquid Chromatography fitted with two ionic exclusion columns (PHENOMENEX Rezex ROA-300x7.8mm). Cell mass was measured by dry weight (24 h drying in an oven at 110°C). Carbon dioxide evolution was determined by integration of the gas flow rate measured by a mass flow-meter
(Tylan, Mettler-Toledo). All the measurements were expressed as volumetric concentrations compensated for sampling, and dilution effects.
2.3. FLUX ESTIMATION AND STATISTICAL ANALYSIS
Metabolic fluxes were calculated from a mass balance technique. This method takes into account the stoichiometric reactions obtained by an analysis of the internal behaviour of the micro-organism. In the mass flux balance-based analysis, a pseudo- steady-state (PSS) approximation for the metabolic intermediates is assumed (Vallino and Stephanopoulos, 1990, Nielsen and Villadsen, 1994). The bioreaction network is used to determine the rates of production and consumption of each metabolite in the
145
Urrieta-Saltijeral J.M., Dussap C.G., Pons A., Creuly C. and Gros J.B
network  as a function of all the unknown fluxes
  for the
  reaction). The accumulation rate of a metabolite in a metabolic network is given by the summation of all reactions producing that metabolite minus the reactions consuming it:
where  are the stoichiometric coefficients,
  is the flux through reaction m and
  is the accumulation rate of metabolite j.
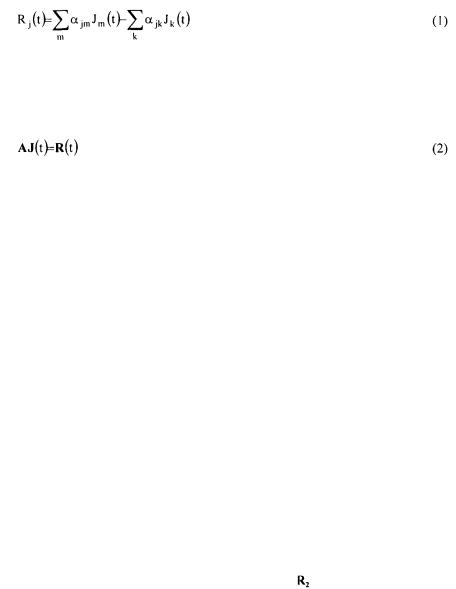
The set of equations formed from such balances for each metabolite in the network is represented in matrix notation by :
A is the (c x r) matrix of stoichiometric coefficients (c metabolites reactions) of all the reactions involved in the metabolism. Each column in the matrix represents a metabolic reaction.
The c metabolic constituents are divided into two categories :
•the n exchangeable compounds, which are exchanged with the growth medium ; from a macroscopic point of view, these compounds are the products and the substrates involved during the cellular growth phase ; their accumulation rates are linked to growth yields ;
•the m non-exchangeable compounds, which are only involved inside the cell; for these the accumulation rate is assumed to be equal to zero. This is the pseudo- steady state hypothesis that expresses that the rate of accumulation of intracellular
compounds is negligible compared to the rates of production / consumption of exchangeable compounds (Vallino and Stephanopoulos, 1990).
Since metabolic networks generally contain more than 100 reactions, cyclic and/or parallel pathways may have been introduced (Fell, 1990). Such cycles have to be detected, then suppressed before the step of flux calculation. Cycle detection can be performed through a mathematical procedure based on the graph methodology (Veverka and Madron, 1997). Cycle elimination is obtained by supplying d new rows containing pertinent information founded on the metabolic capacities of the microorganism under study.
Assuming that during a sufficiently long period of growth the yields remain constant (some of them being measured), and that non-exchangeable compounds are not accumulated inside the cell, the previous equation (2) is split in two parts : the first part  corresponds to the known accumulation rates
  (non-exchangeable compounds, measured yields and the d rows relevant to cycle elimination), the second part
  being
being
the remaining rows corresponding to the unknown rates (Pons et al, 1996).
The total number of supplied information must at least be equal to the number of columns i.e. of unknown fluxes J. In case of equality, the provided matrix  is of full rank, and fluxes are calculated by inversion of the matrix. In case of redundant information (more independent rows than columns) a data reconciliation technique is
146

Metabolic flux modelling of a genetically modified strain of saccharomyces cerevisiae
worked using the conservation laws of non-exchangeable compounds as constraints. To solve this problem of optimisation under constraints, we use a Lagrange method in
minimising a quadratic criterion |
calculated between the n’ measured values of the |
yields contained in  and the computed values
  (Dussap et al, 1997):
where w is the diagonal weighted matrix of the n’ experimental values in  which accounts for the accuracy of the determination. In the case under study, variances
  of the measured yields are known and elements of w are given by:
The Lagrange function to be considered is given by :
where  is a matrix
  and
and  is a vector
  contains all the rows corresponding to the m non-exchangeable compounds plus the d relationships between some of the fluxes necessary to eliminate to metabolic cycles included in the network
(Dussap et al, 1997).
The r flux of J and  values of
 vector are calculated by solving the system :
The solution is given by :
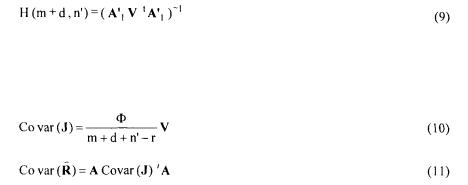
where V, H and G matrices are defined as:
147
Urrieta-Saltijeral J.M., Dussap C.G., Pons A., Creuly C. and Gros J.B
The re-calculated conversion rates values are given by  where the (m+d) drawn values are found by construction. The standard deviations of the calculated flux and rates are estimated by diagonals elements of matrices of covariance :
This set of equations gives the best estimates of all the yields and all of the fluxes.
Statistical analysis also provides the standard deviations of the estimation (Equations
10, 11).
3. Results and discussion
3.1. GROWTH YIELDS DETERMINATION
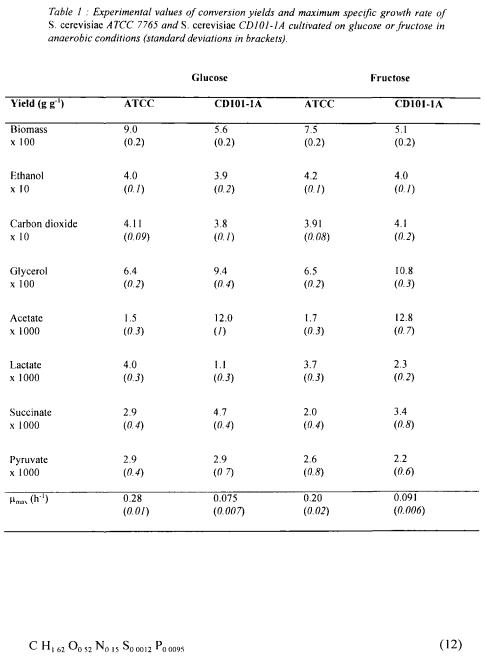
The two strains produced in addition to biomass, carbon dioxide and ethanol, significant quantities of glycerol, lactate, acetate, pyruvate and succinate in various proportions depending on the strain and on the carbon substrate. No production of acetoin, acetaldehyde or other compounds specific of anaerobic metabolism have been detected.
The measured liquid phase concentrations have been plotted against total carbon substrate (glucose or fructose) consumption. The results obtained indicate that the data could be treated by linear regression (constant yields) over a period of 25 h corresponding to substrate consumption of  Specific growth rates have been calculated by semi-log plotting of biomass concentration versus culture time. The reproducibility of the experiments has also been checked by comparison of two sets of data obtained in similar conditions. The average values of carbon compounds yields and the maximum specific growth rates are reported in table 1. Importantly, the calculation also includes estimations of the standard deviations (Himmelblau, 1968). These results correspond to a global carbon and available electron recovery from 95 to 100 %.
Significant differences between the cultures were observed :
• |
higher growth rates of the ATCC 7754 strain ; |
• |
higher growth rates on glucose than on fructose substrate for the ATCC 7754 |
|
strain; |
• |
higher production of glycerol, acetate and succinate by the mutant strain ; a 10 fold |
|
value is observed for acetate ; |
• |
less synthesis of biomass by the mutant strain ; |
•small relative differences for the two main products carbon dioxide and ethanol.
148
Metabolic flux modelling of a genetically modified strain of saccharomyces cerevisiae
3.2. SELECTION OF A RELIABLE METABOLIC NETWORK
Assuming the detailed composition of yeast cell from Oura (1983), the following global composition of biomass was established :
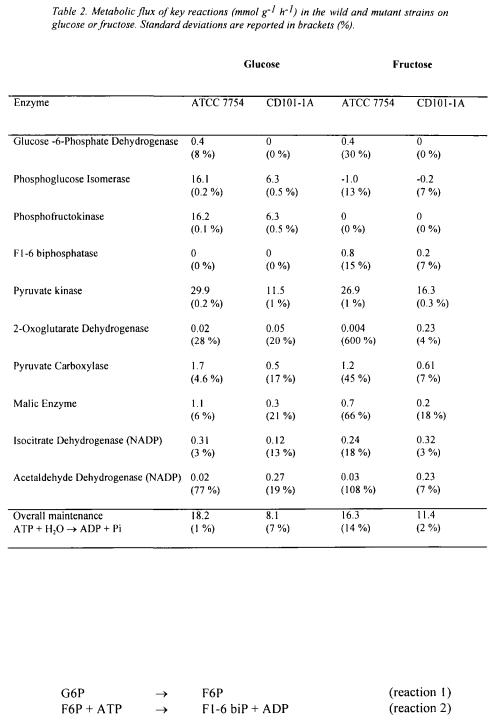
According to the known synthesis pathways of amino acids, lipids, nucleic acids and carbohydrates, a metabolic network of 117 reactions was built where compartmentation was not considered. This network includes several possible anaplerotic pathways e.g.
149
Urrieta-Saltijeral J.M., Dussap C.G., Pons A., Creuly C. and Gros J.B
pyruvate carboxylase, malic enzyme, PEP carboxykinase, glyoxylic shunt, and parallel sequences of reactions such as phosphofructokinase / fructose 1,6-biphosphatase and NAD dependent isocitrate dehydrogenase / NADP dependent isocitrate dehydrogenase. The presence of so-called substrate cycles (Fell, 1990) has therefore been revealed, imposing to choose among several sets of operative enzymes in order to manage metabolic flux calculation. Importantly, the yields reconciliation using the metabolic network as internal constraint (including stoichiometry conservation) was performed with the values of the yields weighted by their experimental variance. This means that the final quadratic criterion can be interpreted as a variance ratio (variance of the lack of adequacy of the model divided by the variance of experimental error) enabling to take a rational decision for selecting the correct model. In the present study, the dimensionless criteria are always lower than  which is the value of the Fisher, test distribution (3 degrees of freedom for the reconciliation method and 20 degrees of freedom for the determination of each yield).
The best results, consistent on a statistical basis, are obtained if pyruvate carboxylase, malic enzyme, ICDH-NADP, F1,6 biphosphatase on fructose and phosphofructokinase on glucose are chosen as operative enzymes for all conditions considering in addition that for the mutant strain the G6Pdehydrogenase is not working.
The results of the identification are given in the table 2 for the main key reactions, knowing that the experimental results and the selected network lead to thermodynamically consistent values for all the rates e.g. no negative fluxes in irreversible reactions.
3.3. DISCUSSION
From the previous calculations, several points can be outlined :
•2-oxoglutarate dehydrogenase specific rate is almost zero for the ATCC 7754 strain if glucose or fructose are used whereas the mutant strain exhibits a significant positive value on fructose;
•Pyruvate kinase specific rate is twofold higher for the ATCC strain than for the mutant strain, not depending on the substrate;
• |
Glucose-6-phosphate-dehydrogenase (G6PDH) specific rate of ATCC 7754 strain |
|
is not affected by the nature of substrate ; the very low value corresponds to a split |
of carbon in the oxidative branch of the pentose phosphate pathway of 2 - 3 % of the total carbon flux. This is in agreement with the results of Lagunas and Gancedo
(1973);
•A central role is played by the enzyme acetaldehyde dehydrogenase NADP
dependent in the synthesis of the so-called reduced cofactors by the mutant strain ; its specific rate is significantly different from zero with the mutant strain compared to the reference strain for which it can be assumed that the enzyme is not operative.
150
Metabolic flux modelling of a genetically modified strain of saccharomyces cerevisiae
3.4. THERMODYNAMIC ANALYSIS
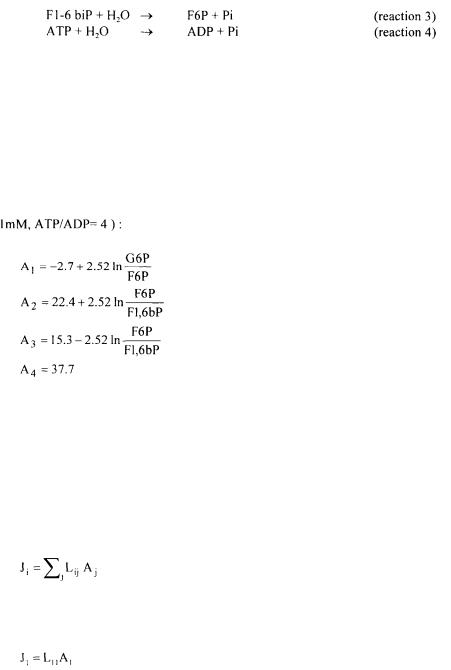
As the major differences in the topology of metabolism for the considered situations are located at the upper part of glycolysis (phosphofructokinase, fructose 1-6 biphosphatase, G6PDH), a thermodynamic analysis has been performed for the following reactions :
151
Urrieta-Saltijeral J.M., Dussap C.G., Pons A., Creuly C. and Gros J.B
The rate laws express reaction velocities as function of concentrations. In an approach based on the principles of non equilibrium thermodynamics (Heinrich and Schuster, 1996 ; Dussap, 1988), velocities are expressed in terms of thermodynamic forces. Basically the reactions are supposed to be driven by reaction affinities in a multilinear way just as heat flow by temperature gradients and mass diffusion by concentration gradients.
The reaction affinity Ai is defined as the negative change in Gibbs free energy accompanying the reaction i. Using the Gibbs energies of formation of the compounds (Ould-Moulaye et al , 1999), the following values of the reaction affinities  were obtained
  intracellular
  mM, ionic strength
It must be outlined that such calculations need:
•to select Gibbs energies values of formation for the compounds from a unique reference state;
•to account for the detailed composition of the solution including all ionic species
resulting from acid dissociation and complexation (Ould-Moulaye et al, 1999).
The thermokinetics approach is particularly appropriate for reactions the detailed kinetics of which are incompletely known in physiological conditions (intracellular conditions). In this case, the linear approximation in the vicinity of thermodynamic equilibrium  leads to:
The first reaction catalysed by phosphoglucose isomerase obviously corresponds to this case :
From the results of metabolic flux calculation (Table 2) and considering that for the highest specific value of reaction rate (ATCC strain on glucose) the G6P/F6P ratio is 1.5 times the equilibrium value, one obtains:
152