

aswath_damodaran-investment_philosophies_2012
.pdf270 |
INVESTMENT PHILOSOPHIES |
life and the more activist value investing that has brought him success in recent years.
V a l u e S c r e e n s
The Graham approach to value investing is a screening approach, where investors adhere to strict screens (like the ones described earlier in the chapter) and pick stocks that pass those screens. Since the data needed to screen stocks are widely available today, the key to success with this strategy seems to be picking the right screens. In this section, we consider a number of screens used to pick value stocks and the efficacy of these screens.
B o o k V a l u e M u l t i p l e s The book value of equity measures what accountants consider to be the value of equity in a company. The market value of equity is what investors attach as a value to the same equity. Investors have used the relationship between price and book value in a number of investment strategies, ranging from the simple to the sophisticated. In this section, we begin by looking at a number of these strategies and the empirical evidence on their success.
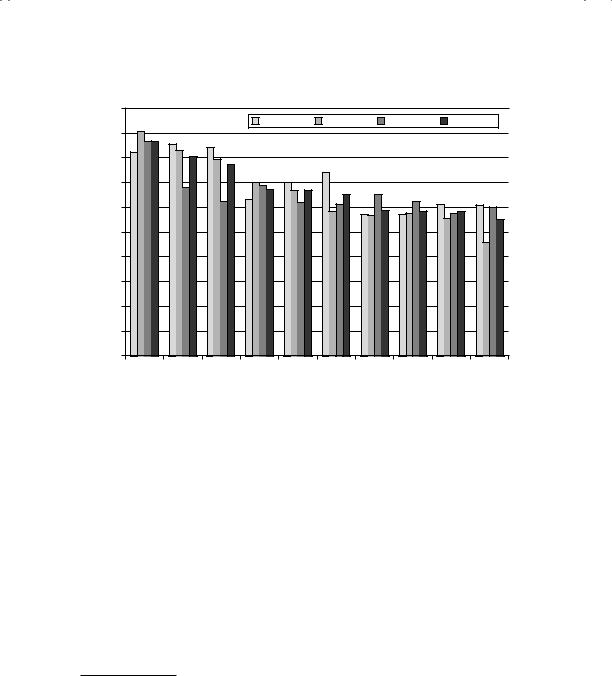
Buy Low Price-to-Book Value Companies Some investors argue that stocks that trade at low price-to-book value ratios are undervalued, and there are several studies that seem to back this strategy. Rosenberg, Reid, and Lanstein looked at stock returns in the United States between 1973 and 1984 found that the strategy of picking stocks with high book-to-price ratios (low pricebook values) would have yielded an excess return of about 4.5 percent a year.8 In another study of stock returns between 1963 and 1990, firms were classified on the basis of book-to-price ratios into 12 portfolios, and firms in the lowest book-to-price (highest PBV) class earned an average annual return of 3.7 percent a year, while firms in the highest book-to-price (lowest PBV) class earned an average annual return of 24.31 percent for the 1963 to 1990 period.9 We updated these studies to consider how well a strategy of buying low price-to-book value stocks would have done in the past two decades and compared these returns to returns in earlier time periods. The results are summarized in Figure 8.2.
8B. Rosenberg, K. Reid, and R. Lanstein, “Persuasive Evidence of Market Inefficiency,” Journal of Portfolio Management 11 (1985): 9–17.
9E. F. Fama and K. R. French, “The Cross-Section of Expected Returns,” Journal of Finance 47 (1992): 427–466. They found that the price-to-book ratio explained more of the variation across stock returns than any other fundamental variable, including market capitalization.
Graham’s Disciples: Value Investing |
271 |
20.00% |
|
|
|
|
|
|
|
|
|
|
|
|
1927–1960 |
1961–1990 |
|
1991–2010 |
1927–2010 |
||
18.00% |
|
|
|
|
|
|
|
|
|
16.00% |
|
|
|
|
|
|
|
|
|
14.00% |
|
|
|
|
|
|
|
|
|
12.00% |
|
|
|
|
|
|
|
|
|
10.00% |
|
|
|
|
|
|
|
|
|
8.00% |
|
|
|
|
|
|
|
|
|
6.00% |
|
|
|
|
|
|
|
|
|
4.00% |
|
|
|
|
|
|
|
|
|
2.00% |
|
|
|
|
|
|
|
|
|
0.00% |
|
|
|
|
|
|
|
|
|
Lowest |
2 |
3 |
4 |
5 |
6 |
7 |
8 |
9 |
Highest |
PBV Class
F I G U R E 8 . 2 PBV Classes and Returns, 1927 to 2010
Source: Raw data from Ken French’s Data Library (Dartmouth College).
The lowest price-to-book value stocks earned 6.24 percent more, on an annualized basis, than the high price-to-book stocks across the entire time period (1927–2010); they continued to earn higher annual returns (5.44 percent) than the high price-to-book value stocks between 1991 and 2010.
These findings are not unique to the United States. A study found that the book-to-market ratio had a strong role in explaining the cross-section of average returns on Japanese stocks.10 Another study extended the analysis of price-book value ratios across other international markets, and found that stocks with low price-book value ratios earned excess returns in every market that was analyzed, between 1981 and 1992.11 In their annual update of historical returns on equity markets, Dimson, Marsh, and Staunton report on the returns earned by low price-to-book value stocks in 20 different markets, relative to the market, and find that low price-to-book stocks have
10L. K. Chan, Y. Hamao, and J. Lakonishok, “Fundamentals and Stock Returns in Japan,” Journal of Finance 46 (1991): 1739–1789. They concluded that low price- to-book value stocks in Japan earned a considerable premum over high price-to-book value stocks.
11C. Capaul, I. Rowley, and W. F. Sharpe, “International Value and Growth Stock Returns,” Financial Analysts Journal 49 (1993): 27–36.

272 |
INVESTMENT PHILOSOPHIES |
earned a premium in 16 of 20 markets between 1975 and 2010, with the magnitude of the premium exceeding 4 percent in seven of these markets.12 Thus, a strategy of buying low price-to-book value stocks seems to hold out much promise. Why don’t more investors use it, then? you might ask. We will consider some of the possible problems with this strategy in the next
section and screens that can be added on to reduce these problems.
What Can Go Wrong? Stocks with low price-to-book value ratios earn excess returns relative to high price-to-book stocks if we use conventional measures of risk and return, such as betas. But, as noted in earlier chapters, these conventional measures of risk are imperfect and incomplete. Low price-book value ratios may operate as a measure of risk, since firms that trade well below book value are more likely to be in financial trouble and go out of business. Investors therefore have to evaluate whether the additional returns made by such firms justify the additional risk taken on by investing in them.
N U M B E R W A T C H
Price-to-book ratios by sector: Take a look at the average price-to- book ratios, by sector, for U.S. companies.
The other limitation of a strategy of buying low price-to-book value stocks is that the low book value multiples may be well deserved if companies earn and are expected to continue earning low returns on equity. In fact, we considered the relationship between price-to-book value ratios and returns on equity in Chapter 5. For a stable-growth firm, for instance, the price-to- book value ratio can be written as follows:
Price/book =
(Return on equity − Expected growth rate)
(Return on equity − Cost of equity)
Stocks with low returns on equity should trade at low price-to-book value ratios. In fact, a firm that is expected to earn a return on equity that is less than its cost of equity in the long term should trade at a discount on book value. In summary, then, as an investor you would want stocks with
12E. Dimson, P. Marsh, and M. Staunton, Credit Suisse Global Investment Return Sourcebook 2011 (London: London Business School, 2011).

Graham’s Disciples: Value Investing |
273 |
low price-to-book ratios that also have reasonable (if not high) returns on equity and limited exposure to risk.
If low price-to-book value ratios may yield riskier stocks than average or stocks that have lower returns on equity, a more discerning strategy would require us to find mismatches—stocks with low price-to-book ratios, low default risk, and high returns on equity. If we used debt ratios as a proxy for default risk and the accounting return on equity in the past year as the proxy for the returns that will be earned on equity in the future, we would expect companies with low price-to-book value ratios, low debt ratios, and high return on equity to be undervalued.
M a r k e t V a l u e t o R e p l a c e m e n t C o s t — T o b i n ’ s Q Tobin’s Q provides an alternative to the price-to-book value ratio, by relating the market value of the firm to the replacement value of the assets in place. When inflation has pushed up the price of the assets, or where technology has reduced the price of the assets, this measure may provide a better measure of undervaluation.
Tobin’s Q = Market value of assets/Replacement value of assets in place
The value obtained from Tobin’s Q is determined by two variables— the market value of the firm and the replacement cost of assets in place. In inflationary times, when the cost of replacing assets increases significantly, Tobin’s Q will generally be lower than the unadjusted price-book value ratio. Conversely, if the cost of replacing assets declines much faster than the book value (technology might be a good example), Tobin’s Q will generally be higher than the unadjusted price-book value ratio.
Many studies in recent years have suggested that a low Tobin’s Q is indicative of an undervalued or a poorly managed firm that is more likely to be taken over. One study concludes that firms with a low Tobin’s Q are more likely to be taken over for purposes of restructuring and increasing value.13
While this measure has some advantages in theory, it does have practical problems. The first is that the replacement value of some assets may be difficult to estimate, largely because they are so specific to each firm. The second is that, even where replacement values are available, substantially more information is needed to construct this measure than the traditional price-book value ratio. In practice, analysts often use shortcuts to arrive at
13L. H. Lang, R. M. Stulz, and R. A. Walkling, “Managerial Performance, Tobin’s Q, and the Gains from Successful Tender Offers,” Journal of Finance 24 (1989): 137–154.

274 |
|
|
|
|
|
|
INVESTMENT PHILOSOPHIES |
|||
|
30.00% |
|
|
|
|
|
|
|
|
|
|
1952–1970 |
|
1971–1990 |
|
1991–2000 |
|
|
|
|
|
|
2001–2010 |
|
1952–2010 |
|
|
|
|
|
|
|
|
25.00% |
|
|
|
|
|
|
|
|
|
Return |
20.00% |
|
|
|
|
|
|
|
|
|
|
|
|
|
|
|
|
|
|
|
|
Annual |
15.00% |
|
|
|
|
|
|
|
|
|
|
|
|
|
|
|
|
|
|
|
|
Average |
10.00% |
|
|
|
|
|
|
|
|
|
|
|
|
|
|
|
|
|
|
|
|
|
5.00% |
|
|
|
|
|
|
|
|
|
|
0.00% |
|
|
|
|
|
|
|
|
|
|
Highest |
2 |
3 |
4 |
5 |
6 |
7 |
8 |
9 |
Lowest |
P/E Ratio Class
F I G U R E 8 . 3 Returns on P/E Ratio Classes, 1952 to 2010
Source: Raw data from Ken French’s Data Library (Dartmouth College).
Tobin’s Q, using book value of assets as a proxy for replacement value. In these cases, the only distinction between this measure and the price-to-book value ratio is that this ratio is stated in terms of the entire firm (rather than just the equity).
E a r n i n g s M u l t i p l e s Investors have long argued that stocks with low priceearnings ratios are more likely to be undervalued and earn excess returns. In fact, it was the first of Ben Graham’s 10 screens for undervalued stocks. In this section, we examine whether the screen stands up to the promises made by its proponents.
Empirical Evidence on Low-P/E Stocks Studies that have looked at the relationship between P/E ratios and excess returns have consistently found that stocks with low P/E ratios earn significantly higher returns than stocks with high P/E ratios over long time horizons. Figure 8.3 summarizes annual returns by P/E ratio classes for stocks from 1952 to 2010. Firms were classified into 10 deciles based on P/E ratios at the beginning of each year, and returns were measured during the course of the year.

Graham’s Disciples: Value Investing |
275 |
N U M B E R W A T C H
Sector average P/E ratios: Take a look at the average PE ratio, by sector, for U.S. companies.
Firms in the lowest P/E ratio class earned 12.21 percent more each year than the stocks in the highest P/E class between 1952 and 1970, about 9.74 percent more each year, on average, between 1971 and 1990, and about 9.9 percent more each year, on average, between 1991 and 2010.
The high returns earned by low P/E ratio stocks also persist in other international markets. Table 8.1 summarizes the results of studies looking at this phenomenon in markets outside the United States.
Thus, the results seem to hold up as we go across time and markets, notwithstanding the fact the findings have been widely disseminated for more than 20 years.
What Can Go Wrong? Given the types of returns that low P/E ratio stocks earn, should we rush out and buy such stocks? While such a portfolio may
T A B L E 8 . 1 Excess Returns on Low P/E Ratio Stocks by
Country, 1989 to 1994
|
Annual Premium Earned by |
|
Lowest P/E Stocks (bottom |
Country |
quintile) over the market |
|
|
Australia |
3.03% |
France |
6.40% |
Germany |
1.06% |
Hong Kong |
6.60% |
Italy |
14.16% |
Japan |
7.30% |
Switzerland |
9.02% |
United Kingdom |
2.40% |
|
|
Annual premium: Premium earned over an index of equally weighted stocks in that market between January 1, 1989, and December 31, 1994. These numbers were obtained from a Merrill Lynch Survey of Proprietary Indexes.

276 |
INVESTMENT PHILOSOPHIES |
include a number of undervalued companies, it may also contain other less desirable companies.
Companies with high-risk earnings. The excess returns earned by low price-earnings ratio stocks can be explained using a variation of the argument used for small stocks—that the risk of low P/E ratio stocks is understated in the capital asset pricing model (CAPM). It is entirely possible that a portfolio of low-P/E stocks will include stocks where there is a great deal of uncertainty about future operating earnings. A related explanation, especially in the aftermath of the accounting scandals of recent years, is that accounting earnings are susceptible to manipulation. If earnings are high not because of a firm’s operating efficiency but because of one-time items such as gains from divestitures or questionable items such as income from pension funds, you may not be getting bargains by buying these stocks.
Tax costs. A second possible explanation that can be given for this phenomenon, which is consistent with an efficient market, is that low PE ratio stocks generally have large dividend yields, which would have created a larger tax burden for investors since dividends were taxed at higher rates during much of this period.
Low growth. A third possibility is that the price-earnings ratio is low because the market expects future growth in earnings to be low or even negative. Many low P/E ratio companies are in mature businesses where the potential for growth is minimal or even negative. As an investor, therefore, you have to consider whether the trade-off of a lower P/E ratio for lower growth works in your favor.
Finally, many of the issues we raised about how accountants measure earnings will also be issues when you use P/E ratios. For instance, the fact that research and development (R&D) is expensed at technology firms rather than capitalized may bias their earnings down (and their P/E ratios upward).
E N T E R P R I S E V A L U E T O E B I T D A M U L T I P L E S
The earnings per share of a firm reflect not just the earnings from operations of a firm but all other income as well. Thus, a firm with substantial holdings of cash and marketable securities may generate enough income on these investments to push earnings up. In addition, earnings per share and equity multiples are affected by how much debt

Graham’s Disciples: Value Investing |
277 |
a firm has and what its interest expenses are. These concerns, in conjunction with the volatility induced in earnings by noncash expenses (such as depreciation) and varying tax rates, has led some investors to seek a more stable, cash-based measure of predebt earnings. One measure that has acquired a following is called the enterprise value (EV) to EBITDA multiple, and is defined as follows:
Enterprise value to EBITDA
Market value of equity + Market value of debt = − Cash and marketable securities
Earnings before interest, taxes, depreciation, and amortization
Why, you might wonder, do we add back debt and subtract out cash? Since EBITDA is before interest expenses, you would be remiss if you did not add back debt. Analysts who look at Price/EBITDA will conclude, for instance, that highly levered firms are cheap. Since we do not count the income from the cash and marketable securities in EBITDA, we net it out of the numerator as well.
The sectors where this multiple makes the most sense tend to be heavy infrastructure businesses; steel, telecommunications, and cable are good examples. In these sectors, you can screen for stocks with low enterprise value to EBITDA ratios. As a note of caution, though, in many cases firms that look cheap on an enterprise value to EBITDA basis often have huge reinvestment needs (capital expenditures eat up much of the EBITDA) and poor returns on capital. Thus, we would recommend adding two more screens when you use this multiple—low reinvestment needs and high return on invested capital (ROIC).
R e v e n u e M u l t i p l e s As investors have become more wary about trusting accounting earnings, an increasing number have started moving up the income statement looking for numbers that are less susceptible to accounting decisions. Not surprisingly, many have ended up screening for stocks that trade at low multiples of revenues. But how well have revenue multiples worked at picking undervalued stocks? In this section, we begin by looking at that evidence and then consider some of the limitations of this strategy.
Empirical Evidence on Price-to-Sales Ratios There is far less empirical evidence, either for or against, on revenue multiples than there is on priceearnings or price-to-book value ratios. In one of the few direct tests of

278 |
INVESTMENT PHILOSOPHIES |
the price-sales ratio, Senchack and Martin compared the performance of low price-sales ratio portfolios with low price-earnings ratio portfolios, and concluded that the low price-sales ratio portfolio outperformed the market but not the low price-earnings ratio portfolio.14 They also found that the low price-earnings ratio strategy earned more consistent returns than a low price-sales ratio strategy, and that a low price-sales ratio strategy was more biased toward picking smaller firms. In 1988, Jacobs and Levy tested the value of low price-sales ratios (standardized by the price-sales ratio of the industries in which the firms operated) as part of a general effort to disentangle the forces influencing equity returns. They concluded that stocks with low price-sales ratios, by themselves, yielded an excess return of about 2 percent a year between 1978 and 1986. Even when other factors were thrown into the analysis, the price-sales ratios remained a significant factor in explaining excess returns (together with price-earnings ratio and size).15
What Can Go Wrong? While firms with low price-to-sales ratios may deliver excess returns over long periods, it should be noted, as with low price-to-book and price-earnings ratios, that there are firms that trade at low price-to-sales ratios that deserve to trade at those values. In addition to risk being the culprit again (higher-risk companies should have lower price-to-sales ratios) there are two other possible explanations.
1.High leverage. One of the problems with using price-to-sales ratios is that you are dividing the market value of equity by the revenues of the firm. When a firm has borrowed substantial amounts, it is entirely possible that its market value will trade at a low multiple of revenues. If you pick stocks with low price-to-sales ratios, you may very well end up with a portfolio of the most highly levered firms in each sector.
2.Low margins. Firms that operate in businesses with little pricing power and poor profit margins will trade at low multiples of revenues. The reason is intuitive. Your value ultimately comes not from your capacity to generate revenues but from the earnings that you have on those revenues.
14A. J. Senchack Jr. and J. D. Martin, “The Relative Performance of the PSR and PER Investment Strategies,” Financial Analysts Journal 43 (1987): 46–56.
15B. I. Jacobs and K. N. Levy, “Disentangling Equity Return Irregularities: New Insights and Investment Opportunities,” Financial Analysts Journal 44 (1988): 18– 44; B. I. Jacobs and K. N. Levy, “On the Value of ‘Value,’” Financial Analysts Journal 44 (1988): 47–62.

Graham’s Disciples: Value Investing |
279 |
The simplest way to deal with the first problem is to redefine the revenue multiple. If you use enterprise value (which adds debt to the numerator and subtracts out cash) instead of market value of equity in the numerator, you will remove the bias toward highly levered firms.
The significance of profit margins in explaining price-to-sales ratios suggests that screening on the basis of both price-sales ratios and profit margins should be more successful at identifying undervalued securities. You want to buy stocks that trade at low revenue multiples while earnings sizeable profit margins.
D i v i d e n d Y i e l d s While P/E ratios, price-to-book ratios, and price-to-sales ratios might be the most widely used value screens, there are some investors who view the dividend yield as the only secure measure of returns. Earnings, they argue, are not only illusory but are also out of reach for most investors in stocks since a significant portion may get reinvested. Following up on this logic, stocks with high dividend yields should be better investments than stocks with low dividend yields.
Does this approach yield results? Between 1952 and 2010, for instance, stocks with high dividend yields earned higher annual returns than stocks with low dividend yields, but the relationship is neither as strong nor as consistent as the results obtained from the P/E ratio or the PBV ratio screens. Figure 8.4 summarizes returns earned by dividend yield class from 1952 to 2010, broken down by subperiods.
The results are mixed, with high dividend yield stocks generating higher returns than low dividend yield stocks only between 2001 and 2010. In each of the other subperiods, the high dividend yield portfolio either underperforms or matches the returns on non–dividend payers and low dividend yield stocks.
N U M B E R W A T C H
Dividend yields by sector: Take a look at the average dividend yields, by sector, for companies in the United States.
Notwithstanding this evidence, there are some conservative investors who continue to believe that buying high-dividend stocks is a low-risk, high-return strategy. An extreme version of this portfolio is the strategy of investing in the “Dogs of the Dow,” the 10 stocks with the highest dividend yields in the Dow Jones Industrial Average. Proponents of this strategy claim