

aswath_damodaran-investment_philosophies_2012
.pdf300 |
INVESTMENT PHILOSOPHIES |
decision making in its research and computer divisions. In 1995, AT&T spun off both divisions: the research division (Bell Labs) was renamed Lucent Technologies, and the computer division reverted back to its original name of NCR.
Why would a firm use a split-up instead of spin-off or split-off? By giving existing stockholders an option to exchange their parent company stock for stock in the split-up unit, the firm may get a higher value for the assets of the unit. This is so because those stockholders who value the unit the most will be most likely to exchange their stock. The approach makes sense when there is wide disagreement among stockholders on how much the unit is worth.
Two issues have been examined by researchers who have looked at spin-offs. The first relates to the stock price reaction to the announcement of spin-offs. In general, these studies find that the parent company’s stock price increases on the announcement of a spin-off. A study by Schipper and Smith examined 93 firms that announced spin offs between 1963 and 1981 and reported an average excess return of 2.84 percent in the two days surrounding the announcement.28 Further, there is evidence that the excess returns increase with the magnitude of the spun off entity. Schipper and Smith also find evidence that the excess returns are greater for firms in which the spin-off is motivated by tax and regulatory concerns.
The second set of studies look at the performance of both the spun-off units and the parent companies after the spin-offs. These studies, which are extensively documented in Miles and Woolridge, can be summarized as follows:
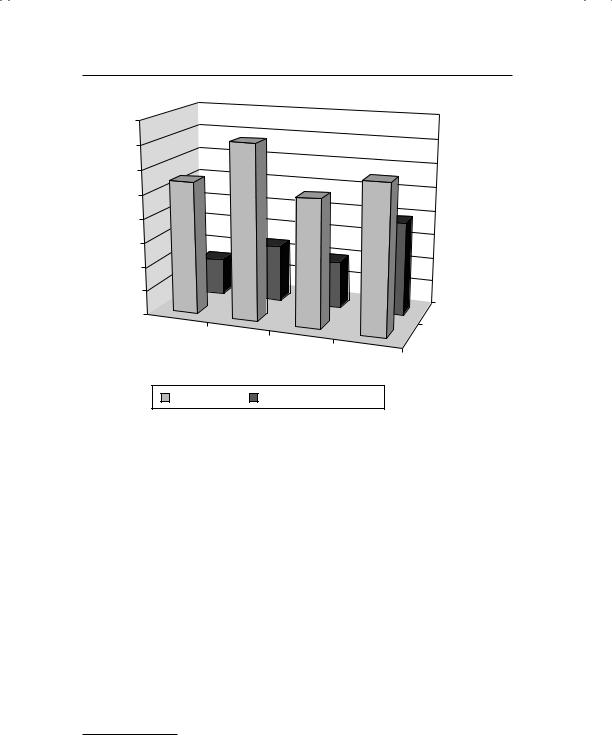
Cusatis, Miles, and Woolridge report that both the spun-off units and the parent companies report positive excess returns in the three years after the announcement of the spin-offs. Figure 8.9 reports the total returns and the returns adjusted for overall industry returns in the three years after the spin-off.29
Both groups are much more likely to be acquired, and the acquisition premiums explain the overall positive excess returns.
28K. Schipper and A. Smith, “Effects of Recontracting on Shareholder Wealth: The Case of Voluntary Spin-Offs,” Journal of Financial Economics 12 (1983): 437–468; see also G. L. Hite and J. E. Owers, “Security Price Reactions around Corporate Spin-Off Announcements,” Journal of Financial Economics 12 (1983): 409–436.
29P. J. Cusatis, J. A. Miles, and J. R. Woolridge, “Restructuring Through Spin Offs: The Stock Market Evidence,” Journal of Financial Economics 33 (1993): 293–311.

Graham’s Disciples: Value Investing |
301 |
Return
Percentage
80.00%
70.00%
60.00%
50.00%
40.00%
30.00%
20.00%
10.00% |
Parent Company |
0.00%
Spun-Off Units
Total Return
Industry-Adjusted
Return
 Spun-Off Units
  Parent Company
F I G U R E 8 . 9 Returns at Spin-Offs and Parent Company
Source: P. J. Cusatis, J. A. Miles, and J. R. Woolridge, “Restructuring Through Spin Offs: The Stock Market Evidence,” Journal of Financial Economics 33 (1993): 293–311.
There is a significant improvement in operating performance at the spun-off units in the three years after the spin-off. Figure 8.10 reports on the change in revenues, operating income, total assets, and capital expenditures at the spun-off units in the three years after the spin-off, before and after adjusting for the performance of the sector.
Note that the spun-off units grow faster than their peers in terms of revenues and operating income; they also reinvest more in capital expenditures than other firms in the industry.
C a p i t a l S t r u c t u r e / F i n a n c i n g C h o i c e s In corporate finance, there has long been a debate about whether firms can become more valuable as a result of changing the mix of debt and equity that they use to fund their businesses. There is one school of thought, attributed to Miller and Modigliani, that argues that value is unaffected by financial leverage, but only in a world
302 |
INVESTMENT PHILOSOPHIES |
||
Off |
80.00% |
|
|
|
|
|
|
- |
|
|
|
Spin |
|
70.00% |
|
after |
|
60.00% |
|
Years |
|
|
|
|
50.00% |
|
|
|
|
|
|
3 |
|
40.00% |
|
in |
|
|
|
|
|
|
|
Change |
|
30.00% |
|
|
|
|
|
Percentage |
20.00% |
|
|
10.00% |
Industry-Adjusted |
||
|
|
|
|
|
|
0.00% |
Growth |
|
|
Sales |
|
|
|
Total Growth |
|
|
|
Operating |
|
|
|
Income |
Total Assets |
|
|
|
Capital |
|
|
|
Expenditures |
|
|
Total Growth |
Industry-Adjusted Growth |
F I G U R E 8 . 1 0 Operating Performance of Spun-Off Units
Source: J. Miles and J. R. Woolridge, Spin-Offs & Equity Carve-Outs (Financial Executives Research Foundation, 1999).
without taxes and default risk.30 Another school of thought argues that in the presence of taxes and default risk, there is an optimal amount of debt that a firm can carry, and value is maximized at that point. Finally, there is a school of thought that argues that firms should not use debt since it is risky, and less debt is always better than more debt.
Capital Structure and Value The trade-off on using debt and the consequences for value is a straightforward one. Interest expenses are tax deductible and cash flows to equity are not, making debt more attractive, relative to equity, as the marginal tax rate rises. Debt can also operate as a disciplinary mechanism on managers in mature firms; managers are less likely to take bad investments if they have to make interest expenses each period. On the other side of the ledger, debt has two disadvantages. The first is an expected bankruptcy cost, since as debt increases, so does the probability of bankruptcy. But what is the cost of bankruptcy? One is the direct
30F. Modigliani and M. Miller, “The Cost of Capital, Corporation Finance and the Theory of Investment,” American Economic Review 48 (1958): 261–297.

Graham’s Disciples: Value Investing |
303 |
cost of going bankrupt, such as legal fees and court costs, which can eat up a significant portion of the value of a bankrupt firm. The more devastating cost is the effect of being perceived as being in financial trouble: customers may stop buying your products, suppliers may demand cash for goods, and services and employees may leave, creating a downward spiral for the firm that can destroy it. The second disadvantage is an agency cost, arising from different and competing interests of equity investors and lenders in a firm. Equity investors see more upside from risky investments than lenders do. As lenders become aware of this potential, they protect themselves by either writing covenants into loan agreements or charging higher interest rates. Putting this trade-off into practice requires us to try to quantify both the costs and benefits of debt.
N U M B E R W A T C H
Financial leverage by sector: Take a look at the average debt ratios and costs of capital, in market value terms, by sector.
In the cost of capital approach, the optimal financing mix is the one that minimizes a company’s cost of capital. Replacing equity with debt has the positive effect of replacing a more expensive mode of funding (equity) with a less expensive one (debt), but in the process the increased risk in both debt and equity will push up the costs of both components. The cost of capital approach relies on sustainable cash flow to determine the optimal debt ratio. The more stable and predictable a company’s cash flow and the greater the magnitude of these cash flows—as a percentage of enterprise value—the higher the company’s optimal debt ratio can be. Furthermore, the most significant benefit of debt is the tax benefit. Higher tax rates should lead to higher debt ratios.
Bradley, Jarrell, and Kim analyzed whether differences in debt ratios can be explained by some of the trade-off variables (taxes, bankruptcy costs) listed above.31 They noted that the debt ratio was lower for firms with more volatile operating income. Since these firms are also likely to face much higher likelihood of bankruptcy, this finding is consistent with the proposition that firms with high bankruptcy costs borrow less. They also looked at firms with high advertising and R&D expenses; lenders to these
31M. Bradley, G. A. Jarrell, and E. H. Kim, “On the Existence of an Optimal Capital Structure: Theory and Evidence,” Journal of Finance 39 (1984): 857–878.

304 |
INVESTMENT PHILOSOPHIES |
firms are likely to be much more concerned about recouping their debt if the firm gets into trouble, because the assets of these firms are intangible (brand names or patents) and difficult to liquidate. These firms, consistent with the theory, have much lower debt ratios. They also find that there is a significant number of firms whose debt ratios are much lower and much higher than predicted by the cross-sectional relationship.
A simple test of whether financing mix affects value is to look at the market reactions to firms that change their financing mixes, either increasing their debt ratios or lowering them. The studies that have looked at this question are in agreement that stock prices do change in response to financing mix changes, and that they tend to increase around leverage-increasing actions and decrease on the announcement of leverage-decreasing actions. Taken in sum, this would suggest that markets view more firms as underleveraged than overleveraged and that increasing debt is viewed as adding to value.
Capital Structure: Value-Enhancement Strategies Assume that you are a firm that has chosen the wrong mix of debt and equity in funding your assets. What are the ways in which you can (or an activist can try to make you) fix this problem? There is a continuum from small actions that nudge the debt ratio over a period of time toward the right mix to decisive ones where the change is large and occurs abruptly.
Marginal recapitalization. Even if a firm is reluctant to revisit its funding of existing investments, it can change the way it finances new investments. Thus, a firm that is underleveraged (with an actual debt ratio of 10 percent and an optimal ratio of 40 percent) can fund its new investments with a debt ratio of 40 percent or even higher. Similarly, an overleveraged firm can fund its new projects predominantly or entirely with equity from retained earnings or new equity issues, and see its debt ratio decline. Over time, the debt ratio for the firm will drift toward the optimal ratio though the rate of drift will depend on how much the firm is investing in new projects. Unfortunately, for larger, mature firms, the rate of change will be glacial, since new investments will tend to be small relative to existing investments.
Total recapitalization. In a recapitalization, a firm changes its financial mix of debt and equity without substantially altering its investments or asset holdings. If you are underleveraged, you can recapitalize in many ways. For instance, you can increase your debt ratio by borrowing money and paying a dividend or by buying back stock. Alternatively, you can swap debt for equity, where equity investors in your firm are offered equivalent amounts (in market value terms) in debt. If you want

Graham’s Disciples: Value Investing |
305 |
to reduce your debt ratio, you would reverse these actions, raising equity and reducing debt. The boom in debt for equity recapitalization occurred in the late 1980s. A study that looked at these recapitalizations came to two conclusions. The first was that almost every one of them was triggered by the threat of a hostile takeover. In other words, it is external pressure that forces managers to increase financial leverage. The second was that the average stock price reaction to recapitalizations is very positive. On average, in the sample of 45 recapitalizations studied, the stock price increased by 21.9 percent. This finding is not restricted to just stock buybacks. A study of 52 offers to exchange debt for equity found that stock prices increased by 14 percent.
If you are overleveraged, your choices will parallel the underleveraged firm’s actions. You can try to raise new equity (by issuing new stock or equity options) and pay down your debt. You can cut back or eliminate dividends, assuming that you are still paying them. You can also try to convince your lenders to swap their debt holding for equity investments in the company. The problem is that recapitalization is likely to be more difficult for a firm with too much debt than one with too little. In an overleveraged firm, investors are less willing to buy your equity offerings, it is unlikely that you are paying substantial dividends, and lenders remain wary of holding equity in your firm.
Leveraged acquisitions. If a firm is underleveraged and the existing management is too conservative and stubborn to change, there is an alternative. An acquirer can borrow money, implicitly using the target firm’s debt capacity, and buy out the firm. This is, of course, the phenomenon of the leveraged buyout, where a group of investors raises debt against the assets of a publicly traded firm, preferably one with stable earnings and marketable assets, and uses the debt to acquire the outstanding shares in the firm. If they succeed in their endeavor, the firm becomes a private company, and the debt is partly or substantially paid down with the firm’s cash flows or from asset sales over time. Once the firm has been nursed back to health and efficiency, it is taken public again, reaping (at least if all goes according to plan) substantial payoffs for the equity investors in the deal. Studies of leveraged acquisitions suggest that they do, on average, deliver significant returns to their investors. However, some of the leveraged buyouts done toward the end of the 1980s and just before the banking crisis of 2008 failed spectacularly, highlighting again that leverage is a two-edged sword, elevating returns in good times and reducing them in bad times.
Is there a similar nuclear option available against overleveraged firms where managers are unable or unwilling to reduce debt? While there is no

306 |
INVESTMENT PHILOSOPHIES |
explicit analogue to the leveraged buyout, there is a far more conventional route that can be followed, in which the operating assets of an overleveraged firm (which can still have significant value) can be acquired by an investor or a healthy company and the troubled firm is put into liquidation.
D i v i d e n d P o l i c y / C a s h B a l a n c e s In November 2011, Apple reported a cash balance in excess of $80 billion, the most eye-catching example of a more general cash buildup at U.S. companies during the prior years. With the cash buildup has come the question of whether this cash accumulation helps or hurts investors in the firms in question, and if it hurts them, whether the cash should be returned to stockholders in the form of higher dividends or stock buybacks. In this section, we provide a nuanced answer, where the cash buildup can help investors in some companies, leave investors in other companies unaffected, and hurt investors in some companies. It is the last group that should be targeted for higher dividends and/or buybacks by investors.
N U M B E R W A T C H
Cash holdings by sector: See the cash balances as a percentage of revenues and value, by sector, for U.S. companies.
Cash and Value To some investors/analysts, the question of whether cash hurts or helps them seems like an easy one to answer. After all, cash is usually invested in liquid and riskless or near-riskless investments, earning a low rate of return. Since that return is generally much lower than the returns that the company makes on its operating investments or its cost of capital, cash looks like a bad investment. That misses a key point about investment assessment, which is that investment returns should be compared against a hurdle rate that reflects the risk of the investment. Since cash is a riskless, liquid investment, the cost of capital for cash is the risk-free rate, and cash invested in Treasury bills or commercial paper is thus value neutral. So cash, by itself, is neither value creating nor value destroying.
So, how does cash affect value? Put differently, how much cash is too much cash? To answer these questions, you have to start off with a clear sense of how or why cash balances affect equity investors in a company. Rather than worry about the low returns that cash generates, investors

Graham’s Disciples: Value Investing |
307 |
should redirect their attention to what the company may do with the cash. While cash invested in Treasury bills, earning a low rate of return, does not hurt value, that same cash invested in projects earning 6 percent, if the cost of capital for those projects is 9 percent, will destroy value. To make a judgment on whether to attach a discount to cash, investors should look at a company’s track record, discounting cash balances in the hands of companies that have a history of poor investments and bad acquisitions. They should not discount cash balances in the hands of companies where managers are selective in their investments and have earned high returns (on both projects and for their investors).
While it may seem outlandish to argue that the market values cash balances differently in the hands of different companies, there is empirical evidence that backs this proposition. Pinkowitz and Williamson tried to estimate the value that markets were attaching to cash by regressing the market values of firms against fundamental variables that should determine value (including growth, leverage, and risk) and adding cash as an independent variable.32 They concluded that the market values a dollar in cash at about $1.03, across all companies, with a standard error of $0.093. Consistent with the motivations for holding cash, they found that cash is valued more highly ( $1.20 for $1 in cash) in the hands of high-growth companies with more uncertainty about future investment needs than in the hands of larger, more mature companies that earn less than their cost of capital (where a dollar in cash is valued at about 70 cents).
Cash: Value-Enhancement Strategies If you are a company with a poor track record of taking bad investments, trust in management will be a scarce commodity and your cash holdings will be discounted by the market. The path to value enhancement, whether you choose to take it or activist investors push you along the path, is to return the cash to the stockholders, either by paying higher dividends or by buying back stock.
Dividends. The conventional path to returning cash to stockholders is to pay it out as dividends. For firms that have never paid dividends before, this will mean initiating dividends for the first time; for firms that have been paying dividends, this will translate into increasing dividends. If the cash balance to be returned is very large, it may take the form of a special dividend.
32L. Pinkowitz and R. Williamson, “What Is a Dollar Worth? The Market Value of Cross Holdings” (working paper, Georgetown University, 2002).
308 |
INVESTMENT PHILOSOPHIES |
The arguments for and against dividends are well rehearsed and have been heard over time. On the plus side, dividends fit into the value investor’s vision of safe cash flows, predictable and stable, and are a positive signal since only firms that feel confident about their future will initiate or increase regular dividends. On the minus side, for much of the past century, investors in the United States have been penalized by the tax code for dividends, with dividends being taxed at much higher rates than capital gains. In addition, taxes on dividends are unavoidable in the sense that investors holding the stock have to receive the dividend and pay taxes on them, even if they have no need for the cash.
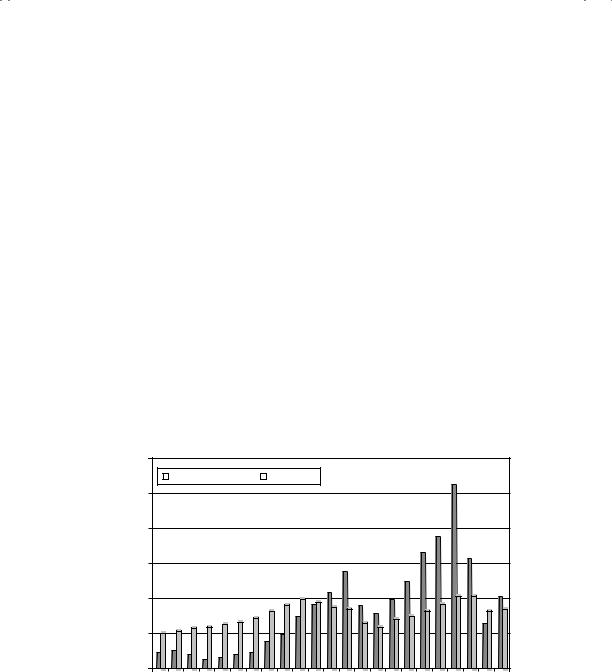
Stock buybacks. The alternative to using cash to pay dividends is to use it to buy back stock. In the United States, at least, the shift away from dividends to stock buybacks has been dramatic over the past two decades, as evidenced in Figure 8.11.
Note that aggregate dividends amounted to $100 billion in 1988 and aggregate stock buybacks were $50 billion in that year. During the 1990s, buybacks increased dramatically, and in 1999, cash returned in buybacks exceeded cash paid out in dividends in the aggregate. The trend continued uninterrupted through 2008, with 2007 representing a high-water mark for
$600,000
|
Stock Buybacks |
|
Dividends |
|
|
||
|
|
|
$500,000 |
|
|
|
|
and Buybacks |
$400,000 |
|
|
|
|
$300,000 |
|
|
|
|
|
$ Dividends |
$200,000 |
|
|
|
|
$100,000 |
|
|
|
|
|
|
|
|
|
|
|
|
$0.00 |
|
|
|
|
|
|
2 |
6 |
||
|
1988198919901991199 |
199319941995199 |
19971998199920002001200220032004200520062007200820092010 |
||
|
|
|
|
|
Year |
F I G U R E 8 . 1 1 |
Stock Buybacks and Dividends: Aggregate for U.S. Firms, 1988 |
||||
to 2010 |
|
|
|
|
|
Source: Standard & Poor’s. |
|
|
|
||

Graham’s Disciples: Value Investing |
309 |
buybacks. The market collapse and economic fears that followed induced companies to hold back on buybacks in 2009, but it was clearly just a pause, not a stop to the trend, as the return to buybacks in 2010 indicates.
So, what has caused this movement away from dividends in the past two decades? Dividends have been taxed at much higher rates than capital gains going back to the early decades of the past century. In fact, in 1979, the highest marginal tax rate on dividends was 70 percent, while it was only 28 percent on capital gains. The changes in the tax laws in the past three decades have reduced the tax disadvantage of dividends—in fact, capital gains and dividends have both been taxed at 15 percent from 2003 to 2012—and cannot therefore be a rationale for the surge in buybacks. It also cannot be attributed to companies thinking that their stock prices were too low, since these buyback surges occurred during the bull markets of the 1990s and 2004 to 2007, not during down markets. There are four possible explanations.
1.Management compensation. The shift toward using options in management compensation at many firms has altered managerial incentives on whether to pay dividends or buy back stock. When you buy back stock, your stock price generally increases, partly because there are fewer shares outstanding after the buyback. When you pay a dividend, your stock will drop on the ex-dividend day. As an investor, you may not care because you get a dividend to compensate for the price drop. As a manager with options, you do care, since your option value will decrease with the stock price.
2.Uncertainty about earnings. The second explanation is that dividends are sticky: once you initiate or increase a dividend, you are expected to keep paying that dividend. Buybacks are flexible: companies can buy back stock in one year without creating expectations about future years. Companies that are uncertain about future earnings will therefore be more likely to buy back stock than pay dividends. Deregulation (of telecommunications, airlines, and a host of other businesses) in conjunction with globalization (and the concurrent loss of secure local markets) has resulted in less predictability in earnings across the board.
3.Changing investor profiles. The expansion of hedge funds and private equity investors has changed investor profiles in the stock market. These investors may be focused on price appreciation (rather than dividends) and may prefer buybacks to dividends.
4.The dilution delusion. A stock buyback reduces the number of shares outstanding and generally increases earnings per share. Applying the current P/E ratio to the higher earnings per share should result in a stock price. If this logic held, stock buybacks would be magic bullets