

aswath_damodaran-investment_philosophies_2012
.pdf250 |
INVESTMENT PHILOSOPHIES |
absolute terms, where only stocks that have gone up over the period would be considered good investments. Alternatively, the relative strength can be compared across stocks, and you would invest in stocks that show the highest relative strength (i.e., have gone up the most relative to other stocks).
F o l l o w i n g t h e I n f o r m e d I n v e s t o r s : L e a d i n g I n d i c a t o r s This approach is the flip side of the contrarian approach. Instead of assuming that investors, on average, are likely to be wrong, you assume that they are right. To make this assumption more palatable, you do not look at all investors but only at the investors who presumably know more than the rest of the market.
The Basis for Following Smart Investors and Implications Are some investors smarter and better informed than others? Undoubtedly. Do they make higher returns as a consequence? Not necessarily. As John Maynard Keynes was fond of pointing out, a stock market is a beauty contest in which the prize goes to the person who best gauges who the other judges in the contest will pick as the winner. In investment terminology, the high returns often go to the investor who can best pick the stocks that other investors will buy.
There are two keys to making a strategy of following other investors work. The first is identifying the smart investors, who may not always be the largest or best known. It stands to reason that investors who have access to the best information are most likely to beat the market and would be the ones you should follow. The second is to find out when and what these smart investors are trading in a timely fashion, so you can imitate them. This is often difficult to do. Even though insiders and institutions have to file with the Securities and Exchange Commission (SEC), providing details about their trades, the filings are made several weeks after the trades occur.
Technical Indicators for Followers There are several technical indicators that attempt to pinpoint what better-informed investors are buying and selling. Here, we consider two. The first looks at short sales made by market specialists. Since these specialists are close to the action and have access to information that the rest of us cannot see (such as the order book and trading on the floor), it can be argued that they should have an inside track on overpriced and underpriced stocks. Thus, a surge in specialist short sales in a stock would be a precursor for bad news on the stock and a big price drop. Some analysts look at all short sales made on a stock, arguing that only larger, more sophisticated investors can short stock in the first place. A study by Senchack and Starks provides some support for this indicator by

Smoke and Mirrors? Price Patterns, Volume Charts, and Technical Analysis |
251 |
noting that stock returns tend to me more negative for stocks in which the short interest (short sales as a percent of the outstanding stock) is higher.37 In the past few years, the SEC has speeded up the process of recording transactions by insiders and has made this data more easily accessible to the public. You can therefore look up stocks where insider buying or selling has increased the most. In fact, the ratio of insider buying to selling is often tracked for stocks with the idea that insiders who are buying must have positive information about a stock whereas insiders who are selling are
likely to have negative information.
L o n g - T e r m C y c l e s : M y s t i c a l I n d i c a t o r s
The final set of technical indicators includes those that are based on longterm cycles in prices that exercise an inexorable hold on how prices move. Since these long-term cycles operate independently of fundamentals, it is very difficult to explain them without resorting to mysticism.
B a s i s f o r L o n g - T e r m C y c l e s a n d I m p l i c a t i o n s There are two ways in which you can defend the use of long-term cycles. One is to abandon any basis in rationality and argue that there are a number of phenomena in nature that cannot be explained with models.38 You can think of such investors as subscribers to the karmic theory of investing. In other words, everything that happens has already been predestined and there is nothing that we can do to stop it. This requires an almost religious belief that cycles will replicate themselves. The other defense is based on market behavior. You can argue that investors, even though they might be separated over time, behaved in very much the same way in the South Sea bubble as they did in the dot-com bubble. Consequently, long-term cycles reflect the pricing mistakes that investors make and remake over time. As a cautionary note, you should realize that if you look for patterns too intently in charts, you will find them, especially if you use visual techniques (rather than statistical ones).
T e c h n i c a l I n d i c a t o r s B a s e d o n C y c l e s There are numerous cycles that analysts see in stock prices, but we will consider only two in this section. In the first, the Dow Theory, the market is considered to have three movements, all going at the same time. The first is the narrow movement (daily fluctuations)
37A. J. Senchack Jr. and L. T. Starks, “Short-Sale Restrictions and Market Reaction to Short-Interest Announcements,” Journal of Financial and Quantitative Analysis
28, no. 2 (June 1993): 177–194.
38Scientists would undoubtedly disagree.
252 |
INVESTMENT PHILOSOPHIES |
Closing Price
Secondary
Movements
Upward |
Downward |
Upward |
Primary Trend |
Primary Trend |
Primary Trend |
|
Time |
|
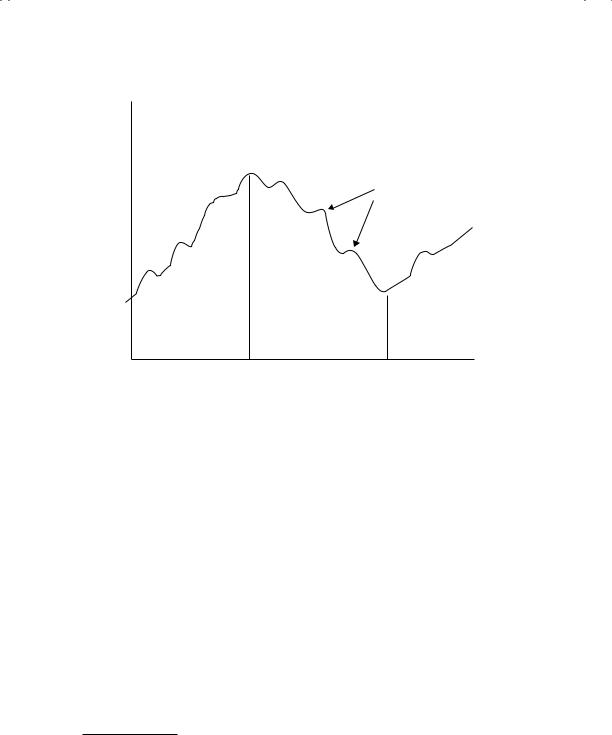
F I G U R E 7 . 1 8 The Dow Theory
from day to day. The second is the short swing (secondary movements) running from two weeks to a few months; and the third is the main movement (primary trends) covering several years in duration. Proponents of the theory claim that you can tell where you are in the primary cycle by charting the industrial and transportation components of the Dow index and looking for confirmation (i.e., both indexes moving in the same direction). In Figure 7.18, the latter two movements of the Dow Theory are presented.
In 1922, William Hamilton wrote a book titled The Stock Market Barometer about the Dow Theory, in which he presented evidence on the measure’s efficacy at predicting market movements. A study that appraised Hamilton’s predictions in the Wall Street Journal between 1901 and 1929 concluded that he had far too many correct calls than could be attributed to chance and that you would have earned excess returns followings his advice.39
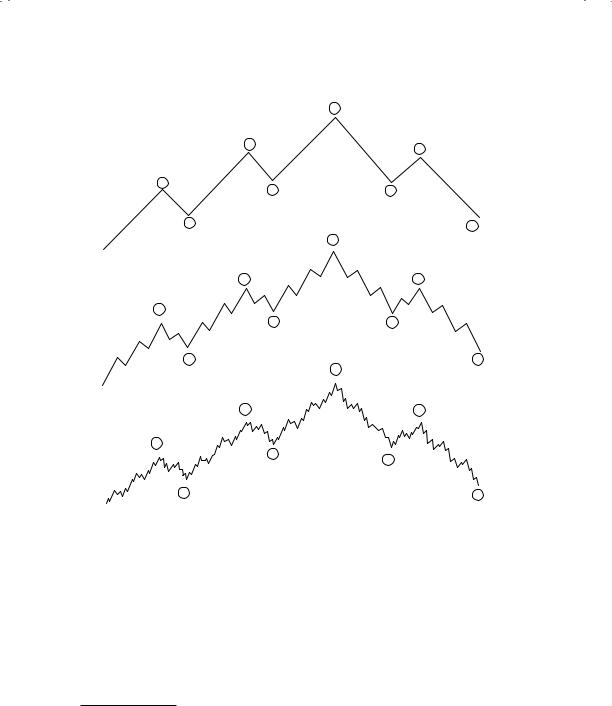
While the Dow Theory has been around for almost a century, the Elliott Wave acquired a wide following in the 1980s. R. N. Elliott’s theory was that the market moves in waves of various sizes, from those encompassing only individual trades to those lasting centuries, perhaps longer. In the classic
39S. J. Brown, W. N. Goetzmann, and A. Kumar, “The Dow Theory: William Peter Hamilton’s Track Record Reconsidered” (SSRN Working Paper 58690, 1998).
Smoke and Mirrors? Price Patterns, Volume Charts, and Technical Analysis |
253 |
|
|
|
|
Bull Market |
|
|
|
|
|
5 |
|
|
|
|
|
Waves of |
|
3 |
|
|
|
|
|
|
|
|
Major Degree |
|
|
|
|
|
|
||
|
|
|
|
1 |
|
|
|
4 |
|
|
|
|
|
|
|
|
|
|
|
|
|
|
|
|
|
|
|
|
2 |
|
|
|
|
|
|
|
|
|
|
|
|
|
|
|
|
|
5 |
|
|
|
|
|
|
|
|
|
|
3 |
5 |
|
|
|
|
Intermediate |
|
|
|
|
2 |
||
|
|
|
|
|
3 5 |
|
1 |
|
|
||
|
|
|
|
Degree |
|
B |
4 |
1 |
|||
|
|
|
|
|
3 |
|
|
|
|
2 |
3 |
|
|
|
|
1 |
1 |
|
A |
4 C |
|||
|
|
|
|
|
|
|
|||||
|
|
3 |
|
5 B |
4 |
|
|
|
|||
|
|
|
|
2 |
|
|
|
|
|
|
|
|
1 |
|
|
|
|
|
|
|
|
|
|
|
|
4 |
A |
C |
|
|
|
|
|
|
|
|
|
|
|
|
|
|
|
|
|||
|
|
|
|
2 |
|
|
|
|
|
5 |
|
|
|
2 |
|
|
|
|
|
|
|
|
|
|
|
|
|
|
|
|
|
|
|
5 |
|
|
|
|
|
|
|
|
|
|
|
|
|
|
|
|
|
|
|
|
|
|
|
3 |
2 |
|
|
|
|
Minor Degree |
|
3 |
B |
1 |
4 |
1 |
|
|
|
|
|
|
5 |
|
|||||
|
|
|
|
1 |
3 |
|
A |
|
|
2 |
3 |
|
|
|
|
|
|
|
C |
||||
|
|
|
|
1 |
|
|
|
|
|||
|
|
|
|
|
|
|
|
|
|||
|
|
3 |
|
5 B |
4 |
|
4 |
|
|
|
|
|
|
|
|
2 |
|
|
|
|
|
|
|
1 |
|
|
|
A |
|
|
|
|
|
|
|
|
4 |
|
C |
|
|
|
|
|
|
||
|
|
|
|
|
|
|
|
|
|||
|
|
|
|
2 |
|
|
|
|
|
|
|
|
|
2 |
|
|
|
|
|
|
|
|
|
F I G U R E 7 . 1 9 The Elliott Wave
Bear Market
B
A
C
4 |
BC |
|
A |
|
2 |
|
|
|
5 B |
1 |
4 |
A |
|
|
|
|
3 |
5 C
4 A |
BC |
|
|
2 |
|
|
|
|
5 B |
1 |
4 |
A |
|
|
|
|
3 |
5 C
Elliott wave, a cycle lasts 200 years and has eight wave segments—five up and three down—with smaller cycles within each of these waves. By classifying these waves and counting the various classifications (see Figure 7.19), he argued that it was possible to determine the relative positions of the market at all times.
In the aftermath of the 1987 crash, there were several newsletters based on the Elliott Wave.40 Most of them faded in the years after, as the predictive power of the model was found to be wanting.
40A. J. Frost and R. R. Prechter Jr., The Elliott Wave Principle: Key to Market Behavior (Gainesville, GA: New Classics Library, 1998). For a critical look, see F. Gehm, “Who Is R. N. Elliott and Why Is He Making Waves?” Financial Analysts Journal (January–February 1983): 51–58.

254 |
INVESTMENT PHILOSOPHIES |
Other cycles include the Kitchen cycle (inventories, three to five years); the Juglar cycle (fixed investment patterns, 7 to 11 years); and the Kuznets cycle (building patterns, 15 to 25 years). A more controversial theory is the Kondratyev cycle (also called the long economic cycle, about 54 years) in three stages of upswing, crisis, and depression. The Babson chart of business barometers uses statistics and charts to model a 20-year cycle in four stages: overexpansion, decline, depression, and improvement.
D e t e r m i n a n t s o f S u c c e s s a t C h a r t i n g a n d
T e c h n i c a l A n a l y s i s
Can you succeed with technical indicators and charts? The answer that has been long given by academics and fundamentals is no, but that answer may need to be reassessed in light of the research on price patterns (especially price momentum) and trading volume in recent years. There seems to be enough evidence now for us to conclude that it is foolhardy to ignore recent price movements and changes in trading volume when investing in a stock. So what are the essential ingredients for success with technical analysis? These seem to be a few:
If you decide to use a charting pattern or technical indicator, you need to be aware of the investor behavior that gives rise to its success. This is not just to satisfy your curiosity but also to ensure that you can modify or abandon the indicator if the underlying behavior changes.
It is important that you back-test your indicator to ensure that it delivers the returns that are promised. In running these tests, you should pay particular attention to the volatility in performance over time and how sensitive the returns are to holding periods. There are some strategies that work only in bull markets, for example, and only for specific holding periods—say one month or less.
The excess returns on many of the strategies that we described in this chapter seem to depend on timely trading. In other words, to succeed at some of these strategies, you may need to monitor prices continuously, looking for the patterns that would trigger trading.
Building on the theme of time horizons, success at charting can be very sensitive to how long you hold an investment. Recall, for instance, that momentum indicators seem to work for only a few months and that reversals seem to occur beyond that time period. Finding the optimal holding period and staying disciplined seem to be key to earning the returns that we sometimes see on paper.
The strategies that come from technical indicators are generally shortterm strategies that require frequent and timely trading. With some

Smoke and Mirrors? Price Patterns, Volume Charts, and Technical Analysis |
255 |
strategies, you may need to trade several times during the course of a day or a week. Not surprisingly, these strategies also generate large trading costs that can very quickly eat into any excess returns you may have.
In summary, investors who can track markets continuously and trade cheaply may be able to take advantage of price patterns and volume indicators to earn excess returns, if they can pinpoint the right indicators and stay disciplined. As price and volume data become increasingly available to all investors, though, it is likely that these strategies will be more useful as secondary strategies, used to augment returns on a primary strategy. For instance, growth investors who buy stocks with rising earnings may also consider adding price momentum to the mix of variables that they look at before making their investment choices. Investors who cannot or do not want to track markets continuously are unlikely to earn enough returns on these strategies to cover transaction costs.
C O N C L U S I O N
Investors have always claimed to find patterns in charts that help them make better investment decisions. Skeptics have viewed these claims as fiction and have argued that there is no basis to technical analysis. In recent years, evidence has steadily accumulated that there is information in past price movements and trading volume and that there may be a foundation for some of the claims made by chartists. In particular, stocks that have done well in the recent past seem to be more likely to do well in the near future (price momentum), and trading volume changes seem to lead price changes in some markets.
All technical indicators have their basis in quirks in human behavior. We categorize technical trading indicators based on the type of behavior that may lead to their success. Contrarian indicators such as mutual fund holdings or odd-lot ratios, where you track what investors are buying and selling with the intention of doing the opposite, are grounded in the belief that markets overreact. A number of technical indicators are built on the presumption that investors often change their views collectively, causing shifts in demand and prices, and that patterns in charts—support and resistance lines, price relative to a moving average—can predict these changes. With momentum indicators, such as relative strength and trend lines, you are assuming that markets often learn slowly and that it takes time for prices to adjust to true values. If you believe that there are some traders who trade ahead of the market because they have better analysis tools or

256 |
INVESTMENT PHILOSOPHIES |
information, your indicators will follow these traders (specialist short sales and insider buying/selling, for instance) with the objective of piggybacking on their trades. Finally, if you believe that there are long-term cycles in stock prices, your investment strategy may be driven by the cycle you subscribe to and where you believe you are in the cycle.
If you are a short-term investor with the discipline to stick with a tested indicator, low trading costs, and continuous access to information, you may be able to use technical indicators as the basis for your investment strategy. Even those who do not want to build their entire strategy around price patterns and trading volume may still find them useful to augment returns on their primary strategies.
E X E R C I S E S
Pick a few stocks that you are interested in following or investing in and follow through:
1.For these stocks, look at price charts of
a.daily prices, to see if there is price momentum in the stock and if so, in which direction.
b.monthly prices, to see if there is price momentum in the stock and if so, in which direction.
c.annual prices, to see if there is price momentum in the stock and if so, in which direction.
With each chart, draw a trend line and compute the relative strength value (Price today/Price in the past).
2.Look at trends in trading volume on your stocks, in the short term (daily, weekly) and the long term.
3.Find out the short interest in your stock and what experts (or at least analysts) think about it as an investment.
4.Find the percent of stock held by institutions and whether they were net buyers or sellers in the most recent periods.
Lessons for Investors
To be a successful technical analyst, you need to:
Understand human nature: Investors are human and display all of the foibles of human nature. Some of them tend to be overconfident and to overreact and move in herds. At the same time, others display too little confidence, learn too slowly, or are born contrarians. What happens in

Smoke and Mirrors? Price Patterns, Volume Charts, and Technical Analysis |
257 |
markets represents the tug and the pull between these groups. When you use an indicator, you need to understand the assumption about human behavior that underlies it.
Not mistake random price movements for price patterns: Even when prices move randomly, you can generate charts that look like they have patterns. Even bubbles and crashes, which are used by many analysts as evidence of irrationality, can exist in rational markets.
Have a time horizon that matches your indicator: Some indicators require time horizons of a few hours, others require a few weeks, and some may even stretch to a few months.
Be disciplined: If you decide to use a technical indicator to pick stocks, assuming you have back-tested the indicator, you will need to stay within your specified strategy.


CHAPTER 8
Graham’s Disciples:
Value Investing
Value investors are bargain hunters, and many investors describe themselves as such. But who is a value investor? In this chapter, we begin by addressing this question, and argue that value investors come in many forms. Some value investors use specific criteria to screen for what they categorize as undervalued stocks and invest in these stocks for the long term. Other value investors believe that bargains are best found in the aftermath of a sell-off, and that the best time to buy a stock is when it is down in price. Still others adopt a more activist approach, where they buy large stakes in companies that look undervalued and mismanaged and push for changes
that they believe will unleash this value.
Value investing is backed by academic research and also by anecdotal evidence—the successes of value investors like Benjamin Graham and Warren Buffett are legendary—but it is not for all investors. We will consider what investors need to bring to the table to succeed at value investing.
W H O I S A V A L U E I N V E S T O R ?
In 2011, Morningstar, a widely used source of mutual fund information, categorized 2,152 equity mutual funds, out of 8,277 domestic equity funds, as value funds. But how did it make this categorization? It did so based on a simple measure: any fund that invested in stocks with low price-to-book value ratios or low price-earnings (P/E) ratios and high dividend yields, relative to the market, was categorized as a value fund. This is a fairly conventional approach, but we believe that it is too narrow a definition of value investing and misses the essence of value investing.
259