

aswath_damodaran-investment_philosophies_2012
.pdf130 |
INVESTMENT PHILOSOPHIES |
3.The uncertainty about future information on the asset. The more uncertainty there is about the future, the greater the risk to the market maker from new information coming out, and thus the larger the bidask spread.
W h a t A r e t h e F a c t o r s T h a t D e t e r m i n e t h e B i d - A s k S p r e a d ? Given the three underlying variables that motivate the bid-ask spread, it should not be surprising that bid-ask spreads vary widely across assets and that much of the variation can be explained by systematic factors.
N U M B E R W A T C H
Sector liquidity: See the average trading volume and other measures of liquidity, by sector, for U.S. companies.
Liquidity and Ownership Structure The first and most critical factor determining the bid-ask spread is liquidity. Stocks that trade more heavily generally have lower bid-ask spreads than stocks that trade less frequently. Every study of bid-ask spreads finds high correlation between the magnitude of the bid-ask spread and some measure of liquidity—trading volume, turnover ratios, and so on.3 A study of NASDAQ stocks noted the same relationship between spreads and volume, but it also uncovered an interesting new variable: stocks where institutional activity increased significantly had the biggest increase in bid-ask spreads.4 While some of the differences can be attributed to the concurrent increase in volatility in these stocks (from institutional activity), it might also reflect the perception on the part of market makers that institutional investors tend to be informed investors with more or better information. Note, though, that institutional investors also increase liquidity, which should reduce the order-processing cost
3S. Tinic and R. West, “Competition and the Pricing of Dealer Service in the Over- the-Counter Market,” Journal of Financial and Quantitative Analysis 7 (1972): 1707–1727; H. Stoll, “The Pricing of Security Dealer Services: An Empirical Study of Nasdaq Stocks,” Journal of Finance 33 (1978): 1153–1172.
4M. Kothare and P. A. Laux, “Trading Costs and the Trading Systems for NASDAQ Stocks,” Financial Analysts Journal 51 (1995): 42–53.

Many a Slip: Trading, Execution, and Taxes |
131 |
component of the bid-ask spread, and in some cases the net effect can lead to a lower spread.5
Riskiness Bid-ask spreads tend to be higher on riskier assets than on safe assets, partly because the adverse selection problem is greater for more volatile stocks. Put simply, it is far more likely that there will be more informed traders, a greater information differential, and greater uncertainty about future information on these stocks. Thus, holding liquidity constant, you should expect to see larger bid-ask spreads not only on more risky stocks than on safe stocks, but also on more risky asset classes (such as equity) than on less risky ones (bonds).
Price Level A bid-ask spread of 10 cents is trivial on a stock priced at $100 but substantial on a stock priced at $2. Not surprisingly, the bid-ask spread stated as a percentage cost tends to be higher for lower-priced stocks. Going back to the variables that underlie the bid-ask spread, the fixed processing costs will also tend to increase (in percentage terms) as the price level on a stock drops. The price level is a factor in almost every asset market, but it tends to play a bigger role in creating differences in transaction costs in markets where prices vary widely across assets. Thus, it is less of an issue in corporate bond markets, where bonds tend to have similar par values ($1,000), than in the stock market, where the price per share varies among companies. Thus, you can have shares in Berkshire Hathaway, trading in six figures, and shares in penny stocks that trade literally for pennies.
Information Transparency and Corporate Governance Can firms have an effect on the bid-ask spreads on their stocks? There is some evidence that they can, by improving the quality of information that they disclose the financial markets, thus reducing the advantages that informed traders may have relative to the rest of the market. Heflin, Shaw, and Wild looked at 221 firms and examined the relationship between information disclosure quality (measured using disclosure quality scores assigned by the Corporate Information Committee of the Financial Analysts Federation) and the bid-ask spreads.6 They found that bid-ask spreads decrease as information quality increases. There is also some evidence that companies with stronger
5M. K. Dey and B. Radhakrishna, “Institutional Trading, Trading Volume and Spread” (SSRN Working Paper 256104, 2001).
6Heflin, F., K. Shaw, and J. Wild. 2005. “Disclosure quality and market liquidity: Impact of depth quotes and order sizes.” Contemporary Accounting Research 22 (4): 829–865.

132 |
INVESTMENT PHILOSOPHIES |
corporate governance structures tend to have smaller bid-ask spreads than companies with weaker corporate governance, perhaps because managers in the latter group hold back critical information from the public.
Market Microstructure Does the market in which a stock lists matter when it comes to how big the bid-ask spread should be? Studies indicate that bidask spreads have historically been much larger on the NASDAQ than on the New York Stock Exchange, even after controlling for differences in the variables mentioned earlier—trading volume and price level. In fact, the bid-ask spreads of stocks drop when they switch from the NASDAQ to the NYSE.7
A study by Christie and Schultz in 1994 provided one explanation for the phenomenon.8 They found that there were a disproportionately large number of 1/4 quotes and far too few 1/8 quotes.9 They argued that dealers on the NASDAQ were colluding to set quotes too high and that investors were therefore paying the price with larger bid-ask spreads. This triggered an investigation by the Securities and Exchange Commission (SEC), which concluded that dealers were indeed engaged in anticompetitive behavior. Eventually, the exchange settled the lawsuit for more than a billion dollars. An alternative explanation is that the higher spreads on the NASDAQ relative to the NYSE can be explained by structural differences across the markets. Consider, for example, how limit orders are handled on the two exchanges. The specialists on the floor of the New York Stock Exchange are required to reflect the limit prices in their bid-ask spread, if they are better than their own quotes, and this has the effect of reducing the bid-ask spread. On the NASDAQ, limit orders do not affect the bid-ask quotes and are executed only if prices move against the limit. You would expect larger bid-ask spreads as a consequence.10
7M. Barclay, “Bid-Ask Spreads and the Avoidance of Odd-Eighth Quotes on Nasdaq: An Examination of Exchange Listings,” Journal of Financial Economics 45 (1997): 35–60.
8W. Christie and P. Schultz, “Why Do Nasdaq Market Makers Avoid Odd-Eighth Quotes?” Journal of Finance 49 (1994): 1813–1840; W. Christie and P. Schultz, “The Initiation and Withdrawal of Odd-Eighth Quotes among Nasdaq Stocks: An Empirical Analysis,” Journal of Financial Economics 52 (1999): 409–442.
9If 1/8 and 1/4 quotes are equally likely to show up, roughly half of all quotes should be eighths (1/8, 3/8, 5/8, or 7/8) and half should be quarters (1/4, 1/2, or 3/4).
10K. Chung, B. Van Ness, and R. Van Ness, “Can the Treatment of Limit Orders
Reconcile the Differences in Trading Costs between NYSE and Nasdaq Issues?”
Journal of Financial and Quantitative Analysis 36 (2001): 267–286. While they find that the treatment of limit orders does narrow the bid-ask spread on the NYSE, they conclude that collusion among dealers still leads to wider spreads on the NASDAQ.

Many a Slip: Trading, Execution, and Taxes |
133 |
In 2000, the New York Stock Exchange abandoned its historical practice of quoting prices in fractions (1/8, 1/4, etc.) and shifted to decimal prices. Since you can get finer gradations of prices in decimals, it was hypothesized that this should lead to smaller bid-ask spreads. Studies since the shift indicate that there has been a reduction in spreads on the smaller, less liquid stocks but a much smaller impact on the more liquid listings.
H o w B i g I s t h e S p r e a d ? The answer varies, depending on what asset or stock you are trading, who you are as an investor, and when and how much you trade. In this section, we first look at variations in bid-ask spreads across stocks, and then examine differences across markets and finally at differences across time.
Variation across Stocks The average bid-ask spread for a stock traded on the New York Stock Exchange in 2004 was only 5 cents, which seems trivial especially when one considers the fact that the average price of a NYSE stock is between $20 and $30. This average, however, obscures the large differences in the cost as a percentage of the price across stocks, based on capitalization, stock price level, and trading volume, and these differences get magnified if we extend the analysis to look at over-the-counter stocks.
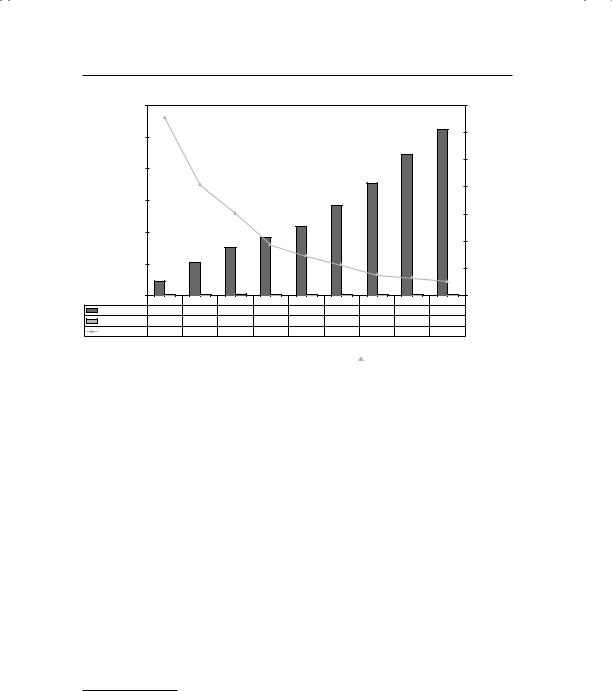
A study11 by Thomas Loeb in 1983, for instance, reported the spread as a percentage of the stock price for companies as a function of their market capitalization for small orders. These results are summarized in Figure 5.2.
While the dollar spread is not that different across market capitalization classes, the smallest companies also tend to have lower-priced stocks. Consequently, the spread is as high as 6.55 percent of the price for small-capitalization stocks and as low as 0.52 percent of the price for large-capitalization companies.
In fact, more recent studies that classify stocks based on price level find that lower-priced stocks have substantially higher spreads (as a percent of stock price) than higher-priced stocks. While an argument can be made that stock price levels are correlated with other variables that affect the spread, such as illiquidity and information asymmetry, studies of bid-ask spreads around stock splits provide us with an opportunity to isolate the effects of just price levels. In these studies, where the bid-ask spread is computed as a percent of the stock price just before and after
11T. Loeb, “Trading Costs: The Critical Link between Investment Information and Results,” Financial Analysts Journal 39 (1983): 39–44.
134 |
|
|
|
|
|
|
|
INVESTMENT PHILOSOPHIES |
|||
|
$60.00 |
|
|
|
|
|
|
|
|
7.00% |
|
|
$50.00 |
|
|
|
|
|
|
|
|
6.00% |
|
|
|
|
|
|
|
|
|
|
|
|
|
|
|
|
|
|
|
|
|
|
|
5.00% |
as % of Price |
and Spread |
$40.00 |
|
|
|
|
|
|
|
|
|
|
|
|
|
|
|
|
|
|
|
4.00% |
||
$30.00 |
|
|
|
|
|
|
|
|
|
||
|
|
|
|
|
|
|
|
|
3.00% |
||
Price |
|
|
|
|
|
|
|
|
|
Spread |
|
$20.00 |
|
|
|
|
|
|
|
|
2.00% |
||
|
|
|
|
|
|
|
|
|
|
|
|
|
$10.00 |
|
|
|
|
|
|
|
|
1.00% |
|
|
|
|
|
|
|
|
|
|
|
|
|
|
$0.00 |
Smallest |
2 |
3 |
4 |
5 |
6 |
7 |
8 |
0.00% |
|
|
|
Largest |
|
||||||||
Average Price |
$4.58 |
$10.30 |
$15.16 |
$18.27 |
$21.85 |
$28.31 |
$35.43 |
$44.34 |
$52.40 |
|
|
Average Spread |
$0.30 |
$0.42 |
$0.46 |
$0.34 |
$0.32 |
$0.32 |
$0.27 |
$0.29 |
$0.27 |
|
|
Spread/Price |
6.55% |
4.07% |
3.03% |
1.86% |
1.46% |
1.13% |
0.76% |
0.65% |
0.52% |
|
|
Market Capitalization Class
|
|
Average Price |
|
Average Spread |
|
Spread/Price |
|
|
|
|
|
|
|
F I G U R E 5 . 2 Prices and Spreads by Market Cap
Source: T. Loeb, “Trading Costs: The Critical Link between Investment Information and Results,” Financial Analysts Journal 39 (1983): 39–44.
stock splits, the spread cost (as a percent of the stock price) increases after stock splits.
A study found that the stocks in the top 20 percent in terms of trading volume had an average spread of only 0.62 percent of the price while the stocks in the bottom 20 percent had a spread of 2.06 percent. Other studies that use different measures of liquidity, including turnover ratios, have come to the same conclusion: less liquid stocks have higher bid-ask spreads.12
Finally, the bid-ask spread seems to be a function of the ownership structure of a company. As insider holdings increase as a percentage of total stock outstanding, bid-ask spreads increase, reflecting lower liquidity (since insiders don’t trade their holdings as frequently) and a fear that insiders may know more about the company than other investors (information asymmetry).13
12R. D. Huang and H. R. Stoll, “Dealer versus Auction Markets: A Paired Comparison of Execution Costs on NASDAQ and the NYSE,” Journal of Financial Economics 41 (1996): 313–357.
13D. Zhou, “Ownership Structure, Liquidity and Trade Informativeness,” Journal
of Finance and Accountancy 6 (2011).

Many a Slip: Trading, Execution, and Taxes |
135 |
In summary, there are wide variations in bid-ask spreads across stocks, but much of the variation can be explained by differences in liquidity, price level, and information asymmetry.
Variation across Markets If bid-ask spreads on U.S. stocks have been studied more intensively than assets listed on other markets, growth in other markets and better access to data are allowing us to explore spreads in these markets. The first extension we look at is equity markets outside the United States. Two decades ago, when liquidity in most emerging markets was very light and there was little competition to market makers in these markets, bid-ask spreads were very large in these markets. As liquidity has improved, spreads have decreased, though they remain higher than spreads in the United States. A study of 20 emerging markets spanning the globe, using data from 1996 to 2007, provides a comprehensive picture of differences in bid-ask spreads across countries in Table 5.1.14
There are two conclusions that we can draw from this table. The first is that the average bid-ask spread (2.16 percent), as a percentage of price, across emerging markets is much higher than the average spread across U.S. stocks. The second is that not all emerging markets are created equal, with spreads far wider in the Philippines than in China or South Korea. Much of the variation across the emerging markets can be explained by differences in liquidity, captured in two measures—the turnover ratio (trading volume/number of shares outstanding) and the percent of trading days with zero trading volume across all stocks in the market. Thus, Russia with a low turnover ratio and no trading on 40 percent of all trading days across all stocks also has large bid-ask spreads.
In some of these countries, there are variations in spreads across markets within the country. In China, for instance, there is evidence that spreads are narrower for domestic investors trading class A and B shares in Chinese companies on domestic exchanges (say, Shanghai) than for global investors trading H class shares in the same companies in Hong Kong, perhaps because information asymmetries are higher in the latter market.15
Moving from stock markets to other financial asset markets, we find that the key factor explaining differences in spreads is liquidity. In the bond market, for instance, the bid-ask spread is narrow in the very liquid U.S. Treasury bond market and in investment grade bonds (BBB rated or higher)
14H. Zhang, “Measuring Liquidity in Emerging Markets” (working paper, National University of Singapore, 2010).
15J. Cai, “Bid-Ask Spreads for Trading Chinese Stocks Listed on Domestic and International Exchanges” (working paper, 2004).

136 |
|
|
|
INVESTMENT PHILOSOPHIES |
|
|
T A B L E 5 . 1 |
Bid-Ask Spreads across Emerging Markets |
|||
|
|
|
|
|
|
|
|
|
|
% Days with Zero |
|
|
Country |
Bid-Ask Spread |
Turnover |
Trading Volume |
|
|
|
|
|
|
|
|
Argentina |
2.55% |
0.08 |
23.87% |
|
|
Brazil |
4.68% |
1.12 |
29.10% |
|
|
Chile |
3.79% |
0.17 |
34.19% |
|
|
Mexico |
2.83% |
0.17 |
20.85% |
|
|
China |
0.31% |
1.31 |
2.55% |
|
|
South Korea |
1.39% |
3.16 |
4.14% |
|
|
Philippines |
6.61% |
0.68 |
20.97% |
|
|
Taiwan |
0.63% |
1.32 |
0.48% |
|
|
India |
1.90% |
0.43 |
3.63% |
|
|
Indonesia |
6.17% |
0.44 |
21.66% |
|
|
Malaysia |
2.43% |
0.34 |
8.67% |
|
|
Singapore |
3.83% |
0.37 |
11.61% |
|
|
Thailand |
2.58% |
1.03 |
13.39% |
|
|
Greece |
1.81% |
0.33 |
2.12% |
|
|
Poland |
1.42% |
1.20 |
4.94% |
|
|
Portugal |
2.05% |
0.25 |
7.43% |
|
|
Russia |
3.17% |
0.15 |
40.06% |
|
|
Turkey |
1.16% |
8.21 |
1.05% |
|
|
Israel |
4.17% |
0.15 |
22.14% |
|
|
South Africa |
4.14% |
0.16 |
18.44% |
|
|
All |
2.16% |
1.73 |
8.88% |
|
|
|
|
|
|
|
Source: H. Zhang, “Measuring Liquidity in Emerging Markets” (working paper, National University of Singapore, 2010).
but increases as we get to high-yield or low-rated bonds, where two factors come into play. The first factor is lower liquidity, and the other is the greater potential for information asymmetry. In the options and futures markets, the bid-ask spreads vary from a sliver in the index and commodity markets to larger values for deep-out-of-the-money options on individual stocks. Finally, spreads tend to be narrow in most currency markets, again because of high trading volume and little scope for information advantages.
Are there bid-ask spreads in the real asset market? In the commodity market, where you can buy or sell spot gold or oil, the bid-ask spreads tend to be small because of the volume of trading and the absence of information asymmetries (for the most part). With other real assets such as real estate or fine art, there is no explicit bid-ask spread, but only because the transaction cost or fee that you pay incorporates the spread. Thus, the 6 percent fee that the real estate agents split on the sale of a house plays the same role as the

Many a Slip: Trading, Execution, and Taxes |
137 |
bid-ask spread, as does the hefty percentage of the value that has to be paid to an auction house (like Sotheby’s) to sell a Picasso.
Variation across Time If variations in liquidity and information asymmetry cause differences in bid-ask spreads across markets and, within markets, across individual assets, it stands to reason that variations over time in these factors will cause bid-ask spreads to also change over time, within any market or for any given stock.
Looking at a long time horizon, say over the last century, it is undeniable that financial markets have become more liquid over time. In the 1920s, for instance, relatively few companies were traded on stock exchanges, and trading was restricted to a few brokers (and wealthy investors). As more stocks have been listed and trading volume has increased, we have seen bidask spreads decrease over the past few decades. Focusing on a more recent period, the average bid-ask spread for stocks listed on the New York Stock Exchange decreased from 23 cents in 1994 to 5 cents in 2004. In fact, financial markets outside the United States have seen even larger improvements in liquidity over the past 20 to 30 years, resulting in lower bid-ask spreads in these markets.
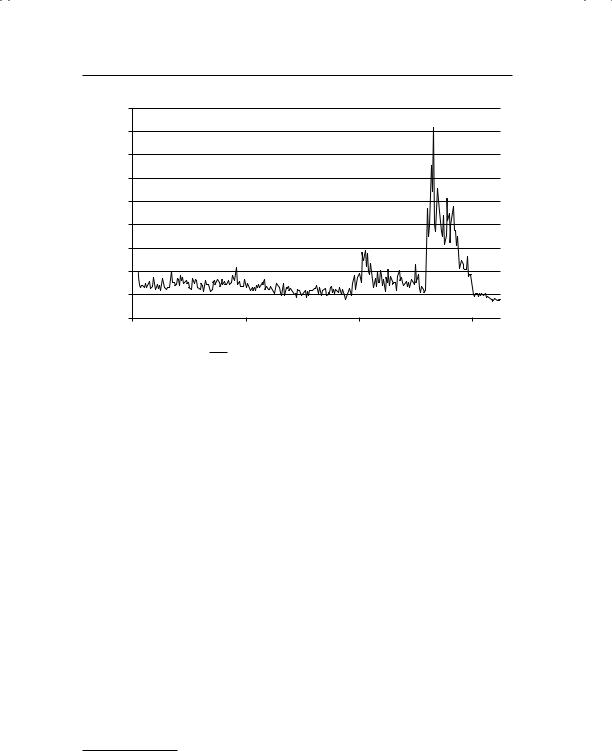
In this generally good news story of long-term improvement in liquidity (and lower transaction costs), there have been painful interludes where liquidity has dried up and trading costs have soared. Every one of the emerging markets listed in Table 5.1 has had at least one crisis in the past few decades, where trading volume has dropped and bid-ask spreads have widened significantly. Developed markets were thought to be immune from such dramatic shifts, but the banking crisis of 2008 dispensed with that illusion. Between September and December 2008, bid-ask spreads widened across the board for all stocks and corporate bonds in the United States, often tripling and quadrupling even on large-cap, liquid stocks. One study that looked at 51 investment grade, large market cap U.S. companies and estimated the bidask spreads on their stocks from 2003 to 2009 found the shifts graphed in Figure 5.3.16
Note the spike in spreads during the banking crisis in 2008. In fact, similar spikes in spreads were reported in corporate bond and credit default swap (CDS) markets during the period.
The last point needs emphasis because it points to a clear and present danger to investment strategies. It is not just that illiquidity varies across time for individual asset classes (stocks, bonds, currencies, real assets) but
16M. Marra, “Illiquidity Commonality across Equity and Credit Markets” (doctoral thesis, Warwick Business School, 2011).
138 |
|
INVESTMENT PHILOSOPHIES |
|
0.0045 |
|
|
|
0.004 |
|
|
|
0.0035 |
|
|
|
0.003 |
|
|
|
0.0025 |
|
|
|
0.002 |
|
|
|
0.0015 |
|
|
|
0.001 |
|
|
|
0.0005 |
|
|
|
0 |
|
|
|
07/07/2003 |
07/07/2005 |
07/07/2007 |
07/07/2009 |
Average Percentage Equity Bid-Ask Spread
F I G U R E 5 . 3 Bid-Ask Spreads for Stocks—51 Liquid U.S. Companies, 2003–2009 Source: M. Marra, “Illiquidity Commonality across Equity and Credit Markets” (Doctoral thesis, Warwick Business School, 2011).
that there is substantial comovement. Put differently, if bid-ask spreads soar in the stock market, it is very likely that you will also see higher spreads in the bond and real asset markets, thus increasing trading costs across the board on your investments.
R o l e i n I n v e s t m e n t S t r a t e g i e s Looking at the evidence, it is clear that bid-ask spreads will affect the returns from investment strategies, but that the effect will vary, depending on the strategy. While a strategy of buying undervalued companies in the Standard & Poor’s (S&P) 500 index and holding for the long term should not be affected very much by the bidask spread, a strategy of buying small over-the-counter stocks or emerging market stocks after information releases and trading frequently might lose its allure when bid-ask spreads are factored into the returns.
To show the effect of the bid-ask spread on returns, consider the strategy of buying so-called loser stocks (i.e., stocks that have gone down the most over the prior year). Researchers present evidence that a strategy of buying the stocks that have the most negative returns over the previous year and holding for a five-year period earns significant positive returns.17 A followup study, however, noted that many of these loser stocks were low-priced,
17W. F. M. DeBondt and R. Thaler, “Does the Stock Market Overreact?” Journal of Finance 40 (1985): 793–805.

Many a Slip: Trading, Execution, and Taxes |
139 |
and that putting in a constraint that the prices be greater than $10 on this strategy resulted in a significant drop in the excess returns. Since bid-ask spreads tend to be largest for low-priced stocks, it is an open question as to whether an investment strategy of buying loser stocks will yield excess returns in practice. In fact, similar concerns should exist about any strategy that requires investing in low-priced, illiquid, and small-cap stocks, or in asset classes that have high volatility and low liquidity.
T h e P r i c e I m p a c t
Most investors assume that trading costs become smaller as portfolios become larger. Though this is true for brokerage commissions, it is not always the case for the other components of trading costs. An investor who tries to trade a larger block may see the bid-ask spread widen, as wary market markets hold back, concerned about information asymmetries. There is one more component where larger investors bear a more substantial cost than do smaller investors, and that is in the impact that their trading has on the price level. If the basic idea behind successful investing is to buy low and sell high, pushing the price up as you buy and then down as you sell reduces the profits from investing.
W h y I s T h e r e a P r i c e I m p a c t ? There are two reasons for the price impact when investors trade. The first is that markets are not completely liquid. A large trade can create an imbalance between buy and sell orders, and the only way in which this imbalance can be resolved is with a price change. This price change that arises from lack of liquidity will generally be temporary and will be reversed as liquidity returns to the market.
The second reason for the price impact is informational. A large trade attracts the attention of other investors in that market because it might be motivated by new information that the trader possesses. Notwithstanding claims to the contrary, investors usually assume, with good reason, that an investor buying a large block is buying in advance of good news and that an investor selling a large block has come into possession of some bad news about the company. This price effect will generally not be temporary, especially when we look across a large number of stocks where such large trades are made. Though investors are likely to be wrong a fair proportion of the time on the informational value of large block trades, there is reason to believe that they will be right often enough to make a difference.
H o w L a r g e I s t h e P r i c e I m p a c t ? There is conflicting evidence on how much of an impact large trades have on stock prices. On the one hand, studies of block trades on the exchange floor seem to suggest that markets are liquid and that the price impact of trading is small and is reversed quickly.