

aswath_damodaran-investment_philosophies_2012
.pdf360 |
|
|
|
INVESTMENT PHILOSOPHIES |
|
|
30.00% |
|
|
|
|
|
|
|
1991–1996 |
1997–2001 |
2002–2010 |
|
25.00% |
|
|
|
|
Return |
20.00% |
|
|
|
|
|
|
|
|
|
|
Annual |
15.00% |
|
|
|
|
|
|
|
|
|
|
Average |
10.00% |
|
|
|
|
|
|
|
|
|
|
|
5.00% |
|
|
|
|
|
0.00% |
|
|
|
|
|
Lowest |
2 |
3 |
4 |
Highest |
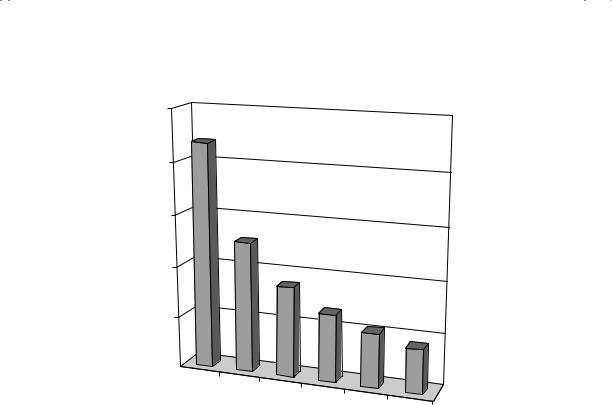
PEG Ratio Class
F I G U R E 9 . 1 7 PEG Ratios and Annual Returns
Source: Value Line.
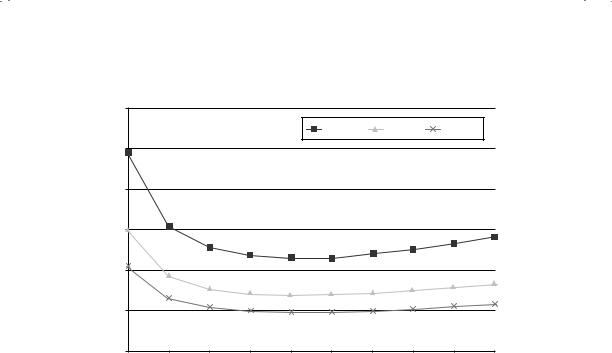
P/E ratio for a hypothetical firm, holding growth and cash flows constant, but varying the risk.19 In Figure 9.18, for instance, we vary the beta of a stock with an expected growth rate of 25 percent for five years and 8 percent forever thereafter, and compute the PEG ratio.
Note that the PEG ratio for the safe firm, with a beta of 0.75, is almost four times higher than the PEG ratio for the risky firm (with the same growth rate) with a beta of 2.00. You can also see the relationship between risk and PEG ratios by computing the average PEG ratios for all stocks listed in the United States and categorizing them based on their riskiness. Figure 9.19 classifies all firms in the United States into 10 risk classes20 and computes the average PEG ratios for firms in each class in January 2011.
19To do this, you first have to compute the P/E ratio based on fundamentals and then divide by the expected growth rate. A more detailed exposition is provided in my book Investment Valuation, but the PEG ratio in a two-stage dividend discount model can be written as
|
(Payout ratio) (1 |
|
g) |
|
1 |
|
(1 + g)n |
|
|
|
|
|
|
|
|
PEG = |
+ |
|
− 1 + ke,hg n |
|
Payout ration (1 + g)n (1 + gn) |
||||||||||
|
|
|
|
|
|||||||||||
|
|
|
|
+ |
|
|
|
|
|
|
|||||
g ke,hg |
− |
g |
|
g (ke,st |
− |
gn) (1 |
+ |
ke,hg )n |
|
||||||
|
|
|
|
|
|
|
|
|
|
|
|
|
|||
20This categorization was based on stock price standard deviation, but we did try alternate measures such as beta and obtained similar results.

362 |
|
|
|
|
|
|
INVESTMENT PHILOSOPHIES |
||
4.50 |
|
|
|
|
|
|
|
|
|
4.00 |
|
|
|
|
|
|
|
|
|
3.50 |
|
|
|
|
|
|
|
|
|
3.00 |
|
|
|
|
|
|
|
|
|
2.50 |
|
|
|
|
|
|
|
|
|
2.00 |
|
|
|
|
|
|
|
|
|
1.50 |
|
|
|
|
|
|
|
|
|
1.00 |
|
|
|
|
|
|
|
|
|
0.50 |
|
|
|
|
|
|
|
|
|
0.00 |
|
|
|
|
|
|
|
|
|
Riskiest |
2 |
3 |
4 |
5 |
6 |
7 |
8 |
9 |
Safest |
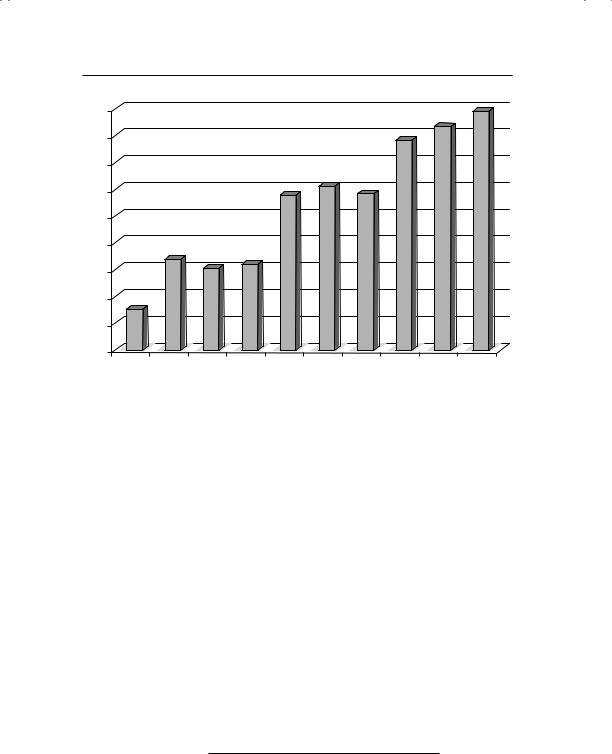
F I G U R E 9 . 1 9 PEG Ratios by Risk Class in January 2011: U.S. Stocks Source: Capital IQ.
examine the relationship between PEG ratios and risk, we can estimate the PEG ratio for a hypothetical firm in Figure 9.20 as you change the expected growth rate during its high-growth phase.
The PEG ratio is highest when the expected growth rate is low, but is lower at higher expected growth rates. Clearly, the problem is greatest when you are comparing high-growth firms to low-growth firms, since PEG ratios will be understated for the former and overstated for the latter. It is less of an issue if you are comparing PEG ratios across firms with high growth rates, since the effect is muted.
In short, picking stocks based on low PEG ratios can leave you with a portfolio of stocks with high risk and high growth that are not undervalued. Can you correct for these errors? You can adjust for risk by either considering it as a separate factor (you pick stocks with low PEG ratios and low risk) or modifying the PEG ratio. Morgan Stanley, for example, aware of the potential bias toward risk in the PEG ratio, modified it to include the dividend yield in the denominator to create a new ratio called the PEGY ratio:
PEGY =
P/E
(Expected growth rate + Dividend yield)

364 |
INVESTMENT PHILOSOPHIES |
follow, you should compare the different sources that you have for this input to see which one has the best track record.
2.If your underlying strategy is sound, a long time horizon increases your chances of earning excess returns. In other words, if you conclude after careful analysis that buying stocks that have P/E ratios less than the expected growth rate would have yielded high returns over the past two decades, you will be more likely to replicate these results if you have a five-year horizon than a one-year horizon.
3.There seem to be interactions between growth potential and the stock price momentum that we referenced in Chapter 7, with momentum being stronger at high-growth companies. Thus, combining a passive growth screen with a momentum screen (such as relative strength) may augment the returns to the strategy.
4.Finally, there are extended cycles where the growth screens work exceptionally well and other cycles where they are counterproductive. If you can time these cycles, you could augment your returns substantially. Since many of these cycles are related to how the overall market is doing, this boils down to your market timing ability.
E S T I M A T I N G G R O W T H F R O M F U N D A M E N T A L S
If obtaining better estimates of growth is key to successful growth investing, you may want to consider breaking your dependence on estimates of growth made by equity research analysts. As we will see in the next chapter, analysts often do not estimate long-term growth, and even when they do, they provide biased estimates. One alternative that may yield better and more robust estimates is to link the expected growth to fundamental aspects of how a firm is run. In fact, the expected growth rate in earnings for a firm comes from two sources: its willingness to reinvest its earnings back into new projects and assets
and its capacity to earn high returns on these investments. The growth rate in earnings for a firm in the long term should be a product of the proportion of its earnings that are reinvested back in the business and the return on this investment. For equity earnings, it can be computed as follows:
Growth rate in earnings per share =
(1 − Dividends/Earnings)(Return on equity)
Consider, for instance, a company that pays no dividends and earns about 25 percent on its equity. Its expected growth rate, if it can

The Allure of Growth: Small Cap and Growth Investing |
365 |
sustain these numbers, will be 25 percent. In contrast, a company that pays about 50 percent of its earnings as dividends and earns 16 percent as its return on equity will have an expected growth rate of 8 percent.
When computing growth in operating earnings, you will have to modify the equation to make it consistent:
Growth rate in operating earnings = [(Capital expenditures − Depreciation + Change in working capital)/EBIT(1 − t)]Return on capital
Thus, a company that reinvests 80 percent of its after-tax operating income and earns a return on capital of 40 percent will be able to post a growth rate of 32 percent a year.
A C T I V I S T G R O W T H I N V E S T I N G
In activist growth investing, you not only take a position in a growth business but you also play an active role in making it successful. Since most growth businesses start off as small and privately owned, the most common forms of activist growth investing involve taking positions in these businesses before they go public and in nurturing them toward eventual public offerings and large profits. In this section, we consider venture capital and private equity investing as examples of activist growth investing.
D e s c r i p t i o n
In venture capital investing, you provide equity financing to small and often risky businesses in return for a share of the ownership of the firm. The size of your ownership share will depend on two factors. First, at the minimum, you will demand an ownership share based on how much capital you contribute to the firm, relative to total firm value. For instance, if you provide $2 million and the estimated value of the firm is $10 million, you will expect to own at least 20 percent of the firm. Second, if the business can raise the funds from other sources, its bargaining position will be stronger, and it may be able to reduce your share down to a small premium over the minimum just specified. If a business has no other options available to raise the equity financing, however, its bargaining position is considerably weaker, and the owner of the business will have to give up a disproportionate share of the ownership to get the required funding. In general, the capacity to raise funds


The Allure of Growth: Small Cap and Growth Investing |
367 |
capital allows firms that have established products and concepts to develop and market them. Additional rounds of venture capital allow private firms that have more established products and markets to expand. There are five steps associated with how venture capital gets to be provided to firms, and how venture capitalists ultimately profit from these investments.
P r o v o k e E q u i t y I n v e s t o r ’ s I n t e r e s t There are hundreds of small firms interested in raising finance from private equity investors, and relatively few venture capitalists and private equity investors. Given this imbalance, the first step that a private firm wanting to raise private equity has to take is to get private equity investors interested in investing in it. There are a number of factors that help the private firm at this stage. One is the type of business that the private firm is in, and how attractive this business is to private equity investors. In the late 1980s and early 1990s, for instance, firms in biotechnology were the favored targets for private equity investors. By the late 1990s, the focus had shifted to Internet and technology stocks.
Another factor is the track record of the top manager or managers of the firm. Top managers who have a track record of converting private businesses into publicly traded firms have an easier time raising private equity capital. Thus, it is not uncommon to see serial entrepreneurs, who start, nurture and take public multiple companies sequentially, with easy access to venture capital.
V a l u a t i o n a n d R e t u r n A s s e s s m e n t Once private equity investors become interested in investing in a firm, the value of the private firm has to be assessed by looking at both its current and expected prospects. While venture capitalists sometimes use discounted cash flow models to value firms, they are much more likely to value private businesses using what is called the venture capital method. Here, the earnings of the private firm are forecast for a future year when the company can be expected to go public. These earnings, in conjunction with a price-earnings multiple estimated by looking at publicly traded firms in the same business, is used to assess the value of the firm at the time of the initial public offering; this is called the exit or terminal value.
For instance, assume that a small private software firm is expected to have an initial public offering in three years, and that the net income in three years for the firm is expected to be $4 million. If the price-earnings ratio of publicly traded software firms is 25, this would yield an estimated exit value of $100 million. This value is discounted back to the present at what venture capitalists call a target rate of return, which measures what venture capitalists believe is a justifiable return, given the risk that they are exposed

368 |
INVESTMENT PHILOSOPHIES |
to. This target rate of return is usually set at a much higher level21 than the traditional cost of equity for the firm.
Discounted terminal value = Estimated exit value/(1 + Target return)n
In this example, if the venture capitalists require a target return on 30 percent on the investment, the discounted terminal value for the firm would be:
Discounted terminal value = $100 million/1.303 = $45.52 million
S t r u c t u r i n g t h e D e a l In structuring the deal to bring private equity into the firm, the private equity investor and the firm have to negotiate two items. First, the private equity investor has to determine what proportion of the value of the firm he or she will demand in return for the private equity investment. The owners of the firm, in turn, have to determine how much of the firm they are willing to give up in return for the same capital. In these assessments, the amount of new capital being brought into the firm has to be measured against the estimated firm value. In the software firm example, assuming that the venture capitalists are considering investing $12 million, they would want to own at least 26.36 percent of the firm.22
Ownership proportion = Capital provided/Estimated value = $12/$45.52 = 26.36%
Second, the private equity investors will often impose constraints on the managers of the firm in which the investment is being made. This is to ensure that the private equity investors are protected and that they have a say in how the firm is run.
P o s t d e a l M a n a g e m e n t Once the private equity investment has been made, the private equity investor will often take an active role in the management of the firm. Private equity investors and venture capitalists bring not only a wealth of management experience to the process, but also contacts that can be used to raise more capital and get fresh business for the firm.
21By 1999, for instance, the target rate of return for private equity investors was in excess of 30 percent.
22Private equity investors draw a distinction between what a firm will be worth without their capital infusion (premoney) and what it will be worth with the infusion (postmoney). Optimally, they would like their share of the firm to be based on the premoney valuation, which will be lower.

The Allure of Growth: Small Cap and Growth Investing |
369 |
E x i t Private equity investors and venture capitalists invest in private businesses because they are interested in earning a high return on these investments. There are three ways in which a private equity investor can profit from an investment in a business. The first and usually the most lucrative alternative is an initial public offering made by the private firm. While venture capitalists do not usually liquidate their investments at the time of the initial public offering, they can sell at least a portion of their holdings once shares are traded.23 The second alternative is to sell the private business to another firm; the acquiring firm might have strategic or financial reasons for the acquisition. The third alternative is to withdraw cash flows from the firm and liquidate the firm over time. This strategy would not be appropriate for a high-growth firm, but it may make sense if investments made by the firm no longer earn excess returns.
T h e P a y o f f t o V e n t u r e C a p i t a l a n d P r i v a t e
E q u i t y I n v e s t i n g
Note that the act of seeking and receiving venture capital is voluntary, and both sides enter into the relationship with the hope of gaining from it. The business gains access to funds that would not have been available otherwise; these funds in turn might enable the firm to bridge the gap until it can become a publicly traded firm. The venture capitalist might contribute management and organizational skills to the venture and provide the credibility needed for the business to raise more financing. The venture capitalist also might provide the know-how needed for the firm to eventually make a public offering of its equity. If the venture capitalist picks the right businesses to fund and provides good management skills and advice, there can be large returns on the initial investment. While the venture capitalist may reap returns from the private business itself, the largest payoff occurs if and when the business goes public and the venture capitalist is able to convert his or her stake into cash at the market price.
How well do venture capital and private equity investors do, relative to the market? There is clearly anecdotal evidence that some venture capital investors do very well on individual deals and over time. There are also periods of time when venture capital and private equity investing collectively
23B. S. Black and R. J. Gilson, “Venture Capital and the Structure of Capital Markets: Banks versus Stock Markets,” Journal of Financial Markets 47 (1998): 243–277. They argue that one of the reasons why venture capital is much more active in the United States than in Japan or Germany is because the option to go public is much more easily exercised in the United States.