

aswath_damodaran-investment_philosophies_2012
.pdf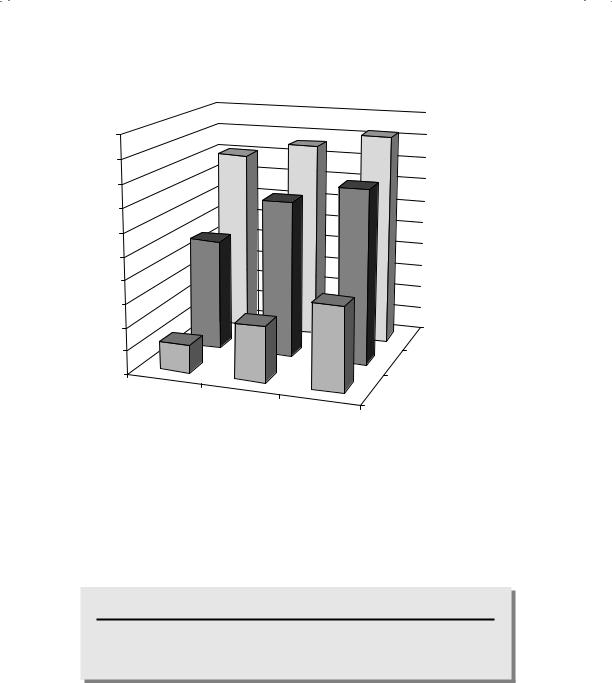
The Allure of Growth: Small Cap and Growth Investing |
351 |
0.50 |
|
|
0.45 |
|
|
0.40 |
|
|
0.35 |
|
|
0.30 |
|
|
0.25 |
|
|
0.20 |
|
|
0.15 |
|
|
0.10 |
|
Large-Cap Firms |
0.05 |
|
|
|
|
|
0.00 |
|
Mid-Cap Firms |
|
|
|
Correlation |
Correlation |
Small-Cap Firms |
between |
Correlation |
|
1990–1994 |
between |
|
and 1995–1999 |
1994–1996 |
between 1998 |
|
and 1997–1999 |
and 1999 |
F I G U R E 9 . 1 3 Correlations in Earnings Growth by Market Capitalization Source: Capital IQ.
for the rest of the market. This would suggest that you should be more cautious about using past growth, especially in earnings, for forecasting future growth at these firms.
N U M B E R W A T C H
Historical earnings growth: Take a look at average growth rate over the past five years in earnings, by sector, for U.S. companies.
The second problem is that there is mean reversion in earnings growth rates. In other words, companies that are growing fast will see their growth rates decline toward the market or industry average, whereas below average growth companies will see their growth rates increase.

352 |
INVESTMENT PHILOSOPHIES |
This tendency is chronicled by Dreman and Lufkin when they track companies in the highest and lowest earnings growth classes for five years after the portfolios are formed.16 Although the highest earnings growth companies have an average growth rate that is 20 percent higher than the average growth rate for the lowest earnings growth companies in the year the portfolio is formed, the difference is close to zero five years later.
In general, revenue growth tends to be more persistent and predictable than earnings growth. This is because accounting choices have far smaller effects on revenues than they do on earnings. Consequently, revenue growth is more correlated over time than earnings growth. The implication is that historical growth in revenues is a far more useful number when it comes to forecasting than historical growth in earnings.
There are some investors who believe that it is not earnings growth per se that you should be looking at but momentum in growth. In other words, you want to invest in stocks whose earnings growth is accelerating. This is, in fact, a big component of what Value Line’s acclaimed stock picking measures are based on. While Value Line may have been successful with this strategy in its earlier years, much of what we have said about earnings growth also applies to earnings momentum.
In summary, past earnings growth is not a reliable indicator of future growth, and investing in companies with high past growth does not yield significant returns. In fact, if there is mean reversion and you pay a large premium for companies with high growth, you will find yourself with a losing portfolio.
Expected Earnings Growth Value is ultimately driven by future growth and not past growth. It seems reasonable, therefore, that you would be better served investing in stocks whose expected growth is high rather than historical growth. Here, you do run into a practical problem. In a market as large as that of the United States, you cannot estimate expected growth for each firm in the market. Instead, you have to rely on analyst estimates of expected growth for companies. That information, though, is freely accessible now to most investors, and you could buy stocks with high expected growth rates in earnings. But will such a strategy generate excess returns?
16D. Dreman and E. Lufkin, “Do Contrarian Strategies Work within Industries?” Journal of Investing (Fall 1997): 7–29; D. Dreman and E. Lufkin, “Investor Overreaction: Evidence That Its Basis Is Psychological,” Journal of Psychology and Financial Markets 1 (2000): 61–75.

The Allure of Growth: Small Cap and Growth Investing |
353 |
N U M B E R W A T C H
Expected earnings growth: Take a look at expected growth rates over the next five years in earnings, by sector, for U.S. companies.
Consider what you would need for this strategy to be successful. First, analysts have to be proficient at forecasting long-term earnings growth. Second, the market price should not already reflect or price this growth. If it does, your portfolio of high-growth companies will not generate excess returns. On both conditions, the evidence works against the strategy. When it comes to forecasting growth, analysts have a tendency to base long-term growth forecasts on past growth, and the forecast errors are high for longterm forecasts. In fact, some studies find that time series models match or even outperform analysts when it comes to forecasting long-term growth. As for pricing growth, markets historically have been more likely to overprice growth than underprice it, especially during periods of high earnings growth for the market.
H i g h - P / E S t r a t e g y The easiest growth strategy, albeit the riskiest, is to buy the stocks with the highest P/E ratios on the market, on the assumption that these are growth companies whose growth will deliver the excess returns in the future.
The Overall Evidence We should begin by noting that the overall evidence on beating the market with high P/E ratio stocks is grim. As we argued in Chapter 8, buying low P/E ratio stocks seems to outperform high P/E ratio stocks by significant margins. Figure 9.14 presents the difference in annual returns from buying low P/E ratio and high P/E ratio portfolios from 1952 to 2010.
On both an equally weighted and a value-weighted basis, high P/E ratio stocks have underperformed low P/E ratio stocks. In fact, it is this consistent underperformance of high P/E ratio stocks that has led to the value-investing bias that we often see in both academic and practitioner research.
The Growth Investors’ Case Given this sorry performance, you might wonder what attracts investors to this strategy. The answer lies in market cycles. There have been extended time periods in which high-P/E stocks have outperformed low-P/E stocks. For instance, growth investing seems to do much


356 |
INVESTMENT PHILOSOPHIES |
actively managed growth fund by only 16 basis points a year, whereas the value index outperformed a growth index by 47 basis points a year. He attributes the 31 basis point difference to the contribution of active growth managers relative to value managers. We will look at this evidence in more detail in Chapter 13.
P E T E R L Y N C H : F I N D I N G V A L U E I N
G R O W T H S T O C K S
If Warren Buffett is the icon for value investors, Peter Lynch occupies a similar position for growth investors. His reputation was made during his stewardship of Fidelity Magellan, a small high-growth fund that he took over in 1977 and made into the largest equity mutual fund in the world over the next decade. The reason for its growth was its performance. An investment of $10,000 in the Magellan fund would have grown 20-fold over the next 10 years. During that period, Lynch also helped dispel the notion that growth investors were incurable optimists who bought stocks on promises. He introduced the rigors of value investing to growth investing, and he described much of what he did in his books on investing and his articles for Worth, a financial magazine.
Looking at his writings, you can summarize his views on growth investing in the following maxims. The first is that numbers matter more than stories and that the allure of a growth company has to be measured by the results it delivers and not just by its promise. The second is that it takes far more work and effort to monitor a growth company than it does a value company. Thus, spreading your bets across too many companies can hurt you. The third is that you have to take a stand early in a growth company’s life to make profits, since waiting to invest until a growth company has clearly established its presence is usually too late. The fourth is that you need to be patient; even with the right growth companies, it may take a while for the returns to manifest themselves. Finally, good growth companies are rare, and finding one good growth company may require you to research a dozen or more companies.
G A R P S t r a t e g i e s There are many growth investors who would blanch at the strategy of buying high-P/E stocks. Their mission, they would argue, is to buy high-growth stocks whose growth is undervalued. To find these stocks, they have developed a number of strategies in which you consider

The Allure of Growth: Small Cap and Growth Investing |
357 |
both expected growth and the current pricing of the stock. We consider two of these strategies in this section: buying stocks with a P/E less than the expected growth rate and buying stocks with a low ratio of P/E to growth (called a PEG ratio).
PE Less Than Growth Rate The simplest growth at a reasonable price (GARP) strategy is to buy stocks that trade at a P/E ratio less than the expected growth rate. Thus, a stock that has a P/E ratio of 12 and an expected growth rate of 8 percent would be viewed as overvalued, whereas a stock with a P/E of 40 and an expected growth rate of 50 percent would be viewed as undervalued. While this strategy clearly has the benefit of simplicity, it can be dangerous for several reasons.
Interest rate effect. Since growth generates earnings in the future, the value created by any given growth rate will be greater when interest rates are low (which makes the present values higher) than when interest rates are high. Thus, the stock with a P/E of 40 and an expected growth rate of 50 percent when interest rates are 7 percent may find itself with a P/E of 60 if interest rates drop to 5 percent. It is not surprising, therefore, that portfolio managers who use this strategy not only find far more underpriced stocks when interest rates are high but also find stocks in many emerging markets (where interest rates tend to be high) to be cheap. The effect of interest rates on the relationship between P/E and growth can be best illustrated by looking at the percentage of firms that trade at less than their expected growth rate as a function of the Treasury bond rate. In 1981, when Treasury bond rates hit 12 percent, more than 65 percent of firms traded at P/E ratios less than the expected growth rate. In 1991, when rates had dropped to about 8 percent, the percentage of stocks trading at less than the expected growth rate also dropped to about 45 percent. By the end of the 1990s, with the Treasury bond rate dropping to 5 percent, the percentage of stocks that traded at less than the expected growth rate had dropped to about 25 percent.
Growth rate estimates. When this strategy is used for a large number of stocks, you have no choice but to use the growth rate estimates of others. In some cases, the consensus growth rates estimated by all analysts following a firm are obtained from a data service. When you do this, you have to wonder both about the differences in the quality of the growth estimates across different analysts and about their comparability. Given that these estimated growth rates are at most for five years, you may penalize companies that have expected growth for much longer periods by focusing just on the five-year rate.


The Allure of Growth: Small Cap and Growth Investing |
359 |
estimates for all firms in the sample. You should not, for instance, use fiveyear growth rates for some firms and one-year growth rates for others. One way of ensuring uniformity is to use the same source for earnings growth estimates for all the firms in the group. For instance, both I/B/E/S and Zacks provide consensus estimates from analysts of earnings per share growth over the next five years for most U.S. firms. Many analysts who use PEG ratios, though, prefer to use short-term growth rates in earnings in their computations.
Using the PEG Ratio How do analysts use PEG ratios? A stock with a low PEG ratio is considered cheap, because you are paying less for the growth. It is viewed as a growth-neutral measure that can be used to compare stocks with different expected growth rates. In a study concluded in 1998, Morgan Stanley found that a strategy of buying stocks with low PEG ratios yielded returns that were significantly higher than what you would have made on the S&P 500. The researchers came to this conclusion by looking at the 1,000 largest stocks on the U.S. and Canadian exchanges each year from January 1986 through March 1998, and categorizing them into deciles based on the PEG ratio. They found that the 100 stocks with the lowest PEG ratios earned an annual return of 18.7 percent during the period, higher than the market return of about 16.8 percent over the period. While no mention was made of risk adjustment, it was argued that the difference was larger than could be justified by the risk adjustment.
We updated this study to examine how this strategy would have done from 1991 to 2010, creating five portfolios at the end of each year based on the PEG ratio and examining the returns in the following year. Figure 9.17 summarizes the average annual returns on PEG ratio classes in the 1991 to 1996, 1997 to 2001, and 2002 to 2010 time periods.
A strategy of investing in low PEG ratio stocks would have generated an average return about 2 to 3 percent higher than the average returns on a high PEG ratio portfolio, before adjusting for risk, during all of the time periods.
Potential Problems There are two potential problems with PEG ratios that may lead us to misidentify riskier stocks with higher growth rates as undervalued. The first and most obvious problem is that the PEG ratio is obtained by dividing the P/E ratio by the expected growth rate, and the uncertainty about that expected growth rate is not factored into the number. Intuitively, you would expect riskier stocks for any given growth rate to have lower P/E ratios. Thus, a stock that looks cheap on a PEG ratio basis may be, in fact, correctly valued or even overvalued. The relationship between risk and growth can be illustrated in two ways. The first is by computing the