

aswath_damodaran-investment_philosophies_2012
.pdf220 |
INVESTMENT PHILOSOPHIES |
one, though it does confirm that there are subperiods (e.g., 1980–1996) where momentum and firm size are correlated.16
3.There also seem to be differences in opinion on whether momentum is stronger on the upside (as prices are rising) or on the downside (as prices are falling). The conclusions seem to vary, depending on the time period examined, with upside momentum dominating over very long time periods (1926–2009) and downside momentum winning out over some subperiods (such as 1980–1996).
4.Price momentum is more sustained and stronger for higher-growth companies with higher price-to-book ratios than for more mature companies with lower price-to-book ratios.
Researchers looking at other asset markets have found evidence that momentum is not restricted to stock markets. There is evidence of price momentum in commodity markets, currency markets, and real estate, and many investment strategies are built around that phenomenon.
T h e L o n g T e r m : P r i c e R e v e r s a l A g a i n !
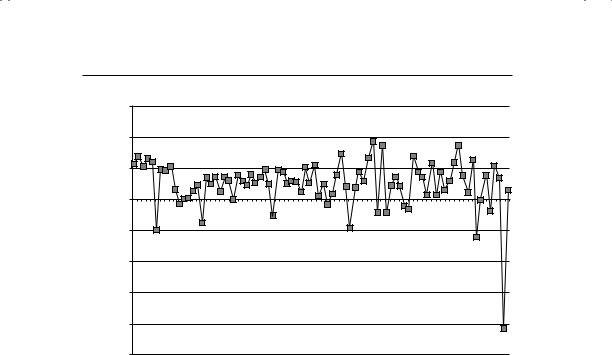
When the long term is defined in terms of many years, there is substantial negative correlation in returns, suggesting that markets reverse themselves over long periods. Fama and French examined five-year returns on stocks from 1941 to 1985 and presented evidence of this phenomenon.17 They found that serial correlation is more negative in five-year returns than in oneyear returns, and is much more negative for smaller stocks rather than larger stocks. Figure 7.4 summarizes one-year and five-years serial correlation by size class for stocks on the New York Stock Exchange.
This phenomenon has also been examined in other markets, and the findings have been similar.
Given the findings of little or no correlation in the short term and substantial correlation in the long term, it is interesting that so many technical analysts focus on predicting intraday or daily prices. The bigger payoff seems to be in looking at price patterns over much longer periods, though there are caveats we will present in the next chapter on these long-term strategies.
16R. Israel and T. J. Moskowitz, “The Role of Shorting, Firm Size, and the Time on Market Anomalies” (working paper, University of Chicago, 2011).
17E. F. Fama and K. R. French, “Permanent and Temporary Components of Stock Prices,” Journal of Political Economy 96: 246–273.
Smoke and Mirrors? Price Patterns, Volume Charts, and Technical Analysis |
221 |
Correlation in Returns
0.00
–0.10
–0.20
–0.30
–0.40
–0.50
–0.60
Smallest 2 |
3 |
4 |
5 |
|
|
|
|
5-Year |
|
6 |
|
|
|
||||
|
|
|
7 |
|
|
1-Year |
||
|
|
|
|
8 |
|
|||
|
|
Market Value Class |
9 |
|||||
|
|
|
Largest |
|||||
|
|
|
|
|||||
|
|
|
|
|
|
|
|
|
F I G U R E 7 . 4 One-Year and Five-Year Correlations: Market Value Class: 1941 to 1985
Source: Fama and French (1988).
T h e T i p p i n g P o i n t If there is price momentum in asset markets that lasts for months but there is price reversal over years, there has to be a tipping point, where momentum breaks and reversal starts to dominate. That tipping point is not just of academic interest, since it is the key to the success of a momentum-based strategy. After all, the biggest danger you face in any momentum strategy is missing the inflection point where the momentum changes direction.
N U M B E R W A T C H
Price momentum by sector: See the returns in prior periods for U.S. stocks, broken down by sector.
There have been a few attempts to gauge when this inflection point occurs by looking at past data and examining the relationship between holding periods and returns on a momentum strategy. These studies seem to indicate that momentum profits continue (and thus increase returns) for between six and nine months, suggesting that this is the optimal holding period for a momentum-based strategy. The nature of momentum strategies
222 |
|
|
|
|
|
|
|
|
|
|
|
|
|
|
|
|
|
|
|
|
|
|
|
|
|
INVESTMENT PHILOSOPHIES |
|||||||||||||||
60.00% |
|
|
|
|
|
|
|
|
|
|
|
|
|
|
|
|
|
|
|
|
|
|
|
|
|
|
|
|
|
|
|
|
|
|
|
|
|
|
|
|
|
40.00% |
|
|
|
|
|
|
|
|
|
|
|
|
|
|
|
|
|
|
|
|
|
|
|
|
|
|
|
|
|
|
|
|
|
|
|
|
|
|
|
|
|
20.00% |
|
|
|
|
|
|
|
|
|
|
|
|
|
|
|
|
|
|
|
|
|
|
|
|
|
|
|
|
|
|
|
|
|
|
|
|
|
|
|
|
|
0.00% |
|
|
|
|
|
|
|
|
|
|
|
|
|
|
|
|
|
|
|
|
|
|
|
|
|
|
|
|
|
|
|
|
|
|
|
|
|
|
|
|
|
–20.00% |
|
|
|
|
|
|
|
|
|
|
|
|
|
|
|
|
|
|
|
|
|
|
|
|
|
|
|
|
|
|
|
|
|
|
|
|
|
|
|
|
|
–40.00% |
|
|
|
|
|
|
|
|
|
|
|
|
|
|
|
|
|
|
|
|
|
|
|
|
|
|
|
|
|
|
|
|
|
|
|
|
|
|
|
|
|
–60.00% |
|
|
|
|
|
|
|
|
|
|
|
|
|
|
|
|
|
|
|
|
|
|
|
|
|
|
|
|
|
|
|
|
|
|
|
|
|
|
|
|
|
–80.00% |
|
|
|
|
|
|
|
|
|
|
|
|
|
|
|
|
|
|
|
|
|
|
|
|
|
|
|
|
|
|
|
|
|
|
|
|
|
|
|
|
|
–100.00% |
|
|
|
|
|
|
|
|
|
|
|
|
|
|
|
|
|
|
|
|
|
|
|
|
|
|
|
|
|
|
|
|
|
|
|
|
|
|
|
|
|
1927 |
1929 |
1931 |
1933 |
1935 |
1937 |
1939 |
1941 |
1943 |
1945 |
1947 |
1949 |
1951 |
1953 |
1955 |
1957 |
1959 |
1961 |
1963 |
1965 |
1967 |
1969 |
1971 |
1973 |
1975 |
1977 |
1979 |
1981 |
1983 |
1985 |
1987 |
1989 |
1991 |
1993 |
1995 |
1997 |
1999 |
2001 |
2003 |
2005 |
2007 |
2009 |
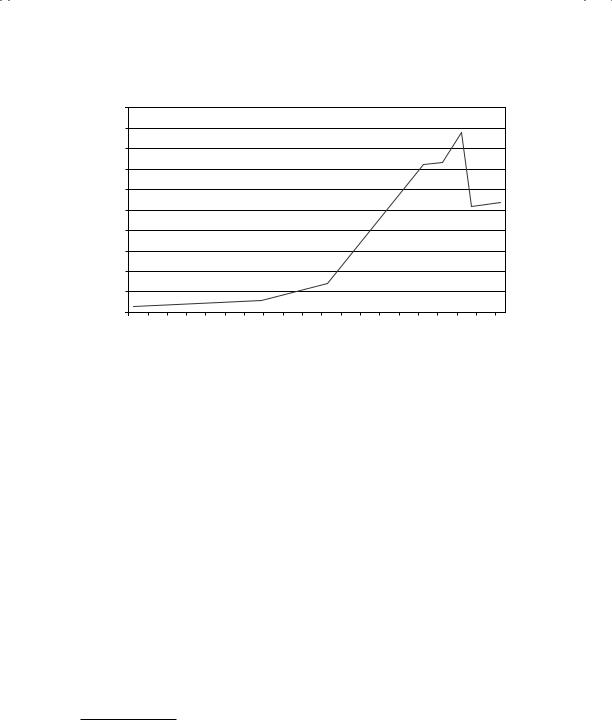
F I G U R E 7 . 5 Returns to a Momentum Strategy for U.S. Stock: 1927 to 2010 Source: Raw data from Ken French’s Data Library (Dartmouth College).
is that investors tend to make money consistently for long periods while momentum lasts, but then lose large amounts when momentum shifts. Using data from Fama and French on the difference in returns between the top and bottom deciles of stocks, based on momentum, we can see this danger in Figure 7.5.
Note that a strategy of buying winners (high-momentum stocks) initiated in 1990 would have beat losers (low-momentum stocks) in 17 of the next 20 years, but the losses in the three years (especially in 2009) would have wiped out a great deal of the profits from the profitable years.
P r i c e C o r r e l a t i o n R u n A m o k : M a r k e t B u b b l e s
Looking at the evidence on price patterns, there is evidence of both price momentum (in the medium term) and price reversal (in the short term and really long term). Read together, you have the basis for price bubbles: the momentum creates the bubble and the crash represents the reversal. Through time markets have boomed and busted, and in the aftermath of every bust, irrational investors have been blamed for the crash. As we will see in this section, it is not that simple. You can have bubbles in markets with only rational investors, and assessing whether you are in a bubble is
Smoke and Mirrors? Price Patterns, Volume Charts, and Technical Analysis |
223 |
|
0.2 |
|
|
0.18 |
|
|
0.16 |
|
Weight |
0.14 |
|
0.12 |
|
|
|
|
|
Price/Unit |
0.1 |
|
0.08 |
|
|
0.06 |
|
|
|
|
|
|
0.04 |
|
|
0.02 |
|
|
0 |
|
|
1/2/371/4/371/6/371/8/37 |
2/1/372/3/372/5/372/7/372/9/37 |
|
1/10/371/12/371/14/371/16/371/18/371/20/371/22/371/24/371/26/371/28/371/30/37 |
|
Date of Trade
F I G U R E 7 . 6 Price of a Tulip Bulb (Switzer)—January and February 1637
Source: Raw data from P. M. Garber, “Who Put the Tulip in Tulipmania?” in
Crashes and Panics: The Lessons of History, ed. Eugene N. White (New York: Dow Jones Irwin/McGraw-Hill, 1990).
significantly more difficult, while you are in the midst of one, than after it bursts.
A S h o r t H i s t o r y o f B u b b l e s As long as there have been markets, there have been bubbles. Two of the earliest bubbles to be chronicled occurred in the 1600s in Europe. One was the boom in prices of tulip bulbs in Holland that began in 1634. A single tulip bulb (Semper Augustus was one variety) sold for more than 5,000 guilders (the equivalent of more than $60,000 today) at the peak of the market. Stories abound, though many of them may have been concocted after the fact, of investors selling their houses and investing the money in tulip bulbs. As new investors entered the market in 1636, the frenzy pushed bulb prices up even more until the price peaked in early February. Figure 7.6 presents the price of one type of bulb (Switzers) in January and February of 1637.18
18P. M. Garber, “Who Put the Tulip in Tulipmania?” in Crashes and Panics: The Lessons of History, ed. Eugene N. White (New York: Dow Jones Irwin/McGrawHill, 1990).

224 |
INVESTMENT PHILOSOPHIES |
Note that the price peaked on February 5, 1637, but investors who bought tulip bulbs at the beginning of the year saw their investments increase almost 30-fold over the next few weeks.
A little later in England, a far more conventional bubble was created in securities of a firm called the South Sea Corporation, a firm with no assets that claimed to have the license to mint untold riches in the South Seas. The stock price was bid up over the years before the price plummeted. The crash, which is described in vivid detail in Charles Mackay’s classic book
Extraordinary Popular Delusions and the Madness of Crowds, left many investors in England poorer.19
Through the 1800s, there were several episodes of boom and bust in the financial markets in the United States, and many of these were accompanied by banking panics.20 As markets became broader and more liquid in the 1900s, there was a renewed hope that liquidity and more savvy investors would make bubbles a phenomenon of the past, but it was not to be. In 1907, J. P. Morgan had to intervene in financial markets to prevent panic selling, a feat that made his reputation as the financier of the world. The 1920s saw a sustained boom in U.S. equities, and this boom was fed by a number of intermediaries ranging from stockbrokers to commercial banks and sustained by lax regulation. The crash of 1929 precipitated the Great Depression, and created perhaps the largest raft of regulatory changes in the United States, ranging from restrictions on banks (the Glass-Steagall Act) to the creation of the Securities and Exchange Commission.
The period after World War II ushered in a long period of stability for the United States, and while there was an extended period of stock market malaise in the 1970s, the bubbles in asset prices tended to be tame relative to past crashes. In emerging markets, though, bubbles continued to form and burst. In the late 1970s, speculation and attempts by some in the United States to corner the precious metals markets did create a brief boom and bust in gold and silver prices. By the mid-1980s, there were some investors who were willing to consign market bubbles to history. On October 19, 1987, the U.S. equities market lost more than 20 percent of its value in one day, the worst single day in market history, suggesting that investors,
19C. Mackay, Extraordinary Popular Delusions and the Madness of Crowds, 1852; reprinted by John Wiley & Sons, New York. To get a flavor of financial markets in England at the time of the South Sea bubble, you should look at A Conspiracy of Paper, a novel set in the era by David Liss (New York: Ballantine Books, 2001). Also see E. Chancellor, Devil Takes the Hindmost (New York: Plume, 2000).
20The crash of 1873 was precipitated by the failure of firm called Jay Cooke, a financial services firm in Philadelphia. The New York Stock Exchange was closed for 10 days and several banks closed their doors in the aftermath.
Smoke and Mirrors? Price Patterns, Volume Charts, and Technical Analysis |
225 |
|
700 |
|
|
|
|
|
|
|
|
|
|
|
|
|
|
|
|
|
|
|
5,000 |
|
|
|
|
Internet Index |
NASDAQ |
|
|
|
|
|
|
|
|
|
|
|
|
|
|
4,500 |
|
||
|
600 |
|
|
|
|
|
|
|
|
|
|
|
|
|
|
|
|
|
|
|
|
|
Index |
|
|
|
|
|
|
|
|
|
|
|
|
|
|
|
|
|
|
|
4,000 |
|
|
|
|
|
|
|
|
|
|
|
|
|
|
|
|
|
|
|
|
|
|
|
||
500 |
|
|
|
|
|
|
|
|
|
|
|
|
|
|
|
|
|
|
|
3,500 |
|
|
Interactive Internet |
400 |
|
|
|
|
|
|
|
|
|
|
|
|
|
|
|
|
|
|
|
3,000 |
NASDAQ |
|
|
|
|
|
|
|
|
|
|
|
|
|
|
|
|
|
|
|
|
|||
|
|
|
|
|
|
|
|
|
|
|
|
|
|
|
|
|
|
|
|
2,500 |
||
300 |
|
|
|
|
|
|
|
|
|
|
|
|
|
|
|
|
|
|
|
2,000 |
||
|
|
|
|
|
|
|
|
|
|
|
|
|
|
|
|
|
|
|
|
|||
200 |
|
|
|
|
|
|
|
|
|
|
|
|
|
|
|
|
|
|
|
1,500 |
||
100 |
|
|
|
|
|
|
|
|
|
|
|
|
|
|
|
|
|
|
|
1,000 |
||
|
|
|
|
|
|
|
|
|
|
|
|
|
|
|
|
|
|
|
|
|
||
|
|
|
|
|
|
|
|
|
|
|
|
|
|
|
|
|
|
|
|
500 |
|
|
|
|
|
|
|
|
|
|
|
|
|
|
|
|
|
|
|
|
|
|
|
|
|
|
0 |
|
|
|
|
|
|
|
|
|
|
|
|
|
|
|
|
|
|
|
0 |
|
|
1994: I |
1994: II |
1994: III 1994: IV 1995: I 1995: II 1995: III 1995: IV 1996: I |
1996: II 1996: III 1996: IV 1997: I |
1997: II |
1997: III |
1997: IV 1998: I |
1998: II |
1998: III |
1998: IV |
1999: I |
1999: II |
1999: III |
1999: IV |
2000: I |
2000: II |
2000: III |
2000: IV |
2001: I |
2001: II |
2001: III |
|
|
|
|
|
|
|
Quarter |
|
|
|
|
|
|
|
|
|
|
|
|
|
|
|
|
F I G U R E 7 . 7 |
The Tech Boom |
|
|
|
|
|
|
|
|
|
|
|
|
|
|
|
|
|
|
|||
Source: Raw data from Bloomberg. |
|
|
|
|
|
|
|
|
|
|
|
|
|
|
|
|
|
|
||||
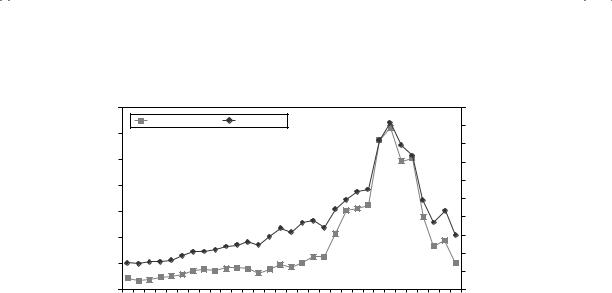
notwithstanding technological improvements and more liquidity, still shared a great deal with their counterparts in the 1600s. In the 1990s, we witnessed another in this cycle of market bubbles in the dramatic rise and fall of the dot-com sector. New technology companies with limited revenues and large operating losses went public at staggering prices (given their fundamentals) and their stock prices kept increasing. After peaking with a market value of $1.4 trillion in early 2000, this market, too, ran out of steam and lost almost all of this value in the subsequent year or two. Figure 7.7 summarizes the Internet index and the NASDAQ from 1994 to 2001.
The chart again has the makings of a bubble, as the value of the Internet index increased almost tenfold over the period, pulling the tech-heavy NASDAQ up with it.
R a t i o n a l B u b b l e s ? A rational bubble sounds like an oxymoron, but it is well within the realms of possibility. Perhaps the simplest way to think of a rational bubble is to consider a series of coin tosses, with a head indicating a plus day and a tail a minus day. You would conceivably get a series of plus days pushing the stock price above the fair value, and the eventual correction is nothing more than a reversion back to a reasonable value. Note too that it is difficult to tell a bubble from a blunder. Investors in making their assessments for the future can make mistakes in pricing individual assets, either because they have poor information or because the actual outcomes (in terms of growth and returns) do not match expected values. If this is the
226 |
INVESTMENT PHILOSOPHIES |
|||
|
700 |
|
14.00% |
|
|
600 |
Gold price |
12.00% |
|
|
Inflation rate |
|
||
|
500 |
|
10.00% |
|
Gold Price |
400 |
|
8.00% |
Inflation Rate |
300 |
|
6.00% |
||
|
|
|
||
|
200 |
|
4.00% |
|
|
100 |
|
2.00% |
|
|
0 |
|
0.00% |
|
|
1970 1971 1972 1973 1974 1975 1976 1977 1978 1979 1980 1981 1982 1983 1984 1985 1986 |
|
|
|
|
|
Year |
|
|
F I G U R E 7 . 8 |
Gold Prices from 1970 to 1986 |
|
|
|
Source: Raw data from Bloomberg. |
|
|
||
case, you would expect to see a surge in prices followed by an adjustment to a fair value. In fact, consider what happened to gold prices in the late 1970s. As inflation increased, many investors assumed (incorrectly in hindsight) that high inflation was here to stay, and they pushed gold prices up accordingly. Figure 7.8, which graphs gold prices from 1970 to 1986, looks very much like a classic bubble, but may just indicate our tendencies to look at things in the rearview mirror after they happen.
The surge in gold prices closely followed the increase in inflation in the late 1970s, reflecting gold’s value as a hedge against inflation. As inflation declined in the 1980s, gold prices followed. It is an open question, therefore, whether this should be even considered a bubble.
B u b b l e o r B l u n d e r : T e s t s There are some researchers who argue that you can separate bubbles from blunders by looking at how prices build up over time. Santoni and Dwyer, for instance, argue that you need two elements for a bubble: positive serial correlation in returns and a delinking of prices and fundamentals as the bubble forms.21 They tested the periods prior to the 1929 and 1987 crashes to examine whether there is evidence of bubbles forming in those periods. Based on their analysis, there is no evidence of
21G. J. Santoni and G. P. Dwyer, “Bubbles or Fundamentals: New Evidence from the Great Bull Markets,” in Crashes and Panics: The Lessons of History, ed. Eugene N. White (New York: Dow Jones Irwin/McGraw-Hill, 1990).

Smoke and Mirrors? Price Patterns, Volume Charts, and Technical Analysis |
227 |
positive serial correlation in returns or of a reduction in the correlation between prices and fundamentals (which they define as dividends) in either period. Therefore, they argue that neither period can be used as an example of a bubble.
While there is truth to the underlying premise, these tests may be too weak to capture bubbles that form over long periods. For instance, Santoni and Dwyer’s conclusion of no serial correlation seems to be sensitive to both the time periods examined and the return interval used. In addition, detecting a delinking of prices and fundamentals statistically may be difficult to do if it happens gradually over time. In short, these may be useful indicators but they are not conclusive.
B u b b l e s : F r o m I n c e p t i o n t o C r a s h One or the more fascinating questions in economics examines how and why bubbles form and what precipitates their bursting. Though each bubble has its own characteristics, there seem to be four phases to every bubble.
Phase 1: The Birth of the Bubble Most bubbles have their genesis in a kernel of truth. In other words, at the heart of most bubbles is a perfectly sensible story. Consider, for instance, the dot-com bubble. At its center was a reasonable argument that as more and more individuals and businesses gained online access, they would also be buying more goods and services online. The bubble builds as the market provides positive reinforcement to some investors and businesses for irrational or ill-thought-out actions. Using the dot-com phenomenon again, you could point to the numerous start-up companies with half-baked ideas for e-commerce that were able to go public with untenable market capitalizations and the investors who made profits along the way.
A critical component of bubbles building is the propagation of the news of the success to other investors in the market, who on hearing the news also try to partake in the bubble. In the process, they push prices up and provide even more success stories that can be used to attract more investors, thus providing the basis for a self-fulfilling prophecy. In the days of the tulip bulb craze, this would have had to be word of mouth, as successful investors spread the word, with the success being exaggerated in each retelling of the story. Even in this century, until very recently, the news of the success would have reached investors through newspapers, financial newsmagazines, and the occasional business show on television. In the dot-com bubble, we saw two additional phenomena that allowed news and rumors to spread even more quickly. The first was the Internet itself, where chat rooms and websites allowed investors to tell their success stories (or make them up as they went along). The second was the creation of cable stations such as CNBC,

228 |
INVESTMENT PHILOSOPHIES |
where analysts and money managers could present their views to millions of investors.
Phase 2: The Sustenance of the Bubble Once a bubble forms, it needs sustenance. Part of the sustenance is provided by the institutional parasites that make money of the bubble and develop vested interests in preserving and expanding the bubbles. Among these parasites, you could include:
Investment banks. Bubbles in financial markets bring with them a number of benefits to investment banks, starting with a surge in initial public offerings of firms but expanding to include further security issues and restructurings on the part of established firms that do not want to be shut out of the party.
Brokers and analysts. A bubble generates opportunities for brokers and analysts selling assets related to the bubble. In fact, the ease with which investors make money as asset prices go up, often with no substantial reason, relegates analysis to the back burner.
Portfolio managers. As a bubble forms, portfolio managers initially watch in disdain as investors they view as naive push asset prices up. At some point, though, even the most prudent portfolio managers seem to get caught up in the craze and partake of the bubble, partly out of greed and partly out of fear.
Media. Bubbles make for exciting business news and avid investors. While this is especially noticeable in the dot-com bubble, with new books, television shows, and magazines directly aimed at investors in these stocks, even the earliest bubbles had their own versions of CNBC.
In addition to the institutional support that is provided for bubbles to grow, intellectual support is usually also forthcoming. There are both academics and practitioners who argue, when confronted with evidence of overpricing, that the old rules no longer apply. New paradigms are presented justifying the high prices, and those who disagree are disparaged as oldfashioned and out of step with reality.
Phase 3: The Bursting of the Bubble All bubbles eventually burst, though there seems to be no single precipitating event that causes the reassessment. Instead, there is a confluence of factors that seem to lead to the price implosion. The first is that bubbles need ever more new investors (or at least new investment money) flowing in for sustenance. At some point, you run out of suckers as the investors who are the best targets for the sales pitch become fully invested. The second is that each new entrant into the bubble is more outrageous than the previous one. Consider, for instance, the dot-com

Smoke and Mirrors? Price Patterns, Volume Charts, and Technical Analysis |
229 |
bubble. While the initial entrants like America Online and Amazon.com might have had a possibility of reaching their stated goals, the new dot-com companies that were listed in the late 1990s were often idea companies with no vision of how to generate commercial success. As these new firms flood the market, even those who are apologists for high prices find themselves exhausted trying to explain the unexplainable.
The first hint of doubt among the true believers turns quickly to panic as reality sets in. Well-devised exit strategies break down as everyone heads for the exit doors at the same time. The same forces that created the bubble cause its demise, and the speed and magnitude of the crash mirror the formation of the bubble in the first place.
Phase 4: The Aftermath In the aftermath of the bursting of the bubble, you initially find investors in complete denial. In fact, one of the amazing features of postbubble markets is the difficulty of finding investors who lost money in the bubble. Investors claim either that they were one of the prudent ones who never invested in the bubble in the first place or that they were one of the smart ones who saw the correction coming and got out in time.
As time passes and the investment losses from the bursting of the bubble become too large to ignore, the search for scapegoats begins. Investors point fingers at brokers, investment banks, and the experts who nurtured the bubble, arguing that they were misled.
Finally, investors draw lessons that they swear they will adhere to from this point on. “I will never invest in a tulip bulb again” or “I will never invest in a dot-com company again” becomes the refrain you hear. Given these resolutions, you may wonder why price bubbles show up over and over. The reason is simple: no two bubbles look alike. Thus investors, wary about repeating past mistakes, make new ones, which in turn create new bubbles in new asset classes.
U p s i d e v e r s u s D o w n s i d e B u b b l e s Note that most investors think of bubbles in terms of asset prices rising well above fair value and then crashing. In fact, all of the bubbles we have referenced from the tulip bulb craze to the dot-com phenomenon were upside bubbles. But can asset prices fall well below fair market value and keep falling? In other words, can you have bubbles on the downside? In theory, there is no reason why you could not, and this makes the relative scarcity of downside bubbles, at least in the popular literature, surprising. One reason may be that investors are more likely to blame external forces—the bubble, for instance—for the money they lose when they buy assets at the peak of an upside bubble and are more likely to claim the returns they make when they buy stocks when they are at the bottom of a downside bubble as evidence of their investment prowess.