

aswath_damodaran-investment_philosophies_2012
.pdf150 |
INVESTMENT PHILOSOPHIES |
Be prepared prior to trading on ways to control liquidity and splits between manual and electronic trading. This pretrade analysis will allow traders to identify the least costly and most efficient way to make a trade.
After the trade has been executed, do a posttrade analysis, where the details of the trade are provided in addition to a market impact analysis, which lists, among other information, the benchmarks that can be used to estimate the price impact, including the midpoint of the bid-ask spread before the trade and the previous day’s close. These posttrade analyses can then be aggregated across types of trades, securities, and markets to give portfolio managers a measure of where their costs are greatest and how to control them.
Step 4: Stay with a portfolio size that is consistent with the investment philosophy and trading strategy that you have chosen.
While it is tempting to most portfolio managers to view portfolio growth as a positive, there is a danger that arises from allowing portfolios to become too big. How big is too big? It depends on both the portfolio strategy that has been chosen and the trading costs associated with that strategy. While a long-term value investor who focuses well-known, large-capitalization stocks might be able to allow the portfolio to increase to almost any size, an investor in small-cap, high-growth stocks or emerging market stocks may not have the same luxury, because of the trading costs we have enumerated in the earlier sections.
Step 5: Consider whether your investment strategy is yielding returns that exceed the costs.
The ultimate test of an investment strategy lies in whether it earns excess returns after transaction costs. Once an investor has gone through the first four steps, the moment of truth always arrives when the performance of the portfolio is evaluated. If a strategy consistently delivers returns that are lower than the costs associated with implementing the strategy, the investor can switch to a passive investing approach (such as an index fund) or to a different active investing strategy with higher expected returns or lower trading costs (or both).
T A X E S
As has often been said, the only two things that are certain in life are death and taxes. Though investors may get a chance to pause and admire the
Many a Slip: Trading, Execution, and Taxes |
151 |
pretax returns they make on their investment portfolios, they can spend only the returns that they have left after taxes. Strategies that yield attractive pretax returns can generate substandard after-tax returns. There are two reasons why taxes are ignored by both researchers looking at investment strategies and portfolio managers who put these strategies into practice. The first is that taxes affect different investors differently, ranging from no impact on tax-exempt investors such as pension funds to very large effects on wealthier individual investors. The second is that the complexity of the tax laws is such that the same investor may face different tax rates on different parts of his or her income (dividends versus capital gains) and different portions of his or her portfolio (pension fund versus savings).
I n v e s t m e n t R e t u r n s a n d T a x e s
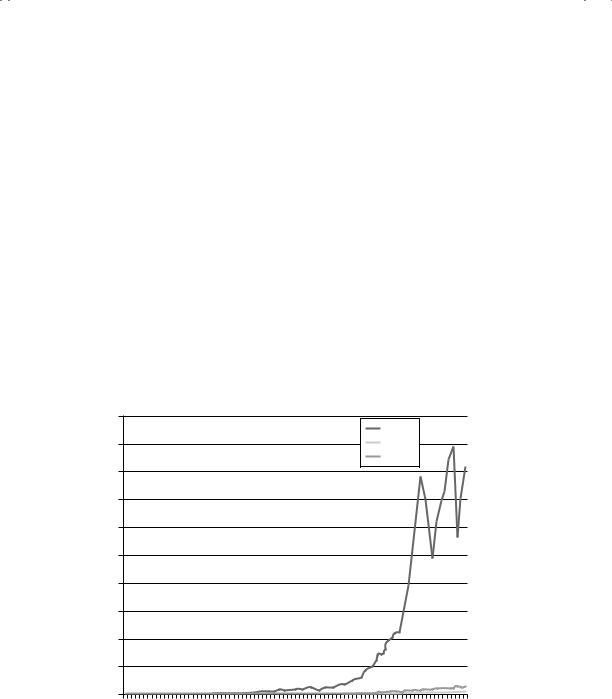
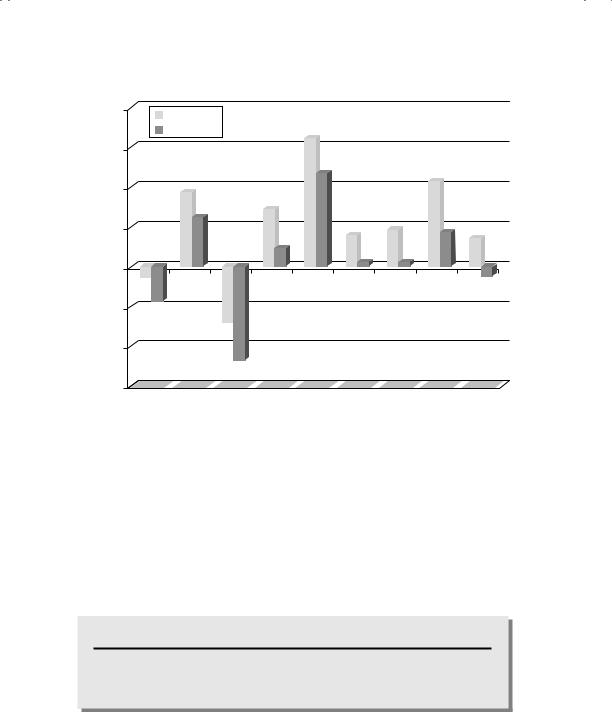
How big of a drag are taxes on investment returns? Studies that look at returns on the U.S. stock market and government bonds show that stocks have generated much higher returns and ending values for investors than Treasury bills or bonds have. Figure 5.5 presents the ending value of $100
$200,000 |
|
|
|
|
|
|
|
|
|
|
|
|
|
|
|
|
|
|
|
|
|
|
|
|
|
|
|
|
|
|
|
|
|
|
|
|
|
|
|
|
|
|
|
|
|
|
|
|
|
|
|
|
|
|
Stocks |
|
|
|
|
||
$180,000 |
|
|
|
|
|
|
|
|
|
|
|
|
|
|
|
|
|
|
|
|
|
|
|
T-Bills |
|
|
|
|
||
|
|
|
|
|
|
|
|
|
|
|
|
|
|
|
|
|
|
|
|
|
|
|
|
T-Bonds |
|
|
$163,388 |
|||
|
|
|
|
|
|
|
|
|
|
|
|
|
|
|
|
|
|
|
|
|
|
|
|
|
|
|
|
|
|
|
$160,000 |
|
|
|
|
|
|
|
|
|
|
|
|
|
|
|
|
|
|
|
|
|
|
|
|
|
|
|
|
|
|
$140,000 |
|
|
|
|
|
|
|
|
|
|
|
|
|
|
|
|
|
|
|
|
|
|
|
|
|
|
|
|
|
|
$120,000 |
|
|
|
|
|
|
|
|
|
|
|
|
|
|
|
|
|
|
|
|
|
|
|
|
|
|
|
|
|
|
$100,000 |
|
|
|
|
|
|
|
|
|
|
|
|
|
|
|
|
|
|
|
|
|
|
|
|
|
|
|
|
|
|
$80,000 |
|
|
|
|
|
|
|
|
|
|
|
|
|
|
|
|
|
|
|
|
|
|
|
|
|
|
|
|
|
|
$60,000 |
|
|
|
|
|
|
|
|
|
|
|
|
|
|
|
|
|
|
|
|
|
|
|
|
|
|
|
|
|
|
$40,000 |
|
|
|
|
|
|
|
|
|
|
|
|
|
|
|
|
|
|
|
|
|
|
|
|
|
|
|
|
|
|
$20,000 |
|
|
|
|
|
|
|
|
|
|
|
|
|
|
|
|
|
|
|
|
|
|
|
|
|
|
|
|
|
$5,797 |
|
|
|
|
|
|
|
|
|
|
|
|
|
|
|
|
|
|
|
|
|
|
|
|
|
|
|
|
|
|
|
$0 |
|
|
|
|
|
|
|
|
|
|
|
|
|
|
|
|
|
|
|
|
|
|
|
|
|
|
|
|
|
$1,970 |
942 |
|
5 |
48 |
54 |
63 |
9 |
72 |
|
5 |
81 |
4 |
87 |
0 |
3 |
996 |
9 |
02 |
|||||||||||||
94 |
19 |
195119 |
1957196019 |
1966196 |
9 |
|
97 |
197819 |
19 |
19 |
199 19 |
|
|
|
20052008 |
|||||||||||||||
192719301933193619391 |
1 |
|
1 |
|
1 |
|
1 |
199 20 |
||||||||||||||||||||||
|
|
|
|
|
|
|
|
|
|
|
Year |
|
|
|
|
|
|
|
|
|
|
|
|
|
|
|
|
|
|
|
F I G U R E 5 . 5 Value of $100 Invested at the End of 1927: Stocks, Bonds, and Bills Source: S&P, Federal Reserve.
152 |
INVESTMENT PHILOSOPHIES |
$200,000
Compounded Value before Taxes
$180,000
Compounded Value after Taxes
$163,388
$160,000
$140,000
$120,000
$100,000
$80,000
$60,000
$40,000
$31,556
$20,000
$0
1928 |
1931 |
1934 |
1937 |
1940 |
1943 |
1946 |
1949 |
1952 |
1955 |
1958 |
1961 |
1964 |
1967 |
1970 |
1973 |
1976 |
1979 |
1982 |
1985 |
1988 |
1991 |
199 |
4 |
199 |
7 |
2000 |
2003 |
2006 |
200 |
9 |
|
|
|
|
|
|
|
|
|
|
|
|
|
|
|
|
|
|
|
|
|
|
|
|
|
|
|
|
Year
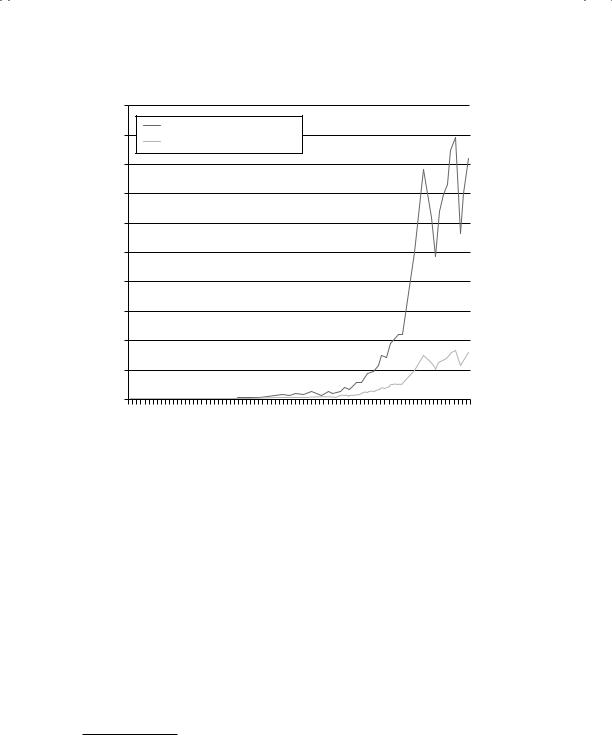
F I G U R E 5 . 6 Value of $100 Invested in U.S. Stocks at the End of 1927: Before and After Taxes
Source: Federal Reserve.
invested in stocks, Treasury bonds, and Treasury bills in 1928 and held through the end of 2010.
Thus, $100 invested in stocks would have grown to $163,388, significantly higher than what your portfolio would have been worth if invested in T-bills ($1,970) or T-bonds ($5,797). This is impressive, but it is also before taxes and transaction costs. Let us for the moment consider the effects of taxes on these returns. Assume that the investor buying these stocks is faced a tax rate of 35 percent on dividends and 20 percent on capital gains over this period.25 To compute the effect of taxes on returns, we do have to consider how often this investor trades. If we assume that he turns over his entire portfolio at the end of each year, he would have to pay taxes on both dividends and the price appreciation each year. Figure 5.6 shows the
25Note that the actual tax rates on dividends and capital gains varied widely over this period and were much higher than these values from 1950 to 1980.

Many a Slip: Trading, Execution, and Taxes |
153 |
effect on the portfolio value over the period and the effect of taxes on the ending portfolio.
Note that introducing taxes into returns reduces the ending value of the portfolio, assuming you invested $100 in 1927, by more than two-thirds from $163,388 to $31,556.
But what if this investor, instead of turning over the entire portfolio once every year, had turned it over once every two years (or three or five)? Trading less often does not reduce the tax bite from dividends but it does allow investors to delay paying capital gains taxes, thus increasing the ending portfolio value. This insight about the relationship between taxes and trading frequency is a key one. Since much of the return when investing in stocks comes from price appreciation, the more frequently you trade, the higher your tax bill is likely to be for any given pretax return. In fact, the effect is likely to be exacerbated by the higher tax rates on short-term capital gains (which have been generally similar to ordinary tax rates) than on long-term capital gains.
N U M B E R W A T C H
Historical stock returns with taxes: See the annual returns with and without taxes for U.S. stocks.
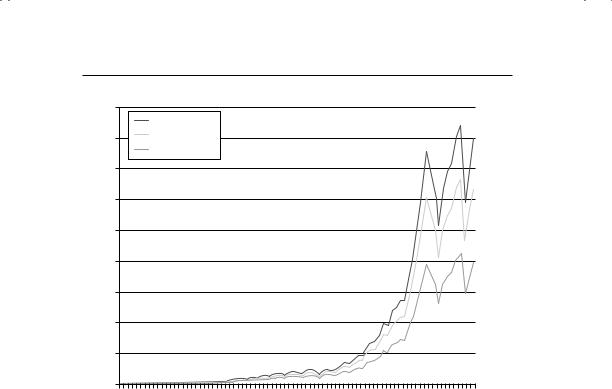
There is one final point to be made about the tax effect. Although the taxes on capital gains can be deferred by not trading on your winners, the taxes on dividends have to be paid each period that you receive dividends. Thus, a strategy of investing in stocks that have higher dividend yields than average will result in more taxes and less flexibility when it comes to tax timing, at least relative to investing in low-dividend-yield stocks for the long term. We illustrate this in Figure 5.7 for an investor by contrasting the performance of a portfolio with a dividend yield half that of the market each year to one with twice the dividend yield, keeping the total returns constant.26
26To provide an example, the average dividend yield across all stocks in 1996 was 3.20 percent and the total return was 23.82 percent. The half dividend yield portfolio was estimated to have a dividend yield of 1.60 percent and a price appreciation of 22.22 percent for a total return of 23.82 percent. The double dividend yield portfolio had a dividend yield of 6.40 percent and a price appreciation of 17.42 percent for a total return of 23.82 percent.
154 |
INVESTMENT PHILOSOPHIES |
|||
$45,000 |
|
|
|
|
|
Low Dividends |
|
|
|
$40,000 |
Actual Dividends |
|
|
$39,879 |
|
High Dividends |
|
|
|
|
|
|
|
|
$35,000 |
|
|
|
|
$30,000 |
|
|
|
$31,556 |
$25,000 |
|
|
|
|
$20,000 |
|
|
|
|
$15,000 |
|
|
|
$19,714 |
|
|
|
|
|
$10,000 |
|
|
|
|
$5,000 |
|
|
|
|
$0 |
|
|
|
|
|
7 |
6 |
||
19281931193419371940194319461949195219551958196119641967197019731976197919821985198819911994199 |
20002003200 |
2009 |
||
|
Year |
|
|
|
F I G U R E 5 . 7 Dividend Yields and After-Tax Returns: U.S. Stocks Source: Federal Reserve.
Note that the portfolio of stocks with half the dividend yield of the market has an ending value of just under $40,000 in 2010, whereas one with a dividend yield twice that of the market has an ending value of roughly half that amount.
T h e T a x D r a g o n R e t u r n s
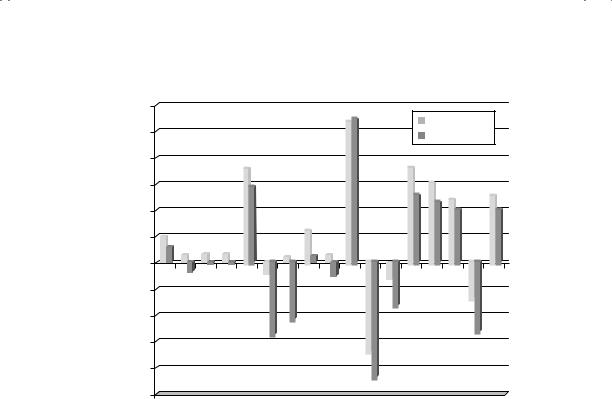
How well do investors manage their tax liabilities? All too often, investment performance has been measured in terms of pretax returns. The rankings of mutual funds done by services such as Morningstar and Forbes have been based on pretax returns. Until recently, the promotional material for most funds presented the pretax returns of these funds contrasted with the S&P 500. This focus on pretax returns may be explained by the fact that different investors have very different tax profiles and it is difficult to find a typical investor, but it has also had the undesirable side effect. Money managers often adopt strategies that expose their investors to substantial tax bills because they feel that they will not be penalized for this tax exposure. Figure 5.8 presents the pretax and after-tax annual returns over the most
Many a Slip: Trading, Execution, and Taxes |
155 |
6.00% |
|
|
Pretax Return |
5.00% |
After-Tax Return |
|
|
4.00% |
|
3.00% |
|
2.00% |
|
1.00% |
|
0.00% |
|
–1.00% |
|
–2.00% |
|
–3.00% |
|
–4.00% |
|
–5.00% |
|
|
|
|
Market Growth |
|
|
|
|
|
x |
|
|
Co |
|
|
|
|
500 |
Growthx |
|
ock |
|
|
|
II |
|
|
mecapMidcap |
|
Growth |
||||||||||||||
|
|
|
|
|
|
|
|
|
|
|
|
|
|
|
|
|
|
|
|
|
|
|
|
||||||||||||||||||||
|
|
|
|
|
|
|
Cont |
|
InvmtWashingtondam |
|
|
|
dW |
|
|
iced |
|
|
ce |
||||||||||||||||||||||||
|
|
|
|
|
|
ex |
Admiral |
|
|
|
|
tan |
|
|
|
Co |
|
|
|
Pri |
|
|
|
NY |
|
|
|||||||||||||||||
|
|
Stock |
|
|
|
|
|
|
utional |
Inde |
rafund |
|
|
ental |
|
|
|
|
|
St |
|
|
sor |
|
Stock |
|
|
|
|
|
|
|
|
||||||||||
|
|
|
Funds Ind |
|
|
|
|
|
|
|
|
|
Fun |
Spar |
|
etity |
|
& |
|
|
|
|
-Pr |
|
|
VanguardD |
|
|
|
e |
Pri |
|
|||||||||||
|
Total |
|
|
|
|
|
lity |
|
|
|
Funds unds |
|
Fid |
|
|
|
|
|
|
w |
|
|
|
|
|
|
|
|
|
||||||||||||||
|
|
|
|
500 |
|
Instit Fide |
|
|
|
|
|
|
|
|
|
|
|
|
|
|
Lo |
|
|
|
|
|
|
|
|
|
|
|
|||||||||||
|
|
|
|
|
|
|
|
|
|
|
|
|
|
Funds |
|
F |
Fidetity |
|
|
|
|
Vanguar |
|
|
|
Vanguard |
|
|
avis |
|
|
|
|
||||||||||
|
|
|
|
|
|
|
|
|
|
|
|
|
|
|
|
|
|
|
|
|
|
|
|
|
|
|
|
. |
|
|
|
|
|||||||||||
|
American |
Vanguard |
|
|
|
American |
|
|
|
|
|
|
|
|
Dodge |
|
|
|
|
|
|
|
|
|
|
|
|
|
|
Row |
|
|
|||||||||||
|
|
|
|
|
|
|
|
|
|
|
|
|
|
|
Fi |
|
|
|
|
|
|
|
|
|
|
|
|
|
|
|
|
|
|||||||||||
|
|
|
|
|
|
|
|
|
|
|
|
|
|
|
|
|
|
|
|
|
|
|
|
tity |
|
|
|
|
|
|
|
|
|
|
T |
|
|
|
|
|
|||
Vanguard |
Vanguard |
|
|
|
|
|
|
American |
|
|
|
|
|
|
|
|
|
|
|
|
|
|
|
|
|
|
|
|
|
|
|
|
|||||||||||
|
|
|
|
|
|
|
|
|
|
|
|
|
|
|
|
|
|
|
|
|
|
|
|
|
|
|
|
|
|
|
|
|
|||||||||||
|
|
|
|
|
|
|
|
|
|
|
|
|
|
|
American |
|
|
|
|
|
|
|
|
de |
|
|
|
|
|
|
|
|
|
|
|
|
|
|
|
|
|
||
|
|
|
|
|
|
|
|
|
|
|
|
|
|
|
|
|
|
|
|
|
|
|
|
|
|
|
|
|
|
|
|
|
|
|
|
|
|
|
|
|
|
|
|
F I G U R E 5 . 8 Largest U.S. Equity Mutual Funds: Pretax versus Posttax Returns—Five-Year Average
Source: Morningstar.
recent five-year period for some of the largest equity mutual funds in the United States in November 2011.
The after-tax returns are significantly lower than the pretax returns for all except one of the funds. Quirks in how and when mutual funds claim capital gains and losses explain the unusual phenomenon of after-tax returns exceeding pre-tax returns for Fidelity Growth.
There are encouraging signs for investors concerned about taxes. The first is that the SEC has started requiring mutual funds to report their aftertax returns in conjunction with pretax returns in their promotional material. The second is that the mutual fund families have begun offering tax-efficient funds, where the objective is to maximize after-tax rather than pretax returns. The third is that the performance evaluators, such as Morningstar, have woken up to the tax costs being imposed on investors by mutual funds.
156 |
INVESTMENT PHILOSOPHIES |
4.00%
Before Taxes
After Taxes
3.00% |
|
|
|
|
|
|
|
2.00% |
|
|
|
|
|
|
|
1.00% |
|
|
|
|
|
|
|
Large Blend |
Large Value |
|
|
|
|
|
|
0.00% |
|
|
|
|
|
|
|
|
Large |
Mid-Cap |
Mid-Cap |
Mid-Cap |
Small |
Small |
Small |
|
Growth |
Blend |
Growth |
Value |
Blend |
Growth |
|
|
Value |
||||||
|
|
|
|
|
|
|
|
–1.00% |
|
|
|
|
|
|
|
–2.00% |
|
|
|
|
|
|
|
–3.00% |
|
|
|
|
|
|
|
F I G U R E 5 . 9 |
Mutual Funds’ Annual Returns Before and After Taxes, 2006–2010 |
||||||
Source: Morningstar.
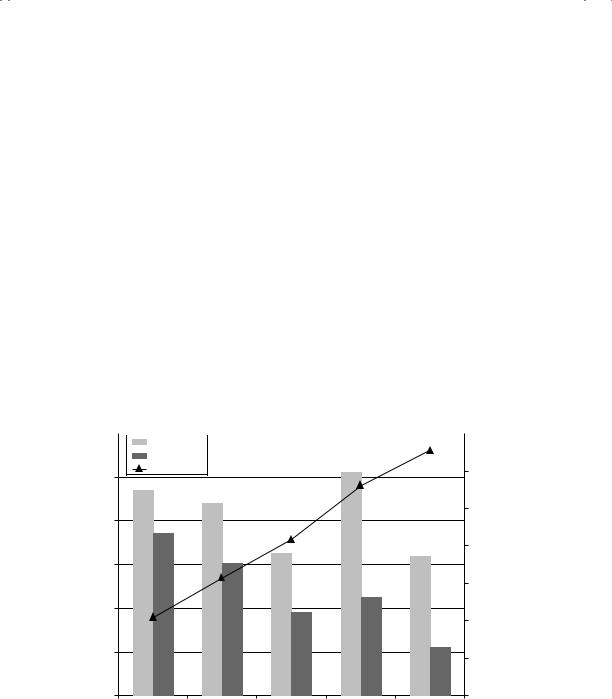
In fact, the latest Morningstar reports on mutual funds report not only the after-tax returns over the prior few years on these funds but also a measure of tax efficiency for each fund obtained by dividing the after-tax return by the pretax return. A fund that generates a pretax return on 9 percent and an after-tax return on 6 percent will therefore have a tax efficiency ratio of 67 percent (6 divided by 9). The final noteworthy feature is that not all mutual fund styles are equally affected by taxes. Figure 5.9 reports pretax and after-tax returns in the most recent five-year period for equity mutual funds in the United States in November 2011, categorized by style.
N U M B E R W A T C H
Mutual fund tax efficiency: See the average pretax and after-tax returns for mutual funds, broken down into categories.
As you can see from the graph, there are significant differences between pretax and after-tax returns at many funds, and the tax drag on returns cuts
Many a Slip: Trading, Execution, and Taxes |
157 |
across all fund styles. While there are some funds that are tax-efficient, there are others where the after-tax return is less than 60 percent of the pretax return. What are the factors that cause the tax effect to be different? It is a function of a number of variables:
Higher turnover ratios (and more active trading) seem to give rise to higher tax costs for investors. After all, capital gains taxes are assessed only when you sell stocks. In fact, Figure 5.10 categorizes mutual funds (both bond and equity) into six classes based on turnover ratios and reports on the difference between pretax and after-tax returns in each class.
We measure the tax effect in each category by looking at the ratio of after-tax to pretax returns. Thus, the firms with turnover ratios that exceed 70 percent are the most tax inefficient, since the after-tax returns are only about one-third of the pretax returns. In fact, the pattern is consistent, with the tax effect generally becoming larger as the turnover ratios increase.
The after-tax return is also affected by money flowing into the fund (inflows) and out of the fund (redemptions). Why might that be?
3.00% |
|
|
|
70.00% |
|
|
|
||
|
|
|
Before Taxes
After Taxes
Tax Effect |
|
|
|
60.00% |
2.50% |
|
|
|
|
|
|
|
|
50.00% |
2.00% |
|
|
|
|
|
|
|
|
40.00% |
1.50% |
|
|
|
|
|
|
|
|
30.00% |
1.00% |
|
|
|
|
|
|
|
|
20.00% |
0.50% |
|
|
|
10.00% |
|
|
|
|
|
0.00% |
|
|
|
0.00% |
<15% |
15–30% |
30–50% |
50–70% |
>70% |
F I G U R E 5 . 1 0 Turnover Ratios and Tax Effect: Annual Returns on U.S. Mutual Funds over Most Recent Five Years
Source: Morningstar.

158 |
INVESTMENT PHILOSOPHIES |
Redemptions may require a fund to sell holdings to raise cash and, in the process, convert paper gains into taxable capital gains.
The tax cost will also vary depending on whether the mutual fund is actively trying to manage the cost. For instance, a fund that wants to minimize tax costs will sell a few losers when it sells winners and offset the capital losses on the former against the capital gains on the latter.
T a x M a n a g e m e n t S t r a t e g i e s
Tax considerations alone should not determine any investor’s portfolio, but they clearly have to be a factor in how portfolios are put together and the type of investment strategies adopted. In this section, we consider ways in which investors may be able to reduce how much they lose because of taxes.
M i n i m a l T u r n o v e r The simplest and most effective way to reduce your taxes is to trade less often. As noted in the prior sections, portfolio turnover is a key determinant of tax costs. While you may not be able to reduce your turnover ratios to those of an index fund (which often has a turnover ratio of 5 percent or less), you can still try to minimize trading, given any strategy that you adopt. In addition, your choice of strategy should be influenced by the amount of trading that goes with it. Does this mean that you should avoid strategies that require a lot of trading? Not necessarily. If you can earn a high enough return to cover the additional taxes you have to pay, you may still choose to go with a high-trading strategy.
T a x - B a s e d T r a d i n g The other way to minimize taxes is to consider trades specifically for the purpose of reducing your tax bill. There are several forms of tax-based trading.
In its simplest form, you may sell stocks in your portfolio that have gone down just before a tax year ends and use the capital losses from the sale to offset capital gains on other stocks that you may have sold during the year.
If your tax status varies over time, you may choose to claim your capital gains in a year in which your tax rate is low and claim your capital losses in a year in which your tax rate is high.
In its most dangerous form, you may make investments specifically because they offer a chance to reduce your tax bill. Although such tax shelters have long been utilized by investors, you should recognize that the tax authorities usually require these entities to have an economic purpose that goes beyond tax reduction. All too often, investors are beguiled by promised tax savings in tax shelters that are never delivered.

Many a Slip: Trading, Execution, and Taxes |
159 |
In theory, while tax-based trading offers promise, investors have to keep it in perspective. In particular, trading purely for the purpose of reducing your tax bills strikes us as more likely to reduce than increase returns. However, augmenting a sensible trading strategy with tax considerations makes sense. Thus, if you were planning to prune and rebalance your portfolio, you should probably do it before the end of the tax year and consider the effect of these trades on your tax bill. If you are trying to decide between selling two stocks in your portfolio, the fact that one of them could reduce taxes paid by $100,000 should tip the balance.
T a x A r b i t r a g e
The fact that all investors do not face the same tax rates and that each investor may, in fact, be taxed differently on different parts of the portfolio does raise an interesting implication. If your tax rate as an investor is much lower than the tax rates of other investors in the market, you may be able to exploit the difference to earn excess returns. To see why, consider the following scenario. Assume that you are tax exempt and that every other investor in the market faces a 40 percent tax rate on both dividends and capital gains. Let us also assume that these other investors price stocks to earn an after-tax return of 9 percent. On a pretax basis, stocks will have to earn 15 percent. As a tax-exempt investor, you will get to earn the 15 percent pretax return as well, but your after-tax returns will also be 15 percent.
Is tax arbitrage feasible if you are the only taxable investor in a taxexempt universe? You will either have to settle for a lower after-tax return than other investors in the market or not buy stocks at all. In reality, there are both tax-exempt and taxable investors in every market, and tax rates vary widely across taxable investors. The market prices of assets will reflect the relative magnitudes of each group, and there will always be groups of assets that yield more favorable returns for each group. Thus, tax-exempt investors may find their best bargains in stocks that generate the greatest tax liabilities for other investors—high-dividend-paying stocks, for instance. High-tax-rate investors migrate toward stocks where they are penalized the least by their tax status—non-dividend-paying, high-growth stocks would be an example.
C O N C L U S I O N
Trading costs are an integral part of any investment portfolio and can make the difference between a portfolio that beats the market and one that does not. The overall evidence suggests that trading costs impose a significant