

Kluwer - Handbook of Biomedical Image Analysis Vol
.3.pdfInter-Subject Non-Rigid Registration |
309 |
Source image |
Target image |
Registered |
Registered |
with correction |
without correction |
Difference |
Difference |
with correction |
without correction |
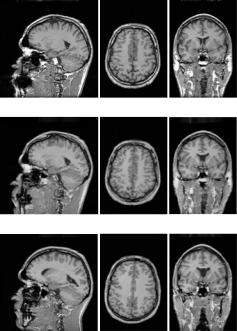
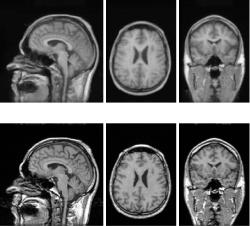
Figure 8.13: Impact of the intensity correction for the non-rigid registration. Top row: the images to be registered. Middle row: The source image is registered toward the target image, without intensity correction (left) and with correction (right). Bottom row: the differences images show the relevance of the intensity correction on the non-rigid registration.
errors: the first one is the registration error which comes from the anatomical variability that we could not apprehend. The second error is due to the difference of acquisition of the two volumes, which makes the histograms of the source and target volumes different.
310 |
Hellier |
Source volume f1
Reconstructed volume f2 (s + wˆ s)
Target volume f2
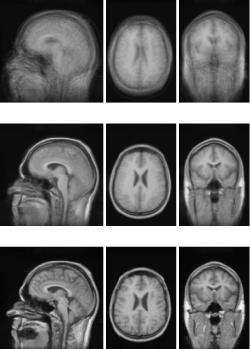
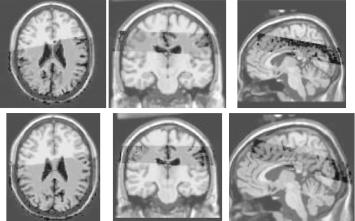
Figure 8.14: Final 3D results of the registration on real data. The volumes are T1-MRI acquisitions of two different subjects. The reconstructed volume is computed by trilinear interpolation with the target volume and the final dense displacement field. In order to evaluate the quality of the registration, we must therefore compare the source volume and the reconstructed volume.
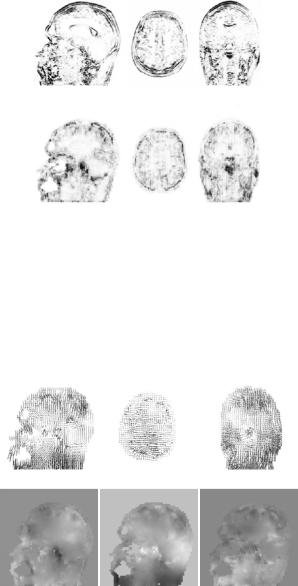
In Fig. 8.16, the outliers are drawn, i.e., the data outliers map (variable δs) and the spatial outlier map (for each point s, we compute the mean of variable βsr with respect to r V(s)). Looking at the data outliers map, the dark points represent areas where the optical flow hypothesis is inadequate, because of occlusions for instance (see the jaw in Fig. 8.16). For these points, the regularization term overwhelms the similarity term. Looking at the spatial outlier term, we observe that dark regions are located in the cortex. At that locations, the importance of the regularization term is reduced, and discontinuities can appear. The fact that discontinuities appear in the cortex is significant because we know that inter-subject variability is very high on the cortex.
Inter-Subject Non-Rigid Registration |
311 |
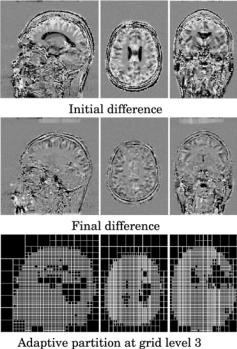
Figure 8.15: Final 3D results of the registration on real data. Top: difference before registration. Middle: difference after registration. Bottom: adaptive partition at grid level 3. The difference volumes must be interpreted carefully, since we get the superposition of two errors: the first one is the registration error which comes from the anatomical variability that we could not apprehend. The second error is due to the difference of acquisition of the two volumes, which makes the two original histograms of the two volumes different.
The 3D deformation field is presented in Fig. 8.17. The vector field is subsampled in order to be easier to look at, and we also show the three components of the field on the sagittal view. Although discontinuities are visible, the general spatial coherence of the final deformation field is visible, due to the regularization. The field also confirms that there is no “block-effect” in the registration process.
The computation takes about 1 : 30 hour on an Ultra Sparc 30 (300 MHz). The volumes are 256 × 256 × 200. We use three levels of resolution (k = 0, 1, 2) because the displacement amplitude may reach 30 voxels, and at each resolution level we perform the registration from grid level 4 until grid level 0.
312 |
Hellier |
Data outliers
Spatial outliers
Figure 8.16: Final 3D results of the registration on real data. Top: data outlier map. Middle: spatial outlier map. Looking at the spatial outlier term, we observe that dark regions are located in the cortex. Dark areas shows that the importance of the regularization term is reduced, and discontinuities can appear. The fact that discontinuities appear in the cortex is significant because we know that inter-subject variability is very high on the cortex.
Deformation field
3 components of the field on the sagittal view
Figure 8.17: Top: deformation field. Bottom: Images of the three components of the field on the sagittal view. The 3D deformation field is subsampled in order to be easier to look at. Although discontinuities are visible, the general spatial coherence of the final deformation field is visible, due to the regularization. The field also confirms that there is no “block-effect” in the registration process.
Inter-Subject Non-Rigid Registration |
313 |
8.3.3.4 Experiments on a Dataset of 18 Subjects
In order to validate the registration method on a larger database, we acquire MRIT1 volumetric data of 18 patients. One subject is chosen as the reference subject. We then perform the registration between the reference volume (source) and each of the other subjects (target) using always the same set of parameters for the algorithm. Finally, we get 17 reconstructed volumes that can be compared to the reference volume. We average all the reconstructed volume in order to have a global overview of the quality of the method.
Average Deformed Volume. Figures 8.18 and 8.19 present the averaging between 17 patients after a global affine registration (top), after a quadratic multigrid registration, i.e., the method without robust estimators (middle), and the average volume after a robust multigrid registration (bottom). After global affine registration and averaging, we notice that the internal anatomical structures are blurred, because the registration is not precise enough. However, after a robust multigrid registration, we may distinguish precisely the contours of anatomical structures, such as ventricles, deep nuclei, white matter tracks, and even cortical regions (sylvian fissure and parietal region for instance).
The comparison between the quadratic registration and the robust registration shows the benefit of robust functions, because cortical regions are better registered. The MSE between the reference volume and the averaged volume is 892 for quadratic registration, and drops to 584 for robust registration. We must note that, considering two subjects, the MSE is not a good absolute measure of the quality of the registration because of the acquisition (a simple translation between the two histogram can lead to large MSE). However, the MSE is a good relative measure to compare two registration processes over a large database.
These experiments clearly show the significant impact of robust estimators. All the more, it validates the assumption that it is necessary to let discontinuities appear in the deformation field to register brains correctly. These experiments also demonstrate the robustness of the method (robustness with respect to the acquisitions and also with respect to the algorithm parameters) over a realistic database of subjects.
Overlapping of Brain Tissues. The evaluation must not be based only on a measure that is more or less related to the image similarity. Therefore, as in
314 |
Hellier |
Global affine registration
Quadratic multigrid registration
Robust multigrid registration
Figure 8.18: Results of experiments on a database of 18 subjects. One subject was chosen as the reference subject (see Fig. 8.19), and we averaged all the reconstructed volumes after global affine registration (top), after quadratic multigrid registration (middle) and after robust multigrid registration (bottom). We kept the same set of parameters for all the subjects. This demonstrates the robustness of the method, and the importance of robust estimators (the quadratic registration is less accurate on the cortex).
section 8.3.3, we evaluate in this section the registration process by computing the overlap between the tissues (gray matter and white matter) of the reference volumes and the tissues of each studied volume after registration. We measure the overlap with the total performance, which has already been presented in section 8.3.3.
The extraction of gray matter and white matter is performed using a technique presented in [85]. It consists in a 3D texture analysis to compute statistical attributes of each voxel. A clustering procedure is used to find the initial discrimination of the data, and a bayesian relaxation refines the primary decision.
Inter-Subject Non-Rigid Registration |
315 |
Robust multigrid registration
Reference subject
Figure 8.19: Results of experiments on a database of 18 subjects. One subject was chosen as the reference subject (bottom), and we averaged all the reconstructed volumes after robust multigrid registration (top). We kept the same set of parameters for all the subjects, which demonstrates the robustness of the method. Results of the averaging after registration show the accuracy of the registration (after averaging we can distinguish precisely anatomical structures such as ventricles, deep nuclei, white matter tracks and even cortical regions).
For gray matter tissue, the average overlap after registration is 93.9% (mean of total performance). For white matter, the average overlap is 94.9%. If we perform a rigid registration by maximization of mutual information, we obtain 88.3% and 87.1% of average overlap, for gray matter and white matter, respectively. These measures must be interpreted carefully for two reasons. We use binary classes (and not fuzzy classes) and a simple trilinear interpolation scheme, which may introduce some error. Furthermore, the classification algorithm introduces errors that disturb the overlapping measure. In the last 5% to recover, it is difficult to distinguish what is due to the registration process and what is due to interpolation and segmentation errors. However, these overlapping measures show the benefit of non-rigid registration.
8.3.3.5 Experiments on Multimodal Datasets
The extension of Romeo to multimodal dataset was motivated by a particular problem: the correction of distortions in echo-planar images. Among the

316 |
Hellier |
functional images of the brain, fMRI is an appealing technique because it offers a good trade-off between spatial and temporal resolution. To increase its temporal resolution, echo-planar imaging (EPI) is used because it makes possible to collect at least five slices per second at a reduced spatial resolution. The drawback of this impressive acquisition rate is that it may introduce artifacts and distortions in the data. More details about these distortions can be found in [78].
If the distortions do not vary during the time series, they will not affect much the detection of subtle signal changes, but they will perturb the localization of the functional activity once being overlapped to the anatomical volume. It becomes necessary to correct these geometrical distortions in order to accurately identify activated areas.
Simulated Data. To evaluate the multimodal registration method, we use the simulated database of the MNI (Brainweb)7 [34]. The T1-weighted MR volume is the reference volume (3% noise and 9% inhomogeneity), whereas the T2-weighted MR volume is the floating volume.
From the T2-weighted MR volume, we extract a subvolume and we apply a rigid transformation (three rotations and three translations). To simulate local geometrical distortions, we apply a thin-plate spline [16] deformation to the volume. The thin-plate deformation is computed by choosing one point in the volume and a displacement for this point. We choose a displacement of magnitude 5 voxels, with no privileged direction. Furthermore, the thin-plate deformation field is constrained to be naught at the border of the volume.
After rigid registration (see Fig. 8.20), distortions are clearly visible. On the axial view, ventricles are not well registered ; on the sagittal and coronal view, the sagittal mid-plane is not well aligned. We then perform the multigrid non-rigid registration from grid level 7 until grid level 5 to avoid useless computational efforts. In this case we do not need to estimate a dense transformation, since the distortions are rather smooth and regular. Furthermore, the statistical similarity measure is only meaningful for a large number of voxels, i.e., for large cubes. After non-rigid registration, the internal structures are accurately registered (see ventricles on the axial view, and sagittal mid-plane on the coronal view for instance).
7 http://www.bic.mni.mcgill.ca/brainweb
Inter-Subject Non-Rigid Registration |
317 |
Figure 8.20: Results of the registration on simulated data. Top: results after rigid registration. Distortions are visible on axial view (ventricles) and on coronal view (sagittal mid-plane). Bottom: results after performing a 3D multimodal non-rigid registration. Misregistration is significantly reduced (see ventricles on axial view for instance).
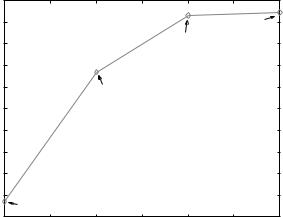
In Fig. 8.21, we present the evolution of the similarity measure, computed for all the volume. As the hierarchical estimation is performed, the similarity increases, which means that the dependence between the volumes to be registered also increases, leading to a more and more accurate registration. This is a numerical confirmation of visual assessment.
At this stage, the evaluation is not completely fair, since the criterion is related to the similarity used to drive the registration process. As we have the segmentation of the phantom (gray matter and white matter classes), we can evaluate objectively the registration process. We deform the segmentation volumes as described at the beginning of section (8.3.3). We can assess the quality of the registration by computing overlapping measures (specificity, sensitivity and total performance, see [142] for tutorial) between the initial classes and the deformed classes, once registered with the estimated deformation field. Let us recall that:
|
sensitivity |
= |
+ |
|
|
|
= T N/(F P + T N) |
|
|
specificity |
(8.6) |
|||
total performance = (T P + T N)/(T P + F P + T N + F N),
318 |
Hellier |
1.15 |
|
|
|
|
|
|
|
Value |
|
|
|
|
|
1.1 |
of the |
|
|
|
|
result at |
|
similarity |
|
|
|
|
|
|
|
|
result at |
|
grid level 5 |
|
|
measure |
|
|
|
||
1.05 |
|
|
grid level 6 |
|
||
|
|
|
|
|||
1 |
|
|
|
|
|
|
0.95 |
|
result at |
|
|
|
|
|
|
grid level 7 |
|
|
|
|
0.9 |
|
|
|
|
|
|
0.85 |
|
|
|
|
|
|
0.8 |
|
|
|
|
|
|
0.75 |
|
|
|
|
|
|
0.7 |
|
|
|
|
Registration process |
|
|
rigid registration |
|
|
|
||
0.65 |
0.5 |
1 |
1.5 |
2 |
2.5 |
3 |
0 |
||||||
Figure 8.21: Evolution of the similarity measure. As the hierarchical estimation is performed, the similarity increases, which means that the volumes are more accurately registered.
where T P, T N, F P and F N, respectively, denote the number of true positive, true negative, false positive, and false negative points.
These numerical results are shown in Table (8.2). At the end of grid level 5, we manage to recover more than 95% of the segmentation. This result is satisfactory, due to the use of binary classes, and due to a simple trilinear interpolation scheme that causes artefacts [108].
Real Data. We have performed the algorithm on real data (see Fig. 8.22). The patient has a cyst and a bone tumor, therefore the multiple interfaces (air/cyst/bone) introduce large distortions that are visible after rigid registration. For instance, on the left hemisphere, distortions are clearly visible on the posterior part of the cyst.
There are many artefacts in this fMRI acquisition: there has been signal saturation and signal drops (visible in the cyst and in the border of the skull). This illustrates the difficulty of registering real clinical data. Although quality of the results is quite difficult to quantify, we can see that the cyst (on the axial view) and the ventricles (on the sagittal view) are better aligned after non-rigid registration.