

Kluwer - Handbook of Biomedical Image Analysis Vol
.3.pdf410 |
Zhu and Cochoff |
Table 10.4: Average and standard deviation of Tx/Em indirect registration parameters obtained from the cross-entropy, reversed cross-entropy, and symmetric divergence registration measures with manual pre-registration. The angles are in degrees and translation offsets in mm
Alg |
θx |
θy |
θz |
tx |
ty |
tz |
Success |
CE |
2.26 ± 1.06 |
0.64 ± 0.81 |
0.31 ± 1.23 |
0.45 ± 0.25 |
0.34 ± 0.77 |
−3.69 ± 2.46 |
7 |
RCE |
2.55 ± 1.06 |
1.29 ± 1.16 |
1.40 ± 2.26 |
0.76 ± 2.02 |
1.91 ± 2.34 |
0.78 ± 2.01 |
7 |
SD |
1.79 ± 1.21 |
0.91 ± 1.80 |
1.32 ± 2.27 |
0.70 ± 1.91 |
1.70 ± 2.00 |
−0.27 ± 2.69 |
7 |
The results of mean and standard deviation for indirect Tx/Em registrations are tabulated in Table 10.4. Again, the large error in the z translation parameter for the cross-entropy maximization indicates that, among MR/Tx and MR/Em registrations, one overestimates that parameter and the other underestimates that parameter.
As can be seen, all three similarity measures successfully registered seven MR/Tx and seven MR/Em cases with a manual prealignment, and the means and standard deviations are comparable to those in Table 10.3. As a comparison, the Tx/Em indirect registration parameters were also computed from manual MR/Tx and MR/Em registration. The mean and standard deviation of the Tx/Em indirect registration parameters were (2.42 ± 2.69, 0.22 ± 2.20, 0.15 ± 2.50, 2.66 ± 1.94, 0.69 ± 2.01, 2.31 ± 3.14). Since most of the manual registration results had zeros in the y- and z-axis rotation, the mean values of these parameters are small. Thus, a small mean does not necessarily mean that the manual registration is more accurate. Since the reversed cross-entropy and symmetric divergence registration has a small capture range, one might be concerned that their registration results would not deviate significantly from the manual starting registration. If this were true, the mean and standard deviation values in Table 10.4 would reflect the mean and standard deviation associated with the manual registration results. To check this possible situation, the difference of the cross-entropy, reversed cross-entropy, and symmetric divergence registration results and the manual starting solutions was checked. The angle difference was as large as 5◦ and the translation was as large as 6 mm. Thus, it is unlikely that the mean and standard deviation for the reversed cross-entropy and symmetric divergence registration merely reflect the mean and standard deviation in the manual registration.
Cross-Entropy, Reversed Cross-Entropy, and Symmetric Divergence |
411 |
|
1.05 |
|
|
|
|
|
|
|
1 |
|
|
|
|
|
|
|
0.95 |
|
|
|
|
|
|
Value |
0.9 |
CE |
|
|
|
|
|
Similarity |
0.85 |
|
|
|
|
|
|
Normalized |
|
|
|
|
|
|
CE |
0.8 |
SD |
|
|
|
|
|
|
|
|
|
|
|
|
||
|
|
|
|
|
|
|
|
|
0.75 |
RCE |
|
|
|
|
|
|
|
|
|
|
|
|
|
|
|
|
|
|
|
|
SD |
|
0.7 |
|
|
|
|
|
|
|
|
|
|
|
|
|
RCE |
|
0.65 |
−10 |
−5 |
0 |
5 |
10 |
15 |
|
−15 |
||||||
|
|
|
|
X Rotations (degrees) |
|
|
|
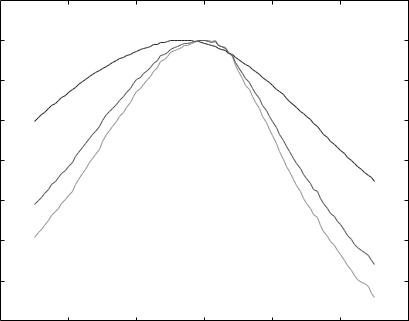
Figure 10.3: The cross-entropy (CE), reversed cross-entropy (RCE), and symmetric divergence (SD) profiles of an MR/Em image pair in the vicinity of a manual registration when the x-rotation angle changes independently.
10.5.1.3 Behavior Around True Registration
Three similarity measures were computed in the vicinity of an optimal registration. Since the ground truth is unknown, we used the manual registration result as an approximation to the ground truth. It is difficult to visualize the hypersurface in seven-dimensional space. Therefore, only one registration parameter was changed at a time when a profile was computed.
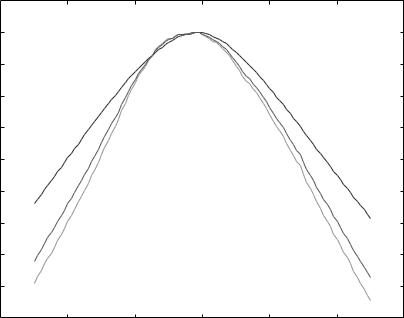
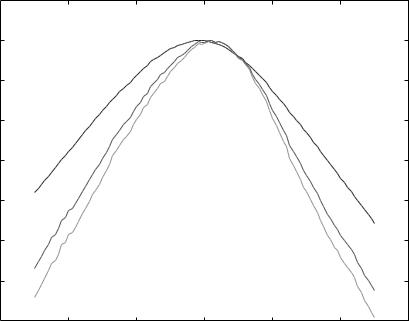
Figures 10.3–10.5 show the representative profiles of these similarity measures as a function of rotation angles about the x-, y-, and z-axis, respectively. The horizontal axis (registration parameters) in all profiles reported in this chapter was normalized to the manual registration parameters. All similarity values have been normalized with a maximum value of 1. As can be seen, the cross-entropy, reversed cross-entropy, and symmetric divergence measures peak around the manual registration. However, there are differences as large as 3◦ in the peak

|
1.05 |
|
|
|
|
|
|
|
1 |
|
|
|
|
|
|
|
0.95 |
|
|
|
|
|
|
Values |
0.9 |
|
|
|
|
|
CE |
|
|
|
|
|
|
||
|
|
|
|
|
|
|
|
Similarity |
0.85 |
|
|
|
|
|
|
|
CE |
|
|
|
|
SD |
|
|
|
|
|
|
|
||
Normalized |
0.8 |
|
|
|
|
|
RCE |
|
|
|
|
|
|
||
0.75 |
|
|
|
|
|
|
|
|
0.7 |
SD |
|
|
|
|
|
|
|
|
|
|
|
|
|
|
0.65 |
RCE |
|
|
|
|
|
|
|
|
|
|
|
|
|
|
−15 |
−10 |
−5 |
0 |
5 |
10 |
15 |
|
|
|
|
Y Rotation (degrees) |
|
|
|
Figure 10.4: The cross-entropy (CE), reversed cross-entropy (RCE), and symmetric divergence (SD) profiles of an MR/Em image pair in the vicinity of a manual registration when the y-rotation angle changes independently.
|
1.05 |
|
|
|
|
|
|
|
1 |
|
|
|
|
|
|
Values |
0.95 |
|
|
|
|
|
|
Similarity |
|
|
|
|
|
|
|
|
|
|
|
|
|
CE |
|
|
|
|
|
|
|
|
|
Normalized |
0.9 |
CE |
|
|
|
|
|
|
|
|
|
|
|
||
|
|
|
|
|
|
|
|
|
|
|
|
|
|
|
SD |
|
0.85 |
|
|
|
|
|
|
|
|
|
|
|
|
|
RCE |
|
|
SD |
|
|
|
|
|
|
|
RCE |
|
|
|
|
|
|
0.8 |
−10 |
−5 |
0 |
5 |
10 |
15 |
|
−15 |
||||||
|
|
|
|
Z Rotation (degrees) |
|
|
|
Figure 10.5: The cross-entropy (CE), reversed cross-entropy (RCE), and symmetric divergence (SD) profiles of an MR/Em image pair in the vicinity of a manual registration when the z-rotation angle changes independently.
Cross-Entropy, Reversed Cross-Entropy, and Symmetric Divergence |
413 |
|
1.05 |
|
|
|
|
|
|
|
|
1 |
|
|
|
|
|
|
|
|
0.95 |
|
|
|
|
|
|
|
Values |
0.9 |
|
|
|
|
|
|
|
0.85 |
|
|
|
|
|
|
|
|
Similarity |
|
|
|
|
|
|
|
|
0.8 |
|
|
|
|
|
|
|
|
|
|
|
|
|
|
|
|
|
Normalized |
0.75 |
CE |
|
|
|
|
|
|
|
|
|
|
|
|
|
||
0.7 |
|
|
|
|
|
|
CE |
|
|
|
|
|
|
|
|
||
|
|
|
|
|
|
|
|
|
|
0.65 |
SD |
|
|
|
|
|
|
|
|
|
|
|
|
|
|
|
|
|
|
|
|
|
|
|
SD |
|
0.6 |
RCE |
|
|
|
|
|
|
|
|
|
|
|
|
|
|
RCE |
|
0.55 |
|
−10 |
−5 |
0 |
5 |
10 |
1 |
|
−15 |
|||||||
|
|
|
|
|
X Translation (mm) |
|
|
|
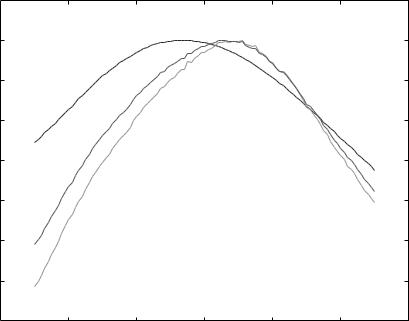
Figure 10.6: The cross-entropy (CE), reversed cross-entropy (RCE), and symmetric divergence (SD) profiles of an MR/Em image pair in the vicinity of a manual registration when the x-translation changes independently.
positions for the different measures which is understandable since they are defined differently. The figures also revealed that the curve for the cross-entropy measure is slightly smoother than those associated with the reversed crossentropy and symmetric divergence measures. This rough nature in the reversed cross-entropy and symmetric divergence profiles may result in the inferior performance of iterative optimization and a small capture range for these similarity measures. This behavior may be caused by the presence of many local optima that can confuse the optimization procedure.
Similarly, Figs. 10.6–10.8 show the representative profiles of the crossentropy, reversed cross-entropy, and symmetric divergence measures as a function of x-, y-, and z-translation, in the neighborhood of a manual registration. All three profiles peak around the manual registration results. This behavior is one of the necessary conditions for a good registration measure. The difference of peak positions of three similarity measures is small (ca. 1 mm) in the x and y
414 |
Zhu and Cochoff |
|
1.05 |
|
|
|
|
|
|
|
|
1 |
|
|
|
|
|
|
|
|
0.95 |
|
|
|
|
|
|
|
Values |
0.9 |
|
|
|
|
|
|
|
|
|
|
|
|
|
|
|
|
Similarity |
0.85 |
|
|
|
|
|
|
|
|
|
|
|
|
|
|
|
|
Normalized |
0.8 |
CE |
|
|
|
|
|
|
|
|
|
|
|
|
|
||
|
|
|
|
|
|
|
CE |
|
|
|
|
|
|
|
|
|
|
|
0.75 |
|
|
|
|
|
|
|
|
0.7 |
SD |
|
|
|
|
|
|
|
|
|
|
|
|
|
SD |
|
|
|
|
|
|
|
|
|
|
|
|
RCE |
|
|
|
|
|
RCE |
|
0.65 |
|
|
|
|
|
|
|
|
|
−10 |
−5 |
0 |
5 |
10 |
15 |
|
|
−15 |
|||||||
|
|
|
|
|
Y Translation (mm) |
|
|
|
Figure 10.7: The cross-entropy (CE), reversed cross-entropy (RCE), and symmetric divergence (SD) profiles of an MR/Em image pair in the vicinity of a manual registration when the y-translation changes independently.
directions, but sizable in the z direction (ca. 4 mm). The cross-entropy curve is the smoothest.
Although we don’t know if the peak appearing in the neighborhood of the manual registration represents the global optimal, the presence of a local maxima does indicate that the three measures are suitable as registration criteria. The difference in the peak positions is expected since the similarity measures are different. Furthermore, the Em image used in our study has a low resolution (7.12 mm in all three directions) and the difference in the peak positions is not significant compared to the voxel size.
10.5.1.4 Numerical Stability for Maximization
As mentioned earlier, it could cause numerical problems when there are zero joint probabilities in the reversed cross-entropy and symmetric divergence
Cross-Entropy, Reversed Cross-Entropy, and Symmetric Divergence |
415 |
|
1.05 |
|
|
|
|
|
|
|
1 |
|
|
|
|
|
|
|
0.95 |
|
|
|
|
|
|
Values |
0.9 |
|
|
|
|
|
|
|
|
|
|
|
|
|
|
Similarity |
CE |
|
|
|
|
|
|
0.85 |
|
|
|
|
|
CE |
|
|
|
|
|
|
|
||
Normalized |
|
|
|
|
|
|
|
|
|
|
|
|
|
SD |
|
0.8 |
|
|
|
|
|
RCE |
|
|
|
|
|
|
|
||
|
|
|
|
|
|
|
|
|
0.75 |
|
|
|
|
|
|
|
SD |
|
|
|
|
|
|
|
0.7 |
|
|
|
|
|
|
|
RCE |
|
|
|
|
|
|
|
0.65 |
−10 |
−5 |
0 |
5 |
10 |
15 |
|
−15 |
||||||
|
|
|
|
Z Translation (mm) |
|
|
|
Figure 10.8: The cross-entropy (CE), reversed cross-entropy (RCE), and symmetric divergence (SD) profiles of an MR/Em image pair in the vicinity of a manual registration when the z-translation changes independently.
calculation. We must cope with this numerical instability. A simple, heuristic approach is described in Section 10.3.6. In this section, the behaviors of different α selections are compared. Since the symmetric divergence measure contains the reversed cross-entropy component, the experiment was only performed using the reversed cross-entropy measure. One could also ignore the contributions associated with the zero joint pdfs. As a comparison, this strategy is also evaluated.
Figures 10.9 and 10.10 show the reversed cross-entropy profiles when the x-rotation angle and the x-translation change independently. The profiles are labelled with the α values used to compute a small probability value which replaces the zero pdf. The results when the zero pdfs are ignored in the profile calculation are also shown.
As these two figures reveal, the reversed cross-entropy profiles are very rough if the zero pdfs are ignored in the calculation. For the x-rotation angle,

416 |
Zhu and Cochoff |
|
2.6 |
|
|
|
|
|
|
|
2.4 |
|
|
1000 |
0 |
|
|
|
|
|
|
|
|
||
|
2.2 |
|
|
|
|
|
|
Entropy |
2 |
|
|
|
|
|
|
1.8 |
|
|
100 |
|
|
|
|
Reversed–Cross |
|
|
|
|
|
||
1.6 |
|
|
|
|
|
|
|
1.4 |
|
|
|
|
|
|
|
|
|
|
|
|
|
|
|
|
1.2 |
|
|
1 |
|
|
|
|
|
|
|
|
|
|
|
|
1 |
|
|
|
|
|
|
|
|
|
|
ignored |
|
|
|
|
0.8 |
−10 |
−5 |
0 |
5 |
10 |
15 |
|
−15 |
||||||
|
|
|
|
X Rotation (degrees) |
|
|
|
Figure 10.9: The reversed cross-entropy profiles of an MR/Em image pair in the vicinity of a manual registration when the x-rotation angle changes independently. The numbers adjacent to the profiles indicate the α value used to compute a small probability value which is used to replace zero pdfs. The bottom profile represents the case where the contribution from zero joint pdfs was ignored in the profile computation.
there is not even a peak around the manual registration. These two undesirable features render the reversed cross-entropy measure unsuitable as a registration measure if the zero pdfs are ignored. If the zero pdfs are taken into account and as α increases, the profiles become smooth and then rough again. It seems that
α= 100 is a reasonable choice, which gives a relatively smooth profile. When
αis small, the extraneous pdfs replacing the zero pdfs causes the summation of the pdfs to significantly deviate from unity. Therefore, a small α is not ideal. When α is large, the contribution of each extraneous pdf becomes dominant, the total reversed cross-entropy increases, and the contribution from nonzero pdfs is diminished gradually. The latter behavior makes a large α not ideal either.
When α = 100, the summation of all pdfs, including the extraneous ones, is at

Cross-Entropy, Reversed Cross-Entropy, and Symmetric Divergence |
417 |
|
2.6 |
|
|
|
|
|
|
|
2.4 |
|
|
1000 |
0 |
|
|
|
|
|
|
|
|
||
|
2.2 |
|
|
|
|
|
|
|
2 |
|
|
|
|
|
|
Entropy |
1.8 |
|
|
100 |
|
|
|
|
|
|
|
|
|
|
|
Reversed–Cross |
1.6 |
|
|
|
|
|
|
1.4 |
|
|
|
|
|
|
|
|
|
|
1 |
|
|
|
|
|
1.2 |
|
|
|
|
|
|
|
|
|
|
|
|
|
|
|
1 |
|
|
|
|
|
|
|
|
|
|
ignored |
|
|
|
|
0.8 |
|
|
|
|
|
|
|
0.6 |
−10 |
−5 |
0 |
5 |
10 |
15 |
|
−15 |
||||||
|
|
|
|
X Translation (mm) |
|
|
|
Figure 10.10: The reversed cross-entropy profiles of an MR/Em image pair in the vicinity of a manual registration when the x-translation changes independently. The numbers adjacent to the profiles indicate the α value used to compute a small probability value which is used to replace zero pdfs. Ignored means that those pdfs are ignored when computing the profile.
most 1.01. The upper bound can be achieved only when there is 1 nonzero pdf which is 1, and all other pdfs are zero. Based on these observations, we chose
α = 100 in our calculation.
10.5.2Registration by Cross-Entropy, Reversed Cross-Entropy, and Symmetric Divergence Minimization
10.5.2.1 Registration Performance
The standard deviations of four independent manual registration results were, in vector form, (3.48, 0.53, 3.11, 1.68, 2.98, 1.83). The likely priori was calculated

418 |
Zhu and Cochoff |
Table 10.5: Average and standard deviation of MR/Em registration parameters obtained from cross-entropy, reversed cross-entropy, and symmetric divergence minimization. The angles are in degrees and translation offsets in mm
Alg |
θx |
θy |
θz |
tx |
ty |
tz |
Success |
|||||
Set 1 |
0.03 ± 0.80 |
0.18 ± 0.74 |
−0.13 |
± 0.44 |
0.03 ± 0.13 |
−0.02 |
± 0.42 |
−0.04 ± 0.17 |
|
|||
CE |
46% |
|||||||||||
RCE |
−0.05 ± 0.45 |
0.09 ± 0.39 |
0.07 |
± 0.31 |
0.07 ± 0.33 |
0.06 |
± 0.31 −0.01 ± 0.10 |
53% |
||||
SD |
0.00 |
± 0.10 |
0.06 ± 0.34 |
0.05 |
± 0.29 |
0.05 ± 0.30 |
0.02 |
± 0.13 −0.02 |
± 0.11 |
68% |
||
Set 2 |
|
± 1.04 |
|
± 0.87 |
0.02 ± 0.51 |
0.10 ± 0.50 |
−0.07 |
± 0.59 |
−0.11 |
± 0.29 |
|
|
CE |
0.23 |
0.24 |
41% |
|||||||||
RCE |
0.02 |
± 0.29 |
0.10 |
± 0.43 |
0.04 ± 0.35 |
0.06 ± 0.38 |
0.00 |
± 0.33 −0.03 |
± 0.14 |
51% |
||
SD |
−0.06 |
± 0.51 |
−0.02 |
± 0.33 |
0.06 ± 0.30 |
0.00 ± 0.31 |
0.06 |
± 0.48 |
−0.01 |
± 0.10 |
52% |
|
using the average manual registration parameters, as mentioned earlier. Refer to section 10.4.3 for details on the experimental setup.
Table 10.5 lists the statistics of the registration results for two sets of experiments. As the table reveals, the registration parameters are very close to those of the manual results and the differences of these registration parameters are well below the detection threshold of a trained technician. This is expected since the priori was calculated based on the manual registration results. Also revealed by Table 10.5 is that both reversed cross-entropy and symmetric divergence outperformed cross-entropy minimization in terms of success rate, and that symmetric divergence has the highest overall success rate.
Note that the implementation of this minimization process is not yet optimized, e.g., one may use Paren density estimation with a Gaussian kernel to add some smoothness and stability to the similarity functions. Nevertheless, these results indicate that cross-entropy, reversed cross-entropy, and symmetric divergence minimization can yield a very good registration if a good prior estimation is available.
10.5.2.2 Behavior Around True Registration
The behavior of these three similarity measures was also checked in the vicinity of the manual registration, with the desirable prior calculated from that same manual registration.

Cross-Entropy, Reversed Cross-Entropy, and Symmetric Divergence |
419 |
|
0.09 |
|
|
|
|
|
|
|
0.08 |
|
|
|
|
|
SD |
|
|
|
|
|
|
|
|
|
0.07 |
SD |
|
|
|
|
|
|
|
|
|
|
|
|
|
|
0.06 |
|
|
|
|
|
|
Values |
0.05 |
|
|
|
|
|
|
|
|
|
|
|
|
CE |
|
Similarity |
|
|
|
|
|
|
|
0.04 |
CE |
|
|
|
|
RCE |
|
|
|
|
|
|
|||
|
|
|
|
|
|
||
|
|
|
|
|
|
|
|
|
0.03 |
RCE |
|
|
|
|
|
|
|
|
|
|
|
|
|
|
0.02 |
|
|
|
|
|
|
|
0.01 |
|
|
|
|
|
|
|
0 |
−10 |
−5 |
0 |
5 |
10 |
15 |
|
−15 |
||||||
|
|
|
|
X Rotation (degrees) |
|
|
|
Figure 10.11: The cross-entropy (CE), reversed cross-entropy (RCE), and symmetric divergence (SD) profiles (with a likely priori) of an MR/Em image pair in the vicinity of a manual registration when the x-rotation changes independently.
Figures 10.11–10.13 show the representative profiles of these similarity measures as a function of rotation angles about the x-, y-, and z-axis, respectively. Figures 10.14–10.16 show the representative profiles of these similarity measures as a function of translation along the x-, y-, and z-axis, respectively. As revealed by all these figures, there are valleys in the profiles around the manual registration parameters, which is one of the necessary conditions for a good registration measure. As expected, the minimum values in all cases are zero since the priori pdf and the estimated pdf at this registration are identical.
10.5.2.3 Numerical Stability for Minimization
In the cross-entropy minimization calculation, if the priori pdf is zero, the crossentropy is not stable. To address this case, one can either ignore the zero priori pdf terms or substitute the zero pdfs with small positive numbers and use the