

Kluwer - Handbook of Biomedical Image Analysis Vol
.3.pdf400 |
Zhu and Cochoff |
image are defined at specific grid points, to compute the joint pdf by binning voxel value pairs, one needs to interpolate the voxel values in the transformed space. There are different interpolation methods in three-dimensional space. Tsao [16] compared eight such methods. Interpolation artifacts are reported which introduce spurious fluctuations in the similarity measures and impact the optimization behavior. For simplicity, the trilinear interpolation was used in our study.
10.3.4 Optimization
Powell’s multidimensional direction set optimization is used to minimize the three similarity measures when favorable priori estimates are used using Brent’s method in one-dimensional search [39]. The same technique is also used to minimize the negated similarity measures when unfavorable priori estimates are applied. The direction matrix is initialized to a unitary matrix. The vector is (θx, θy, θz, tx, ty, tz), as explained before. A reordering of these registration parameters is possible which may improve the optimization speed as in Maes et al.
[15]. We did not try to optimize the parameter order since the order may be image content dependent and an exhaustive trial seems impractical (there are 6! = 720 different combinations although one may try a subset of them). Furthermore, Powell’s optimization may use six independent directions which do not necessarily correspond to the six desired directions as the search proceeds (see [15, 39]).
The stop criterion in the Powell’s algorithm was set to ftol = 0.001.
10.3.5 Multiresolution
The Powell’s optimization method cannot guarantee that a global optimal value will be found since it can be easily trapped to a local optimum. To find a true global optimal value, Ritter et al. [40] successfully applied the simulated annealing [39] algorithm to two-dimensional image registration. It is a stochastic method and is slow, which limits its application to three-dimensional image registration. Pluim et al. used genetic algorithms [17] or others used multistarter methods to pinpoint a global optimum. However, the desired registration is frequently a local rather than global extremum of the similarity measure, as discussed in Fitzpatrick et al. [41]. This can occur when the image resolution is
Cross-Entropy, Reversed Cross-Entropy, and Symmetric Divergence |
401 |
low, the image size is small, or the overlap of images is limited. In practice, the multiresolution approach proves to be helpful. It can improve the optimization speed, increase the capture range and the algorithm is relatively robust [42]. In our implementation, the images were folded down to a 16 × 16 × 16 image as the most coarse image. The resolution of the successive images was doubled until the full image resolution or 64 × 64 × 64 was reached in all three dimensions. We used fine resolutions beyond 64 × 64 × 64 when the image size permitted it. But most cases did not exhibit any sizable improvements on the registration accuracy, and there was almost no effect on the success rate. To obtain the coarse images, the voxel values within a sampling volume are averaged. Although it is a little slower than a simple subsampling approach, the averaging technique results in a better registration [18].
10.3.6 Numerical Stability
Referring to the definitions of cross-entropy, reversed cross-entropy, and symmetric divergence, one may find that there may be a numerical problem under some conditions. The instability is caused when the priori or joint probability is zero. Ideally, one could sample a large dataset to get a better estimate of the priori or use sophisticated sampling schemes to better estimate the joint probability. Since those are computationally demanding, we chose a simple, non-exact approach that is described below.
For cross-entropy maximization, if the joint probability is zero, the contribution to the cross-entropy is zero (0 log 0 = 0). If the marginal probability is zero, the joint probability will be zero and will have no contribution to the crossentropy measure. In the cross-entropy calculation, therefore, the terms can be ignored when the joint or marginal probabilities are zero.
For the cross-entropy minimization, the contribution to the cross-entropy would be infinite when the priori probability is zero. We elected to ignore these terms since the cross-entropy is being minimized. Alternatively, one could assign a large value to the cross-entropy under this situation. When picking such a large value, one should take into account the stop condition of the optimization process. If the assigned value is too large, the optimization can prematurely terminate. We chose a positive value, that resulted in the cross-entropy minimization having a small capture range. Note that if the joint probability is zero, the terms can also be ignored.

402 Zhu and Cochoff
For the reversed cross-entropy maximization, if the marginal probability is zero, the contribution to the reversed cross-entropy is zero due to the fact that 0 log 0 = 0. If the joint probability is zero and the marginal probability is not zero, then the contribution to the reversed cross-entropy is infinite. Since the reversed cross-entropy is being maximized and we assume the optimized reversed cross-entropy has a finite value, this instability due to the zero joint pdf terms must be addressed. As shown later in this chapter, if the zero joint probability terms are ignored, the profile of the reversed cross-entropy will have a zig-zag shape, which adversely affects the optimization process and renders the reversed cross-entropy an inappropriate measure for registration. We elected to assign a small probability value to the zero joint probabilities, which
is × 1 × , where α was selected empirically to be 100. We will discuss
binsize binsize al pha
the impact of the α selection in a later section.
For the reversed cross-entropy minimization, if the priori probability is zero, then the contribution to the reversed cross-entropy is zero due to the fact that 0 log 0 = 0. If the joint probability is zero and the priori probability is not zero, the contribution to the reversed cross-entropy is infinite. In the later case, since we assume the minimized reversed cross-entropy has a lower bound, their contributions are ignored.
The symmetric divergence method utilizes the cross-entropy and reversed cross-entropy components and its numerical stability is determined by those two terms.
10.4 Registration Experimental Setup
10.4.1 Dataset Description
MR, nuclear transmission (Tx) and nuclear emission (Em) scans were used as test volumes. They were primary brain images, with some inclusion of the neck and chest. The image data consists of slices. The x-axis is directed horizontally from right to left, the y-axis horizontally from front to back, and the z-axis vertically from bottom to top.
This study involved seven patients. All the pertinent image file information is tabulated in Table 10.1. The MR images were acquired with an OutLook MR scanner (Philips Medical Systems, formerly Marconi Medical Systems, Cleveland,

Cross-Entropy, Reversed Cross-Entropy, and Symmetric Divergence |
403 |
Table 10.1: Image file descriptions, where Tx stands for transmission scan, Em emission scan, Sag sagittal slices, and Axi axial slices
Patient |
Modality |
Image |
Dimension |
Voxel (mm3) |
Comments |
||
|
|
|
|
|
|
|
|
A |
MR |
Sag |
2562 |
× 128 |
1.02 |
× 1.5 |
m, 29 yr |
|
Tx |
Axi |
642 |
× 29 |
7.123 |
|
|
|
Em |
Axi |
642 |
× 29 |
7.123 |
|
|
B |
MR |
Sag |
2562 |
× 128 |
1.02 |
× 1.5 |
m, 21 yr |
|
Tx |
Axi |
642 |
× 24 |
7.123 |
|
|
|
Em |
Axi |
642 |
× 24 |
7.123 |
|
|
C |
MR |
Sag |
2562 |
× 128 |
1.02 |
× 1.5 |
f, 70 yr |
|
Tx |
Axi |
642 |
× 22 |
7.123 |
|
|
|
Em |
Axi |
642 |
× 22 |
7.123 |
|
|
D |
MR |
Axi |
192 × 256 × 24 |
1.172 × 6.0 |
m, 45 yr |
||
|
Tx |
Axi |
642 |
× 31 |
6.232 |
× 7.12 |
|
|
Em |
Axi |
642 |
× 31 |
6.232 |
× 7.12 |
|
E |
MR |
Sag |
1802 |
× 120 |
1.412 × 1.5 |
m, 40 yr |
|
|
Tx |
Axi |
642 |
× 26 |
6.232 |
× 7.12 |
|
|
Em |
Axi |
642 |
× 26 |
6.232 |
× 7.12 |
|
F |
MR |
Sag |
192 × 256 × 120 |
1.412 × 1.5 |
m, 60 yr |
||
|
Tx |
Axi |
642 |
× 53 |
3.503 |
|
|
|
Em |
Axi |
642 |
× 53 |
3.503 |
|
|
G |
MR |
Sag |
192 × 256 × 120 |
1.412 × 1.5 |
m, 13 yr |
||
|
Tx |
Axi |
642 |
× 28 |
6.232 |
× 7.12 |
|
|
Em |
Axi |
642 |
× 28 |
6.232 |
× 7.12 |
|
Ohio), and the nuclear images were acquired with a Prism 3000XP (Philips Medical Systems) scanner. In all Tx and Em scans, Technetium-99m hexamethyl- propolamine-oxime (Tc-99m HMPAO) was used as the isotope. The Tx and Em images were acquired simultaneously using the STEP (simultaneous transmission emission protocol) protocol. Thus, the Tx and Em images are registered intrinsically (see [43, 44, 45, 46]).
10.4.2Experimental Setup—Maximization of Similarity Measures
Cross-entropy, reversed cross-entropy, and symmetric divergence are maximized when the joint pdf is derived from an optimal registration and it differs greatly from a unlikely priori estimate. This subsection discusses the details of the experimental setup as well as the determination of the registration accuracy.
404 |
Zhu and Cochoff |
In the case of retrospective multimodality registration, the correct registration parameters are typically unknown. Various evaluation methods have been used to assess registration accuracy, including phantom validation, observer assessment [11], fiducial marks [8, 9, 10], and cross validation [47]. Since the Tx and Em scans used in our study are intrinsically registered (see [43, 44, 45, 46]), we have us an ideal method to evaluate the registration accuracy. In this special case, the accuracy of a registration technique can be assessed by evaluating the registration parameters that are generated when these Tx and Em images are used as input.
The Tx and Em images were also individually registered to the MR images. Based on those registration results, the registration parameters between the Tx and Em images were indirectly calculated. If we denote the transformation matrix relating the MR and Tx images, MMR/ T x, and the matrix relating the MR and Em images, MMR/Em, the matrix relating the Tx and Em images can be calculated as MT x/Em = MMR−1 / T x MMR/Em.
For this indirect registration, two sets of experiments were performed. In the first set, no attempt was made to manually preregister the images before the automatic registration started. In the second set, all images were initially brought into approximate registration using a manual method. The same manual adjustments were used in cross-entropy, reversed cross-entropy, and symmetric divergence registrations.
If the MR/Tx and MR/Em registrations deviate from the true registration in the same manner, the indirect registration evaluation may yield a misleading registration accuracy. To guard against this, all registration results were visually checked. Only if both registrations were visually acceptable, were their registration results used to indirectly calculate the Tx/Em registration. Since it is reported in Studholme et al. [11] that clinicians can detect registration parameter differences of 4◦ in x and y rotation angles, 2◦ in the z rotation angle, 2 mm in x and y translations, and 3 mm in z translation, the registrations were believed to be close to the truth if the results were visually acceptable.
The accuracy and robustness of direct and indirect Tx/Em registrations were analyzed in terms of the mean and standard deviation of the differences between the resultant registration parameters and the intrinsic ones. Alternatively, one can compute the difference of a group of selected points. As reported in West et al. [8], the mean of point differences is related to the rotation and translation
Cross-Entropy, Reversed Cross-Entropy, and Symmetric Divergence |
405 |
registration parameters. In this chapter, we chose not to report the point differences.
To further understand the behavior of similarity measures in the vicinity of an optimal registration, the similarity measures were computed for images in the neighborhood of a manual registration. It is believed that the manual results are close to the ground truth. Thus, this calculation would shed light on the behavior of these measures. To this end, we focused on the MR/Em image pair of patient B, arbitrarily.
We also evaluated different strategies to cope with the numerical instability that occurs when maximizing the selected similarity measures. The strategies were evaluated by inspecting the similarity profiles that resulted from systematically adjusting the registration parameters from those obtained when the images underwent manual registration.
10.4.3Experiment Setup—Minimization of Similarity Measures
If one has a good estimation of the joint voxel value distribution, then the crossentropy, reversed cross-entropy, and symmetric divergence measures can be minimized to find the optimal registration. Although a reasonably good prior estimation is difficult to obtain, we report on the outcome of some experiments to validate the idea. We did the experiment on the MR/Em image pair of Patient B.
The image pair was registered by four clinical experts using an interactive (manual) registration method. A joint voxel value distribution was calculated based on the averaged manual registration parameters. This distribution was then used as the priori. It is worthy to note that the priori probabilities need to be recomputed for each resolution when the multiresolution optimization is used. In this test, only two resolution levels were employed, 32 and 64.
To assess the robustness of registration by the cross-entropy, reversed crossentropy, and symmetric divergence minimization, two sets of misregistrations were randomly generated around the above-mentioned average registration results, and used as initial registrations. In the first set of 100 misregistrations (Set 1), the differences between the rotation angles and the average rotation angles were uniformly distributed over [−10, 10] degrees and the differences between the translation offsets were uniformly distributed over [−10, 10] mm. For the
406 |
Zhu and Cochoff |
second set of 100 registrations (Set 2), the distributions were expanded to [−20, 20] degrees and mm.
Since the true registration parameters are unknown, we estimated them by averaging the manual registration parameters obtained from four clinical experts. A registration was judged to be successful if the registration parameters were close to the averaged manual values. The thresholds were equal to the detection thresholds [11], i.e., (4◦, 4◦, 2◦, 2 mm, 2 mm, 3 mm). Note that the thresholds are tighter than what were used in Zhu [18].
The accuracy and robustness of registrations obtained by minimizing the similarity measures were analyzed in terms of the mean and standard deviation of the differences between the resultant registration parameters and the averaged manual registration parameters.
To understand the behavior of these similarity measures in the vicinity of an optimal registration, the similarity measures were computed in the neighborhood of manual registration results. It is believed that the manual results are close to the ground truth. Thus, this calculation would shed light on the behavior of these measures.
Different strategies to handle the potential numerical instability problem in this minimization approach are compared by inspecting their similarity function profiles in the vicinity of the manual registration.
10.5 Results and Discussions
10.5.1Registration by Cross-Entropy, Reversed Cross-Entropy, and Symmetric Divergence Maximization
10.5.1.1 Tx/Em Direct Registration
When the Em images were registered to the Tx images directly, the cross-entropy, reversed cross-entropy, and symmetric maximization successfully registered 4, 5, and 7 (out of 7) cases, respectively. The results of failed cases by the crossentropy and reversed cross-entropy techniques were significantly different from the intrinsic registrations by visual inspection (the misalignment angles or translation offsets are too big). The mean and standard deviation of registration

Cross-Entropy, Reversed Cross-Entropy, and Symmetric Divergence |
407 |
Table 10.2: Average and standard deviation of Tx/Em direct registration parameters obtained from the cross-entropy (CE), reversed cross-entropy (RCE), and symmetric divergence (SD) registration measures. The angles are in degrees, translation offsets in mm
Alg |
θx |
θy |
θz |
tx |
ty |
tz |
Success |
CE |
0.64 ± 1.27 |
0.00 ± 0.00 |
0.85 ± 1.71 |
0.21 ± 0.43 |
0.19 ± 0.89 |
−0.98 ± 1.13 |
4 |
RCE |
0.36 ± 1.34 |
0.35 ± 0.63 |
−0.55 ± 1.34 |
−0.14 ± 1.17 |
1.18 ± 1.40 |
1.26 ± 0.69 |
5 |
SD |
0.86 ± 1.06 |
0.30 ± 1.53 |
0.14 ± 0.79 |
−0.07 ± 0.92 |
0.79 ± 0.69 |
−0.97 ± 1.39 |
7 |
parameters for all successful registrations obtained from the cross-entropy, reversed cross-entropy, and symmetric divergence maximization are tabulated in Table 10.2.
From the data in Table 10.2, one can conclude that registration by the symmetric divergence maximization has the higher success rate. For all cross-entropy, reversed cross-entropy, and symmetric divergence image registration, the average differences of the registration parameters from the true parameters are below the detection thresholds of a trained clinician.
The failed cases of cross-entropy and reversed cross-entropy registration are intriguing. The diameter of the field of view of the Tx and Em slice images is 46 cm. A brain with a 20 cm diameter only occupies 1/6 or 1/7 of the slice area. Thus, in the histogram estimation, many voxel pairs populate in the lowest bins, which has an adverse effect on the registration. We tried to exclude them by discarding the low end of the histogram from the similarity measure calculation and the cross-entropy successfully registered all seven cases, but with larger mean and standard deviation (data not shown here). Moreover, the same exclusion scheme reduced the success rate of MR/Tx and MR/Em registration by cross-entropy maximization. Therefore, no data exclusion techniques were used in any of the experiments reported in this chapter.
10.5.1.2 Tx/Em Indirect Registration
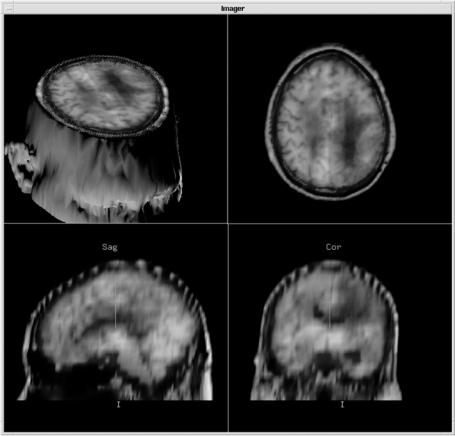
The Tx and Em images were indirectly registered through the MR images. Figure 10.2 shows typical MR/Em registration results (of patient B). The axial, sagittal, and coronal views are overlaid with a changeable transparency. All three views are correlated by a movable cross-hair token. In the top-left
408 |
Zhu and Cochoff |
Figure 10.2: A typical registration result of MR/Em (patient B).
quadrant, the surface is generated from the MR image using a marching cube algorithm. In the cut-away view, the MR and Em are overlaid. The cut plane position can also be changed by the cross-hair token. The three-dimensional view can be manipulated to select the desired view direction. This visualization tool provides an excellent means to check, visualize, and fuse the registration results.
The cross-entropy maximization registration failed to register one MR/Tx case. Thus, one Tx/Em set of indirect registration parameters were not computed. The mean and standard deviation of indirect registration parameters associating the Tx and Em images are reported in Table 10.3. Overall, the mean and standard deviation are larger than those in the direct registration (see Table 10.2), suggesting that errors in MR/Tx and MR/Em registrations may be

Cross-Entropy, Reversed Cross-Entropy, and Symmetric Divergence |
409 |
Table 10.3: Average and standard deviation of Tx/Em indirect registration parameters obtained from the cross-entropy, reversed cross-entropy, and symmetric divergence registration measures without manual preregistration. The angles are in degrees and translation offsets in mm
Alg |
θx |
θy |
θz |
tx |
ty |
tz |
Success |
CE 2.33 ± 1.49 |
0.27 ± 0.99 |
−0.67 ± 0.90 |
0.16 ± 0.47 |
0.05 ± 1.05 |
3.17 ± 1.61 |
6 |
|
RCE |
3.38 ± 1.37 |
−0.29 ± 1.52 |
−0.77 ± 1.97 |
−0.37 ± 1.13 |
1.21 ± 2.34 |
0.89 ± 3.25 |
5 |
SD |
2.35 ± 3.00 |
−0.03 ± 0.37 |
−0.75 ± 1.41 |
−0.13 ± 0.45 |
1.79 ± 2.33 |
−0.41 ± 2.17 |
5 |
compounded and propagated into the indirect computation of the Tx/Em registration parameters.
Both the reversed cross-entropy and symmetric divergence maximization failed to register one MR/Tx and one MR/Em case. This resulted in two Tx/Em cases that could not be registered indirectly for both the techniques. The corresponding means and standard deviations for indirectly registered Tx/Em are listed in Table 10.3. It seems that the reversed cross-entropy and symmetric divergence maximization estimated the z translation parameters more accurately. For the cross-entropy maximization, the large error in the z translation parameter indicates that, among MR/Tx and MR/Em registrations, one overestimates that parameter and the other underestimates that parameter.
The study of cross-entropy, reversed cross-entropy, and symmetric divergence image registration includes two aspects: (1) the determination if the similarity measure is suitable for image registration and (2) how to accurately and robustly find the optimal registration associated with that measure. The lower success rates for the reversed cross-entropy and symmetric divergence techniques when registering MR/Tx and MR/Em are not sufficient to reject them as similarity measures for registration. It may simply indicate that reversed crossentropy and symmetric divergence have a very narrow capture range when used as registration similarity measures. That is, if the initial registration is far away from the optimal registration, it is hard for the iterative optimization routine to converge to an optimal solution. As a matter of fact, the angular registration parameters of MR/Tx and MR/Em can be as large as 30◦ and the translation parameters can be as large as 55 mm. To determine if the failed registrations were caused by the limited capture range, all image pairs were manually registered and the manual results were used as starting points for iterative optimization.