Kluwer - Handbook of Biomedical Image Analysis Vol
.3.pdf188 |
Hernandez,´ Frangi, and Sapiro |
of fatality from 32% to 67% after the hemorrhage [2, 3]. Morbidity rates reach 10.9% due to intra cranial bruise, subsequent recurrent bleeding, hydrocephaly and spasms in the surrounding brain vessels [4].
5.1.2 Planning Endovascular Interventions
The treatment of cerebral aneurysms aims at their complete elimination from the circulation. The traditional surgical technique consists in clipping the aneurysm. In the case of subarachnoid hemorrhage (SAH), early management prevents rebleeding and future rupture. More concretely, it has been observed that an early treatment of the aneurysm reduces the risk of SAH, mortality and morbidity [5]. Nevertheless, the risk of lesions during the intervention is still high in surgically unfavorable locations.
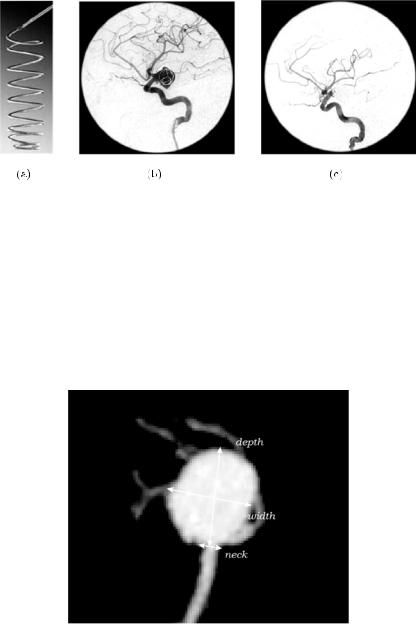
In the past years, there has been a growing trend to practise minimally invasive endovascular procedures to treat cerebral aneurysms [6]. In cases of potential aneurysm rupture, these techniques stabilize the patient and facilitate further aggressive treatments with the purpose of preventing the spasm after intra-cerebral bleeding. Aneurysm coiling with Guglielmi detachable coils (GDC) is probably the most widespread technique for permanent aneurysm embolization. The placement of coils inside the aneurysm promotes blood clotting by electrothrombosis, thus avoiding blood flow and pressure, and hampering its rupture [7]. Figure 5.3 shows a picture of a GDC, and two digital substraction angiographies of a brain aneurysm before and after patient embolization.
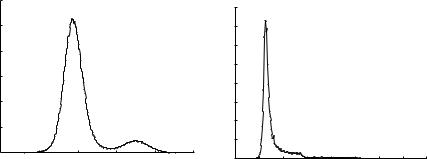
A correct size selection and placement of the GDC inside the aneurysm is crucial for the success of the treatment, for which it is highly desirable to have pre-surgical knowledge of the dimensions as well as from the three-dimensional morphology of the aneurysm and connected vessels. For example, the amount of aneurysm filling following the coiling is strongly dependent on the geometry and dimensions of the aneurysm. In particular, it has been shown that knowledge about the maximum neck diameter and the main axes dimensions of the aneurysm, dome width and depth, play an important role in the selection of patients and materials for an appropriate treatment with GDCs [8]. Figure 5.4 shows the traditional measurements used for the planning of the endovascular procedures.

Quantification of Brain Aneurysm Dimensions |
189 |
Figure 5.3: Process of endovascular embolization with GDCs. (a) An example of GDC. (b) Digital substraction angiography of an embolized aneurysm using GDC coils. Introduction of the GDC inside the aneurysm by catheterization.
(c) Final result of the embolization. The placement of the coil promotes blood clotting inside the aneurysm. The clot avoids blood flow inside the aneurysm as is appreciated in the DSA image. The progressive reduction of intracranial blood flow pressure avoids its rupture.
Figure 5.4: Maximum Intensity Projection (MIP) of a brain aneurysm reconstructed from a CTA image. The measurements of the neck, dome width and depth needed to carry out the selection of the coil size in the endovascular treatment are indicated over the MIP.
190 |
Hernandez,´ Frangi, and Sapiro |
Two-dimensional digital substraction angiography (DSA) is considered the gold standard technique for the detection and quantification of brain aneurysms. However, other less invasive acquisition techniques like Computed Tomography Angiography (CTA) or Magnetic Resonance Angiography (MRA) are also used as complementary methods for these aims [9, 10]. In order to estimate the dimensions of an aneurysm from 3D CTA or MRA, it is customary to perform lineal measurements on Maximum Intensity Projections (MIP) of the original volumetric scan. The MIP provides a 2D image of the 3D data in an angle considered optimal by the neuroradiologist. The optimal viewpoint is chosen so that the magnitudes of interest are maximum. Manual measurements are then carried out on the basis of this 2D image using electronic callipers.
The selection of the optimal view angle, introduces a high degree of subjectivity to the quantification of the aneurysm. Window levelling is often used to enhance the arterial structures of interest thus increasing the subjectivity in the quantification of the aneurysm morphology. In some images, the presence of nearby bony structures imposes restrictions to the selection of the viewpoint. This forces, in some cases, the selection of suboptimal views to perform the measurements. In MIP images, it is often difficult to determine depth relationships between the aneurysm and the surrounding and sometimes overlapping vessels. Therefore, the use of computerized 3D segmentation techniques is crucial for accurate quantification of the aneurysm dimensions as well as for a correct interpretation of the 3D morphology.
5.1.3 Implicit Deformable Models
Many of the recent approaches used to segment vascular structures from medical images use deformable models. The use of implicit deformable models combined with level set methods in arterial structures has become very popular over the last few years. The ability to capture the topology of complex structures makes it a very suitable technique for the extraction of the shape of arterial structures. Loncaric et al. [11] use classic Geodesic Active Contours (GAC) model combined with level set methods in the segmentation of aortic abdominal aneurysms (AAA). However, classic GAC methods are not able to deal with narrow and twisted vessels. To this end, some improvements to the traditional method have been proposed in the literature.
Quantification of Brain Aneurysm Dimensions |
191 |
For example, Lorigo et al. [12, 13] use codimension two GACs for the extraction of the cerebral vasculature. This method successfully obtained a segmentation of the whole tree. However, the final segmentation shows relatively thinner vessels compared to MIP images and thresholding schemes, and the model seems to be not able to capture abnormal vessel lumina.
Other authors propose to combine implicit deformable models with a smart initialization of the evolving surface inside the vessels of interest. Van Bemmel et al. [14, 15], for instance, compute the central axis of the artery and use it as initialization for the GAC model in the segmentation of carotid arteries and the aorta. Deschamps et al. [16] use the output of a vessel enhancement filter [17] as speed for the Fast Marching method for a fast and rough initialization of the model. The evolved surface is used as initialization of the implicit deformable model to obtain a more accurate segmentation.
Classical deformable models depend on the gradient of the image as stopping force. The front in evolution usually suffers from leakage or bleeding in places with weak or inhomogeneous image gradient, and does not provide good results in brain vessels. Since the method of region competition proposed by Zhu and Yuille [18], there have been several efforts to include statistical region-based information in the process of segmentation. Paragios made a wide study about the inclusion of this information in the GAC model [19]. In places with weak gradient, regional information drives the evolution of the front, thus avoiding leakage in the edges of the object of interest. Similar work including statistical information on the implicit model was done by Yezzi et al. [20]. Deschamps successfully used Paragios’ Geodesic Active Regions (GAR) model in the segmentation of brain aneurysms [16].
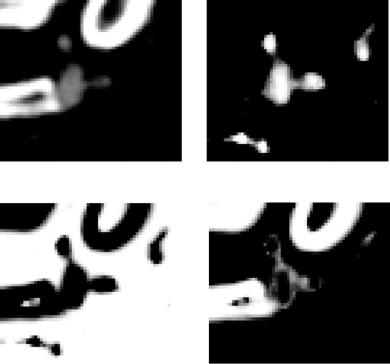
Although a number of algorithms based on implicit deformable models have addressed the problem of cerebral vessels segmentation [13, 16], these do not produce satisfactory results when confronted with images of standard quality in average radiology departments. For example, the work reported by Deschamps [16] deals with rotational angiography (3DRA) where the background and bone tissues have a well differentiated contrast with respect to vessels (Fig. 5.5a). On the other hand, the ranges of vessel and bone intensities in CTA ususally overlap (Fig. 5.5b). Most of the previous attempts to solve this problem have presented segmentation results only on few selected images. Unfortunately, there is a general lack of larger evaluation studies on image databases acquired under routine clinical conditions.

192 |
Hernandez,´ Frangi, and Sapiro |
0.03
0.025
0.02
0.015
0.01
0.005
0 |
−2 |
−1.5 |
−1 |
−0.5 |
0 |
−2.5 |
× 104
(a)
0.08 |
|
|
|
|
|
|
|
|
0.07 |
|
|
|
|
|
|
|
|
0.06 |
|
|
|
|
|
|
|
|
0.05 |
|
|
|
|
|
|
|
|
0.04 |
|
|
|
|
|
|
|
|
0.03 |
|
|
|
|
|
|
|
|
0.02 |
|
|
|
|
|
|
|
|
0.01 |
|
|
|
|
|
|
|
|
0 |
|
|
|
|
|
|
|
|
800 |
1000 |
1200 |
1400 |
1600 |
1800 |
2000 |
2200 |
2400 |
|
|
|
|
(b) |
|
|
|
|
Figure 5.5: (a) Histogram from a 3DRA image of a brain aneurysm. (b) Histogram from a CTA image of a brain aneurysm. In the first case, the distributions from background-bone (intensity values from −20,000 to −10,000 approximately) and vessels (intensity values from
−10,000 to 0) are well differentiated. In the second case, the limit of the distribution from background (intensity values from 1000 to 1200 approximately) is not differentiated from the distributions of vessel (intensity values from 1100 to 1600) and bone (intensity values from 1100 to 2400) that are totally overlapped.
5.1.4 Chapter Outlook
This chapter presents a method to address the problem of brain aneurysm segmentation in CTA images. Due to the limited resolution of CTA brain images, the front is usually not able to evolve through narrow and twisted objects as, for example, the thinnest brain vessels of the Circle of Willis. For this reason, a two-stage algorithm is devised. In the first stage, a fast and rough segmentation of all the tissues present in the image is obtained using a Maximum a posteriori (MAP) classifier. In the second stage, a GAR method is used to obtain the final segmentation with sub-voxel accuracy. The novelty of the method consists in the use of differential image descriptors of high order, and the inclusion of non-parametric information in the GAR model. This is done using a k-Nearest Neighbor (kNN) classifier to estimate the underlying probability density functions of the main tissue types that are present in the CTA images. The result is an algorithm that provides accurate segmentations with very little user intervention in the selection of its parameters.
The method has been evaluated on a database of 39 brain aneurysms placed within the Circle of Willis. The technique is compared against manual measurements of three geometrical descriptors of the aneurysm
Quantification of Brain Aneurysm Dimensions |
193 |
morphology, which are standard in assessing the viability of surgical treatment with GDCs.
The chapter is organized as follows. Section 5.2 introduces the proposed method to address the segmentation of brain aneurysms. Section 5.3 describes the materials and methods used in clinical practise to obtain the measurements for the planning of the endovascular intervention. The procedures for manual and computerized measurements are also described. The evaluation of the computerized technique is reported in section 5.4. Finally, in section 5.5 the results of the evaluation study are discussed and some concluding remarks are made in section 5.6.
5.2 Aneurysm Segmentation
The GAR model includes region-based information into the classical GAC model. This is done using region descriptors, which are defined in terms of the negative logarithm of a Probability Density Function (PDF) associated with the region and the image inside that region. The generation of the PDF for each region, involves the definition of the features that characterize the image inside the region and a suitable PDF estimation technique. Classically, region descriptors were defined using the intensity values of the image inside the region as features, and a Gaussian PDF model [18, 19]. However, higher order information was not used while we argue that it could provide a more complete description of regional properties.
5.2.1 Image Features
A common approach to analyze the local behavior of an image, I(x), is to consider its Taylor expansion in the neighborhood of a point x0 at scale σ
Iσ (x0 + δx0) ≈ Iσ (x0) + δx0T σ I(x0) + δx0T Hσ (x0)δx0 |
(5.1) |
where Iσ , σ I, and Hσ are the image intensity function, the gradient vector, and the Hessian matrix of the image computed after convolution with a Gaussian kernel of scale σ . While the intensity provides information about the tissue properties (i.e., X-ray absorption in CTA), and the norm of the gradient indicates the amount of contrast between neighboring tissues, the second order structure
194 |
Hernandez,´ Frangi, and Sapiro |
provided by the Hessian matrix indicates local curvature and bending [17, 21]. We argue that all this information can be relevant in characterizing a region.
5.2.2Non-parametric Tissue Probability Estimation
Pattern recognition techniques can be used to obtain non-parametric PDF estimators. In this framework, the PDF is computed using classifiers. The estimation is usually done using a sparse set of neighboring samples. For example, the Parzen density estimation method computes the probability for a point x to belong to a region by computing the number of samples belonging to that region in a fixed neighborhood of radius k. The k-Nearest Neighbor (kNN) estimation technique can be interpreted as a Parzen approach with a neighborhood size adjusted automatically depending on the location of the point. It is reasonable to assume that points with similar local image structure belong to the same tissue class. For this reason, we use kNN rule for the generation of the PDF in our algorithm.
The nearest neighbor principle is one of the best studied techniques for pattern classification [22]. A classifier based on this principle uses a training set of vectors as a collection of labelled cases. For a given pattern, it searches for the nearest vector in this learning set according to a given metric. The traditional classification consists in assigning to the pattern the label of the most voted class. Combinations of number of votes (kNN rule) and distances can be also used for classification. A PDF estimation can be derived from these voting systems.
5.2.2.1 Training Set Construction
We use the kNN rule to estimate the probability density function for each tissue class as follows. For the construction of the training set, some representative CTA images are selected from the whole data base. Then, N points are manually picked from these images, and labelled with one of these three tissue classes: vessel, background or bone. A label and a feature vector is associated with each point in the training set. The feature vector is derived from the local differential structure of the image at a small scale σ (Eq. (5.1)). For a point xˆ in the training set, we associate the feature vector
f(xˆ ) = (Iσ , | Iσ |, λ1σ , λ2σ , λ3σ ) |
(5.2) |

Quantification of Brain Aneurysm Dimensions |
195 |
where Iσ represents the convolution of the image with a Gaussian kernel and
Iσ its gradient. The parameters λiσ represent the eigenvalues of the Hessian matrix of the image Iσ , ordered by increasing magnitude.
5.2.2.2 Training Set Normalization
As is classical in pattern recognition theory, the feature vectors of the training set are normalized. We applied the normalization
m f m − µn
fn = n (5.3)
σn
where fnm, µn and σn are the value of the n-th component of the mth feature vector, and the mean and the standard deviation of the nth component over the training set, respectively [23].
5.2.2.3 Probability Density Function Estimation
The kNN rule is used to estimate the underlying PDF as follows. For a given voxel x, the feature vector f(x) is defined as in Eq. (5.2) and normalized as in Eq. (5.3). Then, the k nearest feature vectors are found in the training set according to the Euclidean distance. The probability for a voxel of intensity i to belong to a tissue class C j , is computed from the formula
|
xˆ Lj ∩Nk (x) d(f(x), f(xˆ )) |
|
||
P(I(x) = i|C j ) = |
xˆ |
N |
k (x) d(f(x), f(xˆ )) |
(5.4) |
|
|
|
|
|
where Lj represents the set of points in the training set that belongs to the class
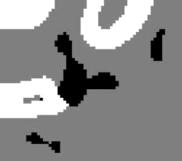
C j , Nk(x) is the set of the k nearest neighbors and d represents the Euclidean distance. Figure 5.6 shows an example of the probability density functions estimated by the kNN rule. In the sequel, C0, C1 and C2 will stand for vessel, background and bone class, respectively.
5.2.3 Maximum A Posteriori Tissue Classification
A MAP tissue classifier is used to obtain a partition of the image domain into regions matching with vessel, background and bone. The probabilities estimated from the kNN rule provide a learned prior probability for a particular voxel to

196 |
Hernandez,´ Frangi, and Sapiro |
(a) |
(b) |
(c) |
(d) |
Figure 5.6: Cross-section of the PDF images estimated by the kNN rule. Brighter areas correspond to higher probabilities. (a) Gray level image. (b–d) Probability for vessel, background and bone, respectively.
belong to a certain class, P(I(x) = i|x C j ). All tissue classes are assumed to be equiprobable.
The Bayes rule is then applied to calculate the posterior probability for a given voxel to belong to a particular class given its intensity, P(C j = c j |I(x) = i). The MAP classifier uses the maximum a posteriori probability estimate after anisotropic smoothing [24] to obtain a classification of the voxels of the image
C |
|
= |
arg |
max |
P |
(C |
j = |
c |
j | |
I(x) |
= |
i) |
(5.5) |
|
j |
c j |
C0 ,C1 ,C2 |
} |
|
|
|
|
|
||||
|
|
|
|
{ |
|
|
|
|
|
|
|
|
where P corresponds to the posterior probabilities after diffusion driven by the equation
∂ P |
= div |
P |
|
|
1/3 |
|
|
|
|
||||
|
|
|
| P| |
(5.6) |
||
∂t |
P |
| |
||||
|
|
| |
|
|
|

Quantification of Brain Aneurysm Dimensions |
197 |
Figure 5.7: Maximum a posteriori classification. Cross-section with the MAP labels. Black corresponds to the vessel tissue, white to bone and gray to the background.
This Partial Differential Equation verifies the Maximum Principle [25]. Therefore, the posteriors remain being probability functions after diffusion. Applying anisotropic diffusion introduces spatial coherence before the MAP decision thus improving the classification results [26]. Figure 5.7 shows one example of the MAP classification. Voxels labelled as vessel are used as initialization of the GAR method introduced in the next section.
5.2.4 Geodesic Active Regions
5.2.4.1 Geodesic Active Contours
Caselles et al. proposed an implicit deformable model known in the literature as Geodesic Active Contours [27]. It conciles Parametric Models and the Level Set Theory. It is based on the idea from geodesic snakes [28] of evolving an initial curve to a local minimum of an energy functional.
The GAC energy functional is defined for surfaces as
E(S) = |
g(S) da |
(5.7) |
where S represents a parametrization of the evolving surface, g is an inverse edge detector function, and da is the surface area element. This energy functional defines a Riemannian Space, with metric associated to the edge detector function g. The geodesic surfaces on this space, are defined by the edges of the image.
To compute the differential equation that drives the evolution of the surface, traditional variational techniques are used. The Euler-Lagrange equation
