

Учебники / Hearing - From Sensory Processing to Perception Kollmeier 2007
.pdfA Nonlinear Auditory Filterbank |
17 |
(a)
SPL) |
100 |
|
80 |
||
(dB |
60 |
|
level |
||
|
||
Signal |
40 |
|
20 |
||
|
Mean
|
|
|
|
|
|
|
|
|
|
|
|
|
|
|
|
|
|
|
|
|
|
|
|
|
|
|
|
|
|
|
|
|
|
|
|
|
|
|
|
|
|
|
|
|
|
|
|
|
|
|
|
|
|
|
|
|
|
|
|
|
|
|
|
|
|
|
|
|
|
|
|
|
|
|
|
|
|
|
|
|
|
|
|
|
|
|
|
|
|
|
|
|
|
|
|
|
|
|
|
|
|
|
|
|
|
|
|
|
|
|
|
20 |
40 |
60 |
|
|
|
80 |
100 |
||||||||
Masker level (dB SPL)
(b) |
|
|
|
|
|
|
|
|
|
|
/ dB |
100 |
|
|
|
|
|
|
|
|
|
90 |
|
|
|
|
|
|
|
|
|
|
thres |
80 |
|
|
|
|
|
|
|
|
|
70 |
|
|
|
|
|
|
|
|
|
|
60 |
|
|
|
|
|
|
|
|
|
|
@ |
|
|
|
|
|
|
|
|
|
|
50 |
|
|
|
|
|
|
|
|
|
|
level |
|
|
|
|
|
|
|
|
|
|
40 |
|
|
|
|
|
|
|
|
|
|
30 |
|
|
|
|
|
|
|
|
|
|
tone |
|
|
|
|
|
|
|
|
|
|
20 |
|
|
|
|
|
|
|
|
|
|
test |
10 |
|
|
|
|
|
|
|
|
|
0 |
|
|
|
|
|
|
|
|
|
|
|
|
|
|
|
|
|
|
|
|
|
|
0 |
10 |
20 |
30 |
40 |
50 |
60 |
70 |
80 |
90 100 |
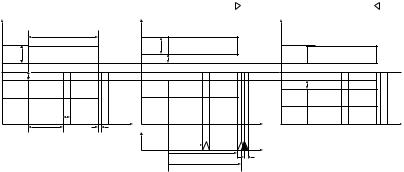
Fig. 4 Upper panel a psychoacoustical upward spread of masking data from Oxenham and Plack (1998). Lower panel b model simulations
4Discussion
The model introduced here is just a prototype implementation of the newly developed idea of an instantaneous frequency detector controlling the gain and compression of specific filterbank channels or positions on the basilar membrane, respectively. In order to model exactly a variety of psychophysical and physiological data with the correct amount of suppression, frequency-specific gain and compression, a comparatively complicated model structure had to be assumed (cf. Fig. 2) where a feedback structure was avoided in order to maintain computational stability. It is not yet clear, however, if this structure or an alternative structure using basically the same elements is most appropriate for predicting also physiological experiments in the same way. Nevertheless, the basic idea of the instantaneous frequency extraction and its control of filterbank channels can be generalized and simplified for applications outside
18 |
V. Hohmann and B. Kollmeier |
“pure” modeling in psychoacoustics and physiology. In speech processing, for example, an instantaneous-frequency-controlled filterbank shows a distinct enhancement of the most “relevant” frequency components of speech and may hence be used for efficient dynamic compression of speech and other wideband signals for hearing-impaired listeners. A key feature of the instantaneous frequency approach is the possibility to extract the instantaneous frequency within a few periods of the channels center frequency using the model assumption of an AM/FM signal. This may be useful for decomposing complex signals into “important” spectral components and “unimportant” ones and may thus help to derive better speech and audio coding strategies based on auditory models.
Acknowledgments. Work supported by BMBF and DFG (Sonderforschungsbereich “Das aktive Gehör”).
References
Duifhuis H (1976) Cochlear nonlinearity and second filter: possible mechanism and implications. J Acoust Soc Am 59:408–423
Duifhuis H (1980) Level effects in psychophysical two-tone suppression. J Acoust Soc Am 67:914–927
Duifhuis H, Hoogstraten HW, van Netten SM, Diependaal RJ, Bialek W (1985) Modelling the cochlear partition with coupled Van der Pol oscillators. In: Allen JB, Hall JL, Hubbard AE, Neely ST, Tubis A (eds) Peripheral auditory mechanisms. Springer, Berlin Heidelberg New York, pp 290–297
Goldstein JL (1988) Updating cochlear driven models of auditory perception: a new model for nonlinear auditory frequency analysing filters. In: Elsendoorn BAG, Bouma H (eds) Working models of human perception. Academic Press, London, pp 19–58
Herzke T, Hohmann V (2005) Effects of instantaneous multi-band dynamic compression on speech intelligibility. EURASIP JASP 2005(18):3034–3043
Meddis R, O’Mard LP, Lopez-Poveda EA (2001) A computational algorithm for computing nonlinear auditory frequency selectivity. J Acoust Soc Am 109:2852–2861
Oxenham AJ, Plack CJ (1998) Suppression and the upward spread of masking. J Acoust Soc Am 104:3500–3510
Talmadge C, Tubis A, Long GR, Piskorski P (1998) Modeling otoacoustic emission and hearing threshold fine structures in humans. J Acoust Soc Am 104:1517–1543
Wersäll J, Flock A, Lundquist P-G (1965) Structural basis for directional sensitivity in cochlear and vestibular sensory receptors. Cold Spring Harbor Symp Quant Biol 30:115–132

3 Estimates of Tuning of Auditory Filter Using Simultaneous and Forward Notched-noise Masking
MASASHI UNOKI, RYOTA MIYAUCHI, AND CHIN-TUAN TAN
1Introduction
The frequency selectivity of an auditory filter system is often conceptualized as a bank of bandpass auditory filters. Over the past 30 years, many simultaneous masking experiments using notched-noise maskers have been done to define the shape of the auditory filters (e.g., Glasberg and Moore 1990; Patterson and Nimmo-Smith 1980; Rosen and Baker, 1994). The studies of Glasberg and Moore (2000) and Baker and Rosen (2006) are notable inasmuch as they measured the human auditory filter shape over most of the range of frequencies and levels encountered in everyday hearing. The advantage of using notched-noise masking is that one can avoid off-frequency listening and investigate filter asymmetry. However, the derived filter shapes are also affected by the effects of suppression.
The tunings of auditory filters derived from data collected in forward masking experiments were apparently sharper than those derived from simultaneous masking experiments, especially when the signal levels are low. The tuning of a filter is commonly believed to be affected by cochlear nonlinearity such as the effect of suppression. In past studies, the tunings of auditory filters derived from simultaneous masking data were wider than those of filters derived from nonsimultaneous (forward) masking data (Moore and Glasberg 1978; Glasberg and Moore 1982; Oxenham and Shera 2003). Heinz et al. (2002) showed that a tuning is generally sharpest when stimuli are at low levels and that suppression may affect tuning estimates more at high characteristic frequencies (CFs) than at low CFs. If the suggestion of Heinz et al. (2002) holds, i.e., if suppression affects frequency changes, comparing the filter bandwidths derived from simultaneous and forward masking experiments would indicate this.
In this study we attempt to estimate filter tunings using both simultaneous and forward masking experiments with a notched-noise masker to investigate how the effects of suppression affect estimates of frequency selectivity across signal frequencies, signal levels, notch conditions (symmetric and asymmetric), and signal delays. This study extends the study of Unoki and Tan (2005).
School of Information Sience, Japan Advanced Institute of Science and Technology, Japan, unoki@jaist.ac.jp, r-miyau@jaist.ac.jp, chintuan@jaist.ac.jp
Hearing – From Sensory Processing to Perception
B. Kollmeier, G. Klump, V. Hohmann, U. Langemann, M. Mauermann, S. Uppenkamp, and J. Verhey (Eds.) © Springer-Verlag Berlin Heidelberg 2007
20 |
M. Unoki et al. |
2 Simultaneous and Forward Masking with Notched-Noise Masker
2.1Methods
A diagram of the stimulus used in our masking experiments is shown in Fig. 1. The signal frequencies (ƒc) were 0.5, 1.0, 2.0, and 4.0 kHz. The notchednoise masker consisted of two bands of white noise where each bandwidth was fixed as 0.4 × ƒc. Under five conditions, the notch was symmetrically placed about ƒc. The values of ∆ƒc / ƒc under these conditions were 0.0, 0.1, 0.2, 0.3, and 0.4 (Fig. 1a). Under four asymmetric conditions, the combinations of the lower and upper ∆ƒc / ƒc s were (0.3, 0.1), (0.4, 0.2), (0.1, 0.3), and (0.2, 0.4), as shown in Fig. 1b,c.
In the masking experiments we used three time conditions: the onsetinterval between the notched-noise masker and probe was 150, 300, and 305 ms, labeled A, B, and C in Fig. 1. Time condition A corresponded to the simultaneous masking, while B and C corresponded to the forward masking. At a fixed probe level, Ps (10, 20, and 30 dB SL), the masker levels, N0, at the masked thresholds were measured for a brief 10-ms signal (5-ms raisedcosine ramps, no steady state) in the presence of a 300-ms masker gated with 15-ms raised-cosine ramps.
Fifteen normal-hearing listeners, aged 21–33, participated in the experiments. Six, seven, and six of them participated in the experiments with time conditions A, B, and C. Four participated under two conditions. The absolute thresholds of all subjects, measured through a standard audiometric tone test using a RION AA-72B audiometer, were 15 dB HL or less for both ears at octave frequencies between 0.125 and 8.0 kHz. All subjects were given at least 2 h of practice.
(a) Symmetrical condition (o) |
(b) asymmetrical condition ( |
) |
(c) asymmetrical condition ( |
) |
|||||||
fu,maxFreq.(Hz) |
|
300 ms |
Freq. (Hz) |
|
|
|
|
Freq. (Hz) |
|
|
|
0.4fc |
N0 |
|
0.4fc |
N0 |
|
|
N0 |
|
|||
|
0.2fc |
|
|
|
|||||||
fu,min |
|
|
Ps |
|
|
Ps |
|
|
Ps |
|
|
|
|
|
|
|
|
|
|
||||
fc |
∆ fc |
|
|
|
|
|
|
|
|||
|
|
|
|
|
|
|
|
|
|
||
fl,max |
|
|
|
|
|
|
|
|
0.2fc |
|
|
|
|
|
|
|
|
|
|
|
|
||
fl,min |
|
|
|
|
|
|
|
|
|
|
|
|
|
|
10 ms |
|
|
|
|
|
|
|
|
|
|
150 ms |
5 ms |
|
|
A |
B |
|
C |
|
Time (s) |
|
|
Level |
|
|
|
|
|||||
|
|
|
|
|
150 ms |
|
|
|
|
|
|
300 ms
305 ms
5 ms
Fig. 1 Stimulus shape and position used in notched-noise masking experiments
Estimates of Tuning of Auditory Filter |
21 |
All stimuli were re-generated digitally at a sampling frequency of 48 kHz and presented via a Tucker-Davis Technologies (TDT) system III real-time processor (TDT RP2). The masker and signal were separately attenuated by two programmable attenuators (TDT PA5) before they were mixed (using TDT SM5) and passed through a headphone buffer (TDT HB7) for presentation. The stimuli were presented monaurally to the subjects in a doublewalled sound-attenuating booth via Etymotic Research ER2 insert earphone. The level of the stimuli were verified using a B&K 4152 Artificial Ear Simulator with a 2-cm3 coupler (B&K DB 0138) and a B&K 2231 Modular Precision Sound Level Meter.
Masked thresholds were measured using a three-alternative forced-choice (3AFC) three-down one-up procedure that tracks the 79.4% point on the psychometric function (Levitt 1970). Three intervals of stimuli were presented sequentially using a 500-ms inter-stimulus interval in each trial. Subjects were required to identify the intervals that carried the probe signals using numbered push-buttons on a response box. Feedback was provided by lighting up the LEDs corresponding to the correct interval on the response box after each trial. A run was terminated after twelve reversals. The step size was 5 dB for the first four reversals and 2 dB thereafter. The threshold was defined as the mean signal level at the last eight reversals. All data in which the masker level at the threshold was over 90 dB SPL were eliminated because they were affected by the compression effect.
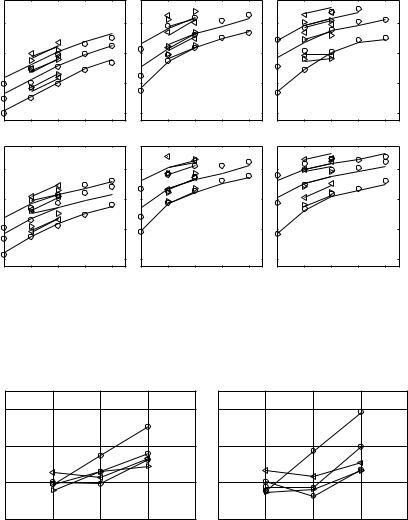
2.2Results and Discussion
The mean masked thresholds for signal frequencies of 1.0 and 2.0 kHz in the three time conditions are plotted in Fig. 2 as functions of the signal levels. Those for 0.5 and 4.0 kHz are omitted here, but the trends of all data were similar. The abscissas of the plots in this figure show the smaller of the two values of ∆ƒc / ƒc. The circles denote the mean masked thresholds under the symmetric notched-noise conditions (Fig. 1a). The triangles pointing to the right ( ∆) denote the mean masked thresholds in the asymmetric notched-noise conditions where ∆ƒc / ƒc for the upper noise band was 0.2 greater than that for the lower noise band (Fig. 1b). The triangles pointing to the left (∆ ) denote the mean masked thresholds under the asymmetric notched-noise conditions where ∆ƒc / ƒc for the lower noise band was 0.2 greater than that for the upper noise band (Fig. 1c). We found that the masked threshold increased as the notch width was increased. We also found that the∆ s were consistently higher than the ∆s. This suggests that the auditory filter shapes were asymmetric, with a steeper high frequency slope.
The slopes of the growth of the masking functions (the variability of the masker level at the threshold in terms of signal levels from 10 to 30 dB SL) for 1.0 and 2.0 kHz under the three time conditions (A, B, and C) are shown
22 |
M. Unoki et al. |
(dB SPL) |
|
(a) Sim. A, 1 kHz |
|
(b) Fwd. B, 1 kHz |
|
(c) Fwd. C, 1 kHz |
||||||||||
80 |
|
|
|
80 |
|
|
|
|
80 |
|
|
|
|
|
||
at threshold |
60 |
|
|
|
60 |
|
|
|
|
60 |
|
|
|
|
|
|
40 |
|
|
|
40 |
|
|
|
|
40 |
|
|
|
|
|
||
level |
|
|
|
|
|
|
|
|
|
|
|
|
||||
|
|
|
|
|
|
|
|
|
|
|
|
|
|
|
||
Masker |
20 |
|
|
|
20 |
|
|
|
|
20 |
|
|
|
|
|
|
|
(d) Sim. A, 2 kHz |
|
(e) Fwd. B, 2 kHz |
|
(f) Fwd. C, 2 kHz |
|||||||||||
(dB SPL) |
|
|
|
|||||||||||||
80 |
|
|
|
80 |
|
|
|
|
80 |
|
|
|
|
|
||
at threshold |
60 |
|
|
|
60 |
|
|
|
|
60 |
|
|
|
|
|
|
40 |
|
|
|
40 |
|
|
|
|
40 |
|
|
|
|
|
||
level |
|
|
|
|
|
|
|
|
|
|
|
|
||||
|
|
|
|
|
|
|
|
|
|
|
|
|
|
|
||
Masker |
20 |
|
|
|
20 |
|
|
|
|
20 |
|
|
|
|
|
|
0 |
0.1 |
0.2 |
0.3 |
0.4 |
0 |
0.1 |
0.2 |
0.3 |
0.4 |
0 |
0.1 |
0.2 |
0.3 |
0.4 |
||
|
||||||||||||||||
|
Relative notch width, D fc/fc |
Relative notch width, D fc/fc |
Relative notch width, D fc/fc |
|||||||||||||
Fig. 2 Mean masked thresholds in masking experiments with three time conditions. A, B, and C, for a–c 1 kHz and d–f 4 kHz. Signal levels were 10, 20, and 30 dB SL
Slope of masking func. (dB/dB)
2
1.5
1
0.5
|
(a) 1 kHz |
|
|
(b) 2 kHz |
|
|
|
|
2 |
|
|
|
|
|
1.5 |
|
|
|
|
|
1 |
|
|
A |
B |
C |
A |
B |
C |
|
0.0 |
5.0 (ms) |
0.5 |
0.0 |
5.0 (ms) |
|
|
Fig. 3 Mean slope of growth of masking function under three conditions: simultaneous
(A) and forward masking (B and C) for a 1.0 kHz and b 2.0 kHz
in Fig. 3. The thick, medium, and thin solid lines show the slopes under the symmetric notch conditions (º) of 0.0, 0.1, and 0.2. The dotted and dashed lines show the slope under the asymmetric conditions ( ∆and∆ ) of 0.1. The slope under the∆ -notch condition is greater than that under the ∆-notch condition. In addition, the slope in C is greater than those in A and B. These results suggest that filter non-linearity such as compression tended to occur
Estimates of Tuning of Auditory Filter |
23 |
as the signal was delayed under the three time conditions (A, B, and C) and that the decayed lower notched-noise components still might affect the masking as suppressive masking in the condition C.
3Estimation of the Filter Tuning
The most common method for estimating auditory filter shape is the roex filter model based on the power spectrum model of masking. The current form was proposed by Glasberg and Moore (2000). This model can be used to account precisely for simultaneous masking. It may be used to estimate the filter shape from forward masking as a pilot test. However, it does not suitably account for forward masking with a complex or noise masker because it cannot separately deal with excitatory and suppressive masking (Wojtczak and Viemeister 2004).
We used the parallel roex filter (Unoki et al. 2006) to estimate the filter shape and tuning under the three time conditions as an alternative method. Because this model consists of a passive tail roex and an active tip roex with the schematic I/O function used by Glasberg and Moore (2000), this can deal with the above problem. The internal level, Prxp, is determined as the output of the passive tail filter (t), and then the active tip filter (p) varies with this level. The parallel roex filter is characterized by five parameters (tl,
tu, pl, pu, and Gmax). Another two non-filter parameters (efficiency, K, and absolute threshold, P0) are used in the power spectrum model. These
parameters are represented as a function of the normalized ERBN-rate, Eƒ = ERBN - rate(ƒ)/ERBN - rate(1 kHz) − 1, and were determined by using the refined fitting procedure used by Unoki et al. (2006) on masking data with the three time conditions. This fitting procedure also included the outer and the effect of transmission in precochlear processing, MidEar correction (Glasberg and Moore 2000) and the effect of off-frequency listening (Patterson and Nimmo-Smith 1980). In this fitting procedure, as the revised point, we incorporated a decay function (a leaky integrator) into the level estimator. Because the masker level (N0) that approached to the signal position should be decayed drastically in the forward masking (B and C in Fig. 1), whereas the masker level was constant at the signal position in the simultaneous masking (A in Fig. 1). Thus, the reduction of the masker levels under time conditions B and C were 16.3 dB and 42.0 dB by the decay function. These values were, then, used in the power spectrum model. The parameters were optimized by minimizing the root mean square (rms) error between the masked thresholds and the predicted thresholds.
The optimized values for the five parameters of the parallel roex auditory filters and the rms errors, fitted to masking data corrected under the three time conditions, are shown in Table 1. The thresholds predicted using the parallel roex filter are plotted in Fig. 2 (solid lines for circles, dashed lines for
24 |
|
|
|
|
M. Unoki et al. |
|
Table 1 Filter coefficients of parameters and rms errors in fit |
|
|
||||
|
|
|
|
|
|
|
Condition |
tl |
tu |
Gmax |
pl |
pu |
rms (dB) |
A. Simulta-neous |
10.8 |
81.6 |
29.1 |
33.8 |
25.8 |
2.38 |
|
|
|
−0.988Eƒ |
+0.006Pprx |
|
|
B. Forward (0 ms) |
11.8 |
82.7 |
24.1 |
26.2 |
48.8 |
2.80 |
|
|
|
−7.11Eƒ |
+0.149 Pprx |
−0.140 Pprx |
|
C. Forward (5 ms) |
9.05 |
132 |
19.8 |
34.8 |
72.8 |
2.27 |
|
|
|
+0.121Eƒ |
−0.050 Pprx |
−0.227 Pprx |
|
|
|
|
|
|
|
|
Filter gain (dB)
Filter gain (dB)
10
0
−10
−20
−30
−40
−50 10
0
−10
−20
−30
−40
−50
10 dB SL
30 dB SL
Simult. masking (A)
Forward masking (B)
Forward masking (C)
500 |
1k |
2k |
4k |
Frequency (Hz)
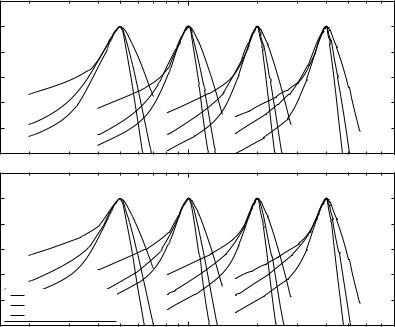
Fig. 4 Auditory filter shapes with center frequencies between 0.5 and 4.0 kHz, derived from mean threshold data in three masking experiments (A, B, and C)
∆ s, and dotted lines for ∆s). The shapes of the derived filters centered at the signal frequencies of 0.5, 1.0, 2.0, and 4.0 kHz are plotted in Fig. 4 as a function of the signal level (10 and 30 dB SL). All the parallel roex filters can be excellently fitted to the simultaneous and forward masking data. Under the three time conditions, we found that the skirts of filters on the higher side for B and C are somewhat steeper than those of A. However, the tail slopes on the
Estimates of Tuning of Auditory Filter |
|
|
|
25 |
||
|
Table 2 Means of the filter bandwidths of parallel roex filter at lower levels |
|
|
|||
|
|
|
|
|
|
|
|
Condition \ ƒc (Hz) |
500 |
1000 |
2000 |
4000 |
|
|
|
|
|
|
|
|
|
ERBN (Glasberg and Moore 1990) |
79 |
133 |
241 |
456 |
|
|
A. Simultaneous masking |
81 |
136 |
248 |
471 |
|
|
B. Forward masking (no silence) |
66 |
112 |
204 |
392 |
|
|
C. Forward masking (5 ms delay) |
61 |
97 |
175 |
330 |
|
|
|
|
|
|
|
|
lower side of B and C are somewhat shallower than those of A. Remaining lower notched-noise components may affect this.
The mean equivalent rectangular bandwidth (ERB)s of the derived auditory filter shape as shown in Fig. 4 under the three conditions are shown in Table 2. The results show that the tuning of the derived filter using forward masking (B and C) is somewhat sharper than that using simultaneous masking (A). The ratios of ERBN (Glasberg and Moore 1990) to the ERBs in C for 0.5–−4.0 kHz are 1.30, 1.37, 138, and 1.38. The tuning of the derived filter from forward masking have became sharper as the signal frequency was increased and/or the signal was delayed (A, B, and C). In addition, when the signal level was increased in dB SL, the ERBs estimated from the forward masking data are still sharper.
4Conclusions
We estimated filter tuning using both simultaneous and forward masking with a notched-noise masker as functions of signal frequencies (0.5, 1.0, 2.0, and 4.0 kHz), signal levels (10, 20, and 30 dB SL), notched-noise conditions (five symmetric and four asymmetric), and the time conditions (A, B, and C in Fig. 1). Auditory filter shapes were derived under these conditions using the parallel roex filter.
The results suggest that the tunings of the auditory filters derived from the forward masking data were considerably sharper than those derived from the simultaneous masking data. The tunings of the auditory filters became much sharper as the center frequency was increased (ratios of 1.30 to 1.38). However, the difference between the tunings of the auditory filters at lower center frequencies in using both maskings tended to be smaller than that at higher center frequencies. It may be affected by remaining effects of suppression due to the decayed lower notched-noise components below the signal frequency.
Acknowledgments. This work was supported by special coordination funds for promoting science and technology (supporting young researchers with fixed-term appointments).
26 |
M. Unoki et al. |
References
Baker RJ, Rosen S (2006) Auditory filter nonlinearity across frequency using simultaneous notched-noise masking. J Acoust Soc Am 119:454–462
Glasberg BR, Moore BCJ (1982) Auditory filter shapes in forward masking as a function of level. J Acoust Soc Am 71:946–949
Glasberg BR, Moore BCJ (1990) Derivation of auditory filter shapes from notched-noise data. Hear Res 47:103–138
Glasberg BR, Moore BCJ (2000) Frequency selectivity as a function of level and frequency measured with uniformly exciting noise. J Acoust Soc Am 108:2318–2328
Heinz MG, Colburn HS, Carney LH (2002) Quantifying the implications of nonlinear cochlear tuning for auditory filter estimates. J Acoust Soc Am 111:996–1101
Levitt H (1970) Transformed up-down methods in psychoacoustics. J Acoust Soc Am 49:467–477
Moore BCJ, Glasberg BR (1978) Psychophysical tuning curves measured in simultaneous and forward masking. J Acoust Soc Am 63:524–532
Oxenham AJ, Shera CA (2003) Estimates of human cochlear tuning at low levels using forward and simultaneous masking. J Assoc Res Otolaryngol 4:541–554
Patterson RD, Nimmo-Smith I (1980) Off-frequency listening and auditory filter asymmetry. J Acoust Soc Am 67:229–245
Rosen S, Baker RJ (1994) Characterising auditory filter nonlinearity. Hear Res 73:231–243 Unoki M, Tan C-T (2005) Estimates of auditory filter shape using simultaneous and forward
notched-noise masking. Forum Acust Budapest 1497–1502
Unoki M, Irino T, Glasberg BR, Moore BJC, Patterson RD (2006) Comparison of the roex and gammachirp filters as representations of the auditory filter. J Acoust Soc Am 120:1474–1492 Wojtczak M, Viemeister NF (2004) Mechanisms of forward masking. J Acoust Soc Am 115:2599(A)