

Учебники / Hearing - From Sensory Processing to Perception Kollmeier 2007
.pdf208 |
B.G. Shinn-Cunningham et al. |
Fig. 1 Example spectrograms of a target birdsong and one of each of the three types of maskers
noise with spectral content matching the bird songs), 2) modulated noise (song-shaped noise multiplied by the envelope of a chorus), and 3) chorus (random combinations of three unfamiliar birdsongs).
These maskers were chosen to elicit different forms of interference. Although the noise is qualitatively different from the targets, its energy is spread evenly through time and frequency so that its spectrotemporal content overlaps all target features. The chorus is made up of birdsong syllables that are statistically identical to target song syllables; however, the chorus is relatively sparse in time-frequency. The modulated noise falls between the other maskers, with gross temporal structure like the chorus but dissimilar spectral structure.
Past studies demonstrate that differences in masker statistics cause different forms of perceptual interference. A convenient method for differentiating the forms of interference present in a task is to test performance for co-located and spatially separated target and maskers. We recently examined spatial unmasking in human listeners for tasks involving the discrimination of bird song targets in the presence of the maskers described above (Best et al. 2005). Results show that spatial unmasking in the noise and modulated noise conditions is fully explained by acoustic better-ear effects. However, spatial separation of target and chorus yields nearly 15 dB of additional improvement beyond any acoustic better-ear effects, presumably because differences in perceived location allow listeners to focus attention on the target syllables and reduce central confusions between target and masker. Here we describe extensions to this work, measuring behavioral and neural discrimination performance in zebra finches when target and maskers are co-located.
Behavioral and Neural Identification of Birdsong under Several Masking Conditions |
209 |
3Human and Avian Psychophysics
Five human listeners were trained to identify the songs of five zebra finches with 100% accuracy in quiet, and then asked to classify songs embedded in the three maskers for target-to-masker energy ratios (TMRs) between −40 and +8 dB. Details can be found in Best et al. (2005).
Four zebra finches were trained using operant conditioning procedures to peck a left (or right) key when presented with a song from a particular individual bird. For symmetry, songs from six zebra finches were used as targets, so that avian subjects performed a categorization task in which they pecked left for three of the songs and right for the remaining three (with the category groupings randomly chosen for each subject). Subjects were trained on this categorization task in quiet until performance reached asymptote (about 85–90% correct after 30–35 100-trial training sessions). Following training, the birds were tested with all three maskers on the target classification task at TMRs from −48 to +60 dB.
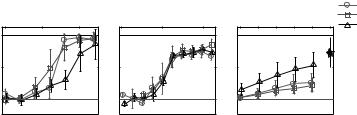
Figure 2 shows psychometric functions (percent correct as a function of TMR) for the human and avian subjects (left and middle panels, respectively; the right panel shows neural data, discussed in Sect. 4). At the highest TMRs, both human and avian performance reach asymptote near the accuracy obtained during training with targets in quiet (100% for humans, 90% for birds). More importantly, results show that human performance is above chance for TMRs above −16 dB, but avian performance does not exceed chance until the TMR is near 0 dB. On this task, humans generally perform better than their avian counterparts. This difference in absolute performance levels could be due to a number of factors, including differences between the two species’ spectral and temporal sensitivity (Dooling et al. 2000) and differences in the a priori knowledge available (e.g., human listeners knew explicitly that a masker was present on every trial).
|
|
Human |
|
|
Zebra Finch |
|
Zebra Finch |
Noise |
|
|
|
Psychophysics |
|
Psychophysics |
|
Neurophysiology |
Mod Noise |
||
|
100 |
|
|
100 |
|
|
100 |
|
Chorus |
Correct |
|
|
|
|
|
|
|||
|
|
|
|
|
|
|
|
clean |
|
|
|
|
|
|
|
|
|
|
|
|
60 |
|
|
75 |
|
|
60 |
|
targets |
Percent |
|
|
|
|
|
|
|||
20 |
|
|
50 |
|
performance |
20 |
|
|
|
|
|
|
|
|
|
chance |
|
|
|
|
−40 |
−20 |
0 |
−50 |
0 |
50 |
−10 |
−5 0 5 10 |
|
|
|
TMR (dB) |
|
|
TMR (dB) |
|
TMR (dB) |
|
|
Fig. 2 Mean classification performance as a function of TMR in the presence of the three maskers for humans, zebra finches, and Field L neurons. Each panel is scaled vertically to cover the range from chance to perfect performance (also note different TMR ranges)
210 |
B.G. Shinn-Cunningham et al. |
Comparison of the psychometric functions for the three different maskers reveals another interesting difference between the human and avian listeners. At any given TMR, human performance is poorest for the chorus, whereas the avian listeners show very similar levels of performance for all three maskers. In the previous study (Best et al. 2005) poor performance with the chorus masker was attributed to difficulties in segregating the spectrotemporally similar target and masker. Consistent with this, performance improved dramatically with spatial separation of target and chorus masker (but not for the two kinds of noise masker). The fact that the birds did not exhibit poorer performance with the chorus masker than the two noise maskers in the co-located condition may reflect the birds’ better spectrotemporal resolution (Dooling et al. 2000), which enable them to segregate mixtures of rapidly fluctuating zebra finch songs more easily than humans do.
For humans, differences in the forms of masker interference were best demonstrated by differences in how spatial separation of target and masker affected performance for the chorus compared to the two noise maskers. Preliminary results from zebra finches suggest that spatial separation of targets and maskers also improves avian performance, but we do not yet know whether the size of this improvement varies with the type of masker as it does in humans.
4Avian Neurophysiology
Extracellular recordings were made from 36 neural sites (single units and small clusters) in Field L of the zebra finch forebrain (n = 7) using standard techniques (Sen et al. 2001). Neural responses were measured for “clean” targets (presented in quiet), the three maskers (each presented in quiet), and targets embedded in the three maskers. In the latter case, the TMR was varied (by varying the intensity of the target) between −10 dB and +10 dB.
The ability of sites to encode target song identity was evaluated. Responses to clean targets were compared to the spike trains elicited by targets embedded in the maskers. A spike-distance metric that takes into account both the number and timing of spikes (van Rossum 2001; Narayan et al. 2006) was used to compare responses to targets embedded in maskers to each of the clean target responses. Each masked response was classified into a target song category by selecting the target whose “clean” response was closest to the observed response. Percent-correct performance in this one-in-five classification task (comparable to the human task) was computed for each recording site, with the temporal resolution of the distance metric set to give optimal classification performance.
The recorded spike trains were examined for additions and deletions of spikes (relative to the response to the target in quiet) by measuring firing rates within and between target song syllables. Each target song was temporally hand-labeled to mark times with significant energy (within syllable) and temporal gaps (between syllable). The average firing rates in the clean and
Behavioral and Neural Identification of Birdsong under Several Masking Conditions |
211 |
masked responses of each site were then calculated separately for the within and between syllable portions of the spike-train responses. In order to account for the neural transmission time to Field L, the hand-labeled classifications of the acoustic waveforms were delayed by 10 ms to align them better with the neural responses.
The across-site average of percent-correct performance is shown in Fig. 2 (right panel) as a function of TMR for each of the three maskers. In general, as suggested by the mean data, single-site classification performance improves with increasing TMR for all sites, but did not reach the level of accuracy possible with clean responses, even at the largest TMR tested (+10 dB TMR; rightmost data point). Strikingly, performance with the chorus was better than with either noise masker. This implies that, for the singlesite neural representation in Field L, the spike trains in response to a target embedded in a chorus are most similar (in a spike-distance-metric sense) to the responses to the clean targets. The fact that zebra finch behavioral data are similar for chorus and noise maskers suggests that the main interference caused by the chorus arises at a more central stage of neural coding (e.g., due to difficulties in segregating the target from the chorus masker).
As in the human and avian psychophysical results, overall percent correct performance for a given masker does not give direct insight into how each masker degrades performance. Such questions can only be addressed by determining whether the form of neural interference varies with masker type. We hypothesized that maskers could: 1) suppress information-carrying spikes by acoustically masking the target content (causing spike deletions), and/or 2) generate spurious spikes in response to masker energy at times that the target alone would not produce spikes (causing spike additions). Furthermore, we hypothesized that the: 1) spectrotemporally dense noise would primarily cause deletions, particularly at low TMRs, because previous data indicate that constant noise stimuli typically suppress sustained responses and the noise completely overlaps any target features in time/frequency; 2) temporally sparse modulated noise would primarily cause additions, as the broadband temporal onsets in the modulated noise were likely to elicit spikes whenever they occurred; and 3) the spectrotemporally sparse chorus was also likely to cause additions, but fewer than the modulated noise, since not all chorus energy would fall within a particular site’s spectral receptive field.
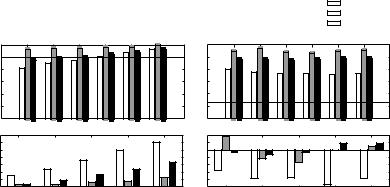
Figure 3 shows the analysis of the changes in firing rates within and between target syllables. The patterns of neural response differ with the type of masker, supporting the idea that different maskers cause different forms of interference.
Firing rates for the modulated noise masker (grey bars in Fig. 3) are largest overall, and are essentially independent of both target level and whether or not analysis is within or between target syllables. This pattern is consistent with the hypothesis that the modulated noise masker causes neural additions (i.e., the firing rate is always higher than for the target alone). The noise masker (black bars in Fig. 3) generally elicits firing rates lower than the modulated noise but greater than the chorus (compare black bars to grey and white bars).
212 |
B.G. Shinn-Cunningham et al. |
|||||
|
|
|
|
|
|
|
|
|
|
|
|
Chorus |
|
Within |
Between |
|
|
|
ModNoise |
|
|
||||||
|
||||||
Syllables |
Syllables |
|
|
|
Noise |
|
|
|
|||||
|
|
|||||
|
|
|
Target alone |
|
||
|
|
|
|
|
|
|
|
|
|
|
|
|
|
|
Rate (spike/s) |
120 |
|
|
|
|
120 |
|
|
|
|
Mean Firing |
100 |
|
|
|
|
100 |
|
|
|
|
|
80 |
|
|
|
|
80 |
|
|
|
|
||
60 |
|
|
|
|
60 |
|
|
|
|
||
40 |
|
|
|
|
40 |
|
|
|
|
||
20 |
|
|
|
|
20 |
|
|
|
|
||
|
|
0 |
−5 |
0 |
5 |
10 |
0 |
−5 |
0 |
5 |
10 |
|
|
no target −10 |
no target−10 |
re:Rate∆no |
(spike/s)target |
30 |
|
|
|
|
|
2 |
|
|
|
|
|
|
|
|
|
|
|
|
|
|
|
||
|
|
20 |
|
|
|
|
|
2 |
|
|
|
|
|
|
10 |
|
|
|
|
|
6 |
|
|
|
|
|
|
0 |
−10 |
−5 |
0 |
5 |
10 |
10 |
−5 |
0 |
5 |
10 |
|
|
|
−10 |
TMR (dB) |
TMR (dB) |
Fig. 3 Analysis of firing rates within and between target song syllables. Top panels show average rates as a function of TMR for each masker (line shows results for target in quiet). Bottom panels show changes in rates caused by addition of the target songs (i.e., relative to presentation of the masker alone)
Within syllables, the firing rate in the presence of noise is below the rate to the target alone at low TMRs and increases with increasing target intensity (see black bars in the top left panel of Fig. 3 compared to the solid line). This pattern is consistent with the hypothesis that the noise masker causes spike deletions. Finally, responses in the presence of a chorus are inconsistent with our simple assumptions. Within target syllables at low TMRs, the overall firing rate is below the rate to the target alone (i.e., the chorus elicits spike deletions; white bars in the top left panel of Fig. 3). Of particular interest, between syllables, there are fewer spikes when the target is present than when only the chorus masker is present (i.e., the target causes deletions of spikes elicited by the chorus; e.g., the white bars in the bottom right panel of Fig. 3 are negative).
In summary, the general trends for the noise and the modulated noise maskers are consistent with our hypotheses, i.e., we observe deletions for the noise at low TMRs and the greatest number of additions for the modulated noise. However, the results for the chorus are surprising. While we hypothesized that the chorus would cause a small number of additions, instead we observe nonlinear interactions, where the targets suppress responses to the chorus, and vice versa.
5Conclusions
In order to communicate effectively in everyday settings, both human and avian listeners rely on auditory processing mechanisms to ensure that they can: 1) hear the important spectrotemporal features of a target signal, and 2) segregate it from similar competing sounds.
Behavioral and Neural Identification of Birdsong under Several Masking Conditions |
213 |
The different maskers used in these experiments caused different forms of interference, both perceptually (as measured in human behavior) and neurally (as seen in the pattern of responses from single-site recordings in Field L). Equating overall masker energy, humans have the most difficulty identifying a target song embedded in a chorus. In contrast, for the birds, all maskers are equally disruptive, and in Field L, the chorus causes the least disruption. These avian behavioral and physiological results suggest that species specialization enables the birds to segregate and identify an avian communication call target embedded in other bird songs more easily than humans can. Neither human nor avian listeners performed as well in the presence of the chorus as might be predicted by the single-site neural responses (which retained more information in the presence of the chorus than the two noise maskers). However, the neural data imply that there is a strong non-linear interaction in neural responses to mixtures of target songs and a chorus.
Human behavioral results suggest that identifying a target in the presence of spectrotemporally similar maskers causes high-level perceptual confusions (e.g., difficulties in segregating a target song from a bird song chorus). Moreover, such confusion is ameliorated by spatial attention (Best et al. 2005). Consistent with this, neural responses are degraded very differently by the chorus (i.e., there are significant interactions between target and masker responses) than by the noise (which appears to cause neural deletions) or the modulated noise (which causes neural additions). Future work will explore the mechanisms underlying the different forms of interference more fully, including gathering avian behavioral data in spatially separated conditions to see if spatial attention aids performance in a chorus masker more than in noise maskers. We will also explore how spatial separation of target and masker modulates the neurophysiological responses in Field L. Finally, we plan on developing an awake, behaving neurophysiological preparation to explore the correlation between neural responses and behavior on a trial-to-trial basis and to directly test the importance of avian spatial attention on behavioral performance and neural responses.
Acknowledgments. This work is supported in part by grants from the Air Force Office of Scientific Research (BGSC), the National Institutes of Health (KS and BGSC), the Deafness Research Foundation (MLD) and the Office of Naval Research (BGSC).
References
Best V, Ozmeral E, Gallun FJ, Sen K, Shinn-Cunningham BG (2005) Spatial unmasking of birdsong in human listeners: Energetic and informational factors. J Acoust Soc Am 118:3766–3773
Darwin CJ, Hukin RW (2000) Effectiveness of spatial cues, prosody, and talker characteristics in selective attention. J Acoust Soc Am 107:970–977
214 |
B.G. Shinn-Cunningham et al. |
Dooling RJ, Lohr B, Dent ML (2000) Hearing in birds and reptiles. In: Popper AN, Fay RR (eds) Comparative hearing: birds and reptiles. Springer, Berlin Heidelberg New York
Freyman RL, Balakrishnan U, Helfer KS (2001) Spatial release from informational masking in speech recognition. J Acoust Soc Am 109:2112–2122
Narayan R, Grana GD, Sen K (2006) Distinct time-scales in cortical discrimination of natural sounds in songbirds. J Neurophys [epub ahead of print; doi: 10.1152/jn.01257.2005]
Sen K, Theunissen FE, Doupe AJ (2001) Feature analysis of natural sounds in the songbird auditory forebrain. J Neurophys 86:1445–1458
van Rossum MCW (2001) A novel spike distance. Neural Comp 13:751–763
Zurek PM (1993) Binaural advantages and directional effects in speech intelligibility. In: Studebaker G, Hochberg I (eds) Acoustical factors affecting hearing aid performance. College-Hill Press, Boston, MA

24 Near-Threshold Auditory Evoked Fields
and Potentials are In Line with the Weber-Fechner Law
BERND LÜTKENHÖNER, JAN-STEFAN KLEIN, AND ANNEMARIE SEITHER-PREISLER
1Introduction
According to the Weber-Fechner law, the relationship between sound pressure and perceived loudness should be logarithmic. However, psychoacoustic data do not support this law. Instead, it is widely accepted now that intensity and loudness are approximately related by a power law such that a doubling in loudness roughly requires a tenfold increase in intensity (Stevens 1955). The power law is not applicable at low intensities, though: Extrapolation of the function derived for higher intensities leads to a considerable overestimation of the loudness at threshold (see, e.g., the compilation of data in Buus et al. 1998).
The physiological basis of loudness perception is only partially understood. Fletcher and Munson (1933) postulated that loudness is proportional to the number of nerve impulses per second reaching the brain along all the excited nerve fibers. More recent studies (e.g. Relkin and Doucet 1997) showed the limitations of this old concept. Nevertheless, the fact remains that the overall activity of the auditory pathways is, over a wide range, a monotonous function of stimulus intensity, and it still appears plausible to assume that related measures, such as the amplitudes of far-field evoked potentials, reflect aspects of loudness coding, at least qualitatively. This holds especially for low intensities, where cochlear compression and factors such as saturation and non-monotonous rate intensity functions of neurons are less relevant than at higher intensities. Here, we investigated the intensity dependence of wave V of the brainstem auditory evoked potential (BAEP) and, as a measure of the cortical activation, wave N100m of the auditory evoked field (AEF). We will show that, at low sound intensities, both responses are basically in line with the Weber-Fechner law.
2Methods
In a first study (Klein 2006), we recorded the AEF in response to 1-kHz tonebursts of 120 ms duration (including 10 ms for both rise and fall). The measurements were carried out in a magnetically shielded room using a 37-channel
ENT Clinic, Münster University Hospital, Münster, Germany, lutkenh@uni-muenster.de
Hearing – From Sensory Processing to Perception
B. Kollmeier, G. Klump, V. Hohmann, U. Langemann, M. Mauermann, S. Uppenkamp, and J. Verhey (Eds.) © Springer-Verlag Berlin Heidelberg 2007
216 |
B. Lütkenhöner et al. |
axial gradiometer system (for details see Lütkenhöner and Steinsträter 1998). The auditory threshold (0 dB sensation level, SL) was defined as the intensity where the subject detected about 30% of the presented stimuli. It was determined while the subject was in its final measurement position. During the AEF measurements, the stimuli were presented at intervals randomized between 1.2 and 1.8 s (mean: 1.5 s). Most of the recording time was devoted to intensities below 10 dB SL. All in all, about 9000 stimuli were presented, 600 at the highest intensity (40 dB SL) and 2400 at the lowest intensity (2 dB SL). The total measurement time was subdivided into six sessions (two per day). The data of each session were reduced to a current dipole (for technical details see Lütkenhöner et al. 2003). The time courses of the dipole moments were finally averaged over all sessions, separately for each intensity. In what follows, we will consider only the grand average of our five subjects.
In a second study, we recorded the BAEP elicited by a 4-kHz tone pulse (effective duration of about 1 ms). The stimuli were transmitted by a short plastic tubing (length of 25 cm) from an electrically shielded headphone to an earplug in the subject’s right ear. The investigation was done in an anechoic chamber so that the threshold could be determined more reliably than in the first study. It was estimated using a two-interval two-alternative forced-choice procedure that was combined with a transformed up-down method converging to p = 0.794 (Levitt 1971). The two intervals (each having a duration of 4 s, test stimulus in the middle of one of them) were marked by three weak 250-Hz tone pips. The sequence was preceded (gap of 500 ms) by a weak 500-Hz tone pip that served as an alarm signal. The standard test stimulus was a sequence of five 4-kHz tone pips presented at 500-ms intervals. The threshold for this sequence will be referred to as 0 dB SL1 (the subscript indicates that this is basically the threshold for a single tone pulse, because significant temporal integration in the auditory periphery is not to be expected for the five pulses). The BAEP was recorded between vertex and right and left earlobe, respectively. Here we will present only data from the most extensively studied subject (the first author). In this subject, more than one million stimulus repetitions were achieved for eight intensities between 11 and −3 dB SL1. Although the stimuli were presented with a high repetition rate (intervals of 16 ms), the overall measurement time was exorbitant. Thus, this experiment could be realized only because the subject did part of his desk work (e.g. reviewing manuscripts, reading doctoral theses) in the anechoic chamber while being measured, over a period of several months. Here, we will confine ourselves to the dominant peak in the response, wave V.
3Results
3.1Auditory Evoked Field (AEF)
Figure 1 shows how the AEF time course changes with decreasing stimulus intensity. At the highest intensity (40 dB SL), three peaks can be recognized: a small positive peak around 50 ms (P50m), a pronounced negative peak

Near-Threshold Auditory Evoked Fields and Potentials |
217 |
Fig. 1 Auditory evoked field (AEF) in response to a 1-kHz toneburst of 120 ms duration (grand average of five subjects). The stimulus intensities were 2 (thickest curve), 4, 6, 8, 10 (thick curves), 15, 20, 30, and 40 dB SL. The amplitude of the dominant peak (N100m) decreases with
-
decreasing intensity, while the latency increases (Lütkenhoner and Klein, 2007)
around 100 ms (N100m), and a second positive peak around 200 ms (P200m). We will consider only the N100m.
Figure 2A shows that, for intensities below 20 dB SL, the N100m amplitude is approximately a linear function of the stimulus intensity in dB. Thus, if the dB value is denoted as x and the N100m amplitude as y, we may write
y = α :(x−x0). |
(1) |