

Учебники / Hearing - From Sensory Processing to Perception Kollmeier 2007
.pdfRole of Peripheral Nonlinearities in Comodulation Masking Release |
123 |
OFM. For all combinations of level and centre frequency of the FB the CMR is similar for the fringe and the synchronous condition, i.e. the CMR was not eliminated by introducing a gating asynchrony between the OFM and the FB as found in Dau et al. (2005) for widely spaced masker components.
The failure to find an effect of onset asynchrony between FB and OFM might be due to differences in the stimulus parameters. Dau et al. (2005) used more FBs with the same onand offset which may enhance the impression of two objects (FBs and OFM) with different gating. In addition the present study investigated CMR with levels of the FB higher than that of the OFM where suppression is likely to occur. In contrast, all masker components had the same level in Dau et al. (2005).
5Summary and Conclusions
CMR was measured and predicted with a various combinations of level and centre frequency of OFM and FB. The results and conclusions can be summarized as follows:
1.CMR decreased with increasing spectral distance between OFM and FB and increased with increasing level of the FB. A CMR of up to 6 dB could still be observed for the FB centred six octaves below the OFM. For an FB higher in frequency than the OFM CMR was considerably smaller than for an FB at the same spectral distance below the OFM.
2.The suppression model predicted the CMR for high FB levels over several octaves but underestimated the CMR for lower FB levels and also the asymmetry between FBs spectrally above and below the OFM.
3.The simulations indicate that even for large spectral distances between the masker components within-channel cues may still play a role in CMR experiments. The failure to eliminate CMR by introducing an onset asynchrony between the masker components further supported this hypothesis.
Acknowledgments. The present work was supported by the DFG. We would like to thank Bastian Epp and Sarah-Charlotta Heidorn for their assistance with the data collection.
References
Breebaart J, van de Par S, Kohlrausch A (2001) Binaural processing model based on contralateral inhibition. I. Model structure. J Acoust Soc Am 110:1074–1088
Cohen MF (1991) Comodulation masking release over a three octave range. J Acoust Soc Am 90:1381–1384
124 |
J.L. Verhey and S.M.A. Ernst |
Dau T, Ewert SD, Oxenham AJ (2005) Effects of concurrent and sequential streaming in comodulation masking release. In: Pressnitzer D, de Cheveigne A, McAdams S, Collet L (eds) Physiology, psychoacoustics and models. Springer, Berlin Heidelberg New York, pp 335–341 Ernst SMA, Verhey JL (2005) Comodulation masking release over a three octave range. Acta
Acust united with Acust 91:998–1006
Grose JH, Hall JW (1993) Comodulation masking release: is comodulation sufficient? J Acoust Soc Am 93:2896–2902
Meddis R, O’Mard LP, Lopez-Poveda EA (2001) A computational algorithm for computing nonlinear auditory frequency selectivity. J Acoust Soc Am 109:28522861
Oxenham AJ (2001) Forward masking: adaptation or integration. J Acoust Soc Am 109:732–741 Oxenham AJ, Plack CJ (1998) Suppression and the upward spread of masking. J Acoust Soc Am
104:3500–3510
Plack CJ, Oxenham AJ, Drga V (2002) Linear and nonlinear processes in temporal masking. Acta Acust united with Acust 88:348–358

14 Neuromagnetic Representation of Comodulation Masking Release in the Human Auditory Cortex
ANDRÉ RUPP1, LIORA LAS2, AND ISRAEL NELKEN2,3
1Introduction
The detection of a low-level signal masked by a noisy background can be improved when the noise masker is coherently modulated over a wide frequency range, a psychoacoustical phenomenon referred to as comodulation masking release (CMR; Hall et al. 1984). Tone detection is more efficient when the modulated noise is increased in bandwidth. In vivo recordings in cats of three successive stages of the auditory pathway, namely the inferior colliculus (IC), medial genigulate body (MGB), and the primary auditory cortex (A1) revealed a possible neural correlate of CMR in neurons of A1 (Las et al. 2005). While A1 neurons tend to show some locking to the amplitude modulation of wideband maskers (envelope locking), envelope locking can be diminished markedly by the addition of a low-level tone. This effect is referred to as locking suppression. Although specific activation by low-level tones have already been demonstrated in the cochlear nucleus of guinea pigs (Pressnitzer et al. 2001; Neuert et al. 2004), locking suppression as observed in A1 neurons was hypothesized to enhance the representation of the low-level tone in cortex and to be a correlate of the formation of an auditory object (Las et al. 2005).
In the present study, whole head magnetoencephalography was employed to investigate the specific effects of CMR in the auditory cortex of human listeners and to compare these field recordings to in vivo extracellular recordings of cat primary auditory cortex.
2Locking Suppression in the Primary Auditory Cortex
The data presented here was collected in four halothane-anesthetized cats using extracellular recordings. Electrophysiological techniques have been described in details in Bar-Yosef et al. (2002), and the stimuli used here are
1Section of Biomagnetism, Department of Neurology, University of Heidelberg, andre.rupp@uniheidelberg.de
2Department of Neurobiology, The Alexander Silberman Institute of Life Sciences, Hebrew University, Jerusalem, liora@md.huji.ac.il, israel@cc.huji.ac.il
3Interdisciplinary Center for Neural Computation, Hebrew University, Jerusalem
Hearing – From Sensory Processing to Perception
B. Kollmeier, G. Klump, V. Hohmann, U. Langemann, M. Mauermann, S. Uppenkamp, and J. Verhey (Eds.) © Springer-Verlag Berlin Heidelberg 2007
126 |
A. Rupp et al. |
the same as in the study of Las et al. (2005). In short, the masker consisted of noise bands centered on the best-frequency (BF) of one of the simultaneouslyrecorded neurons, with bandwidth spanning the range between BF/16 and BF Hz. The tone was always at the center of the band, and its level was selected to include masked threshold. The modulation pattern was trapezoidal (10 Hz, 50 ms tone bursts with 10 ms on-off linear ramps). Tone onset occurred between the second and third noise cycles.
Figure 1 shows average responses of both well-separated units and small clusters. These units have been tested with the tone and masker in various relationships relative to BF, with the tone at levels comparable to those used in the MEG experiments. About half of the units (20 of 41 units averaged in Fig. 1, bottom) showed significant responses to the tone in quiet. This figure is therefore a rough approximation of the expected average activity in primary auditory cortex when using a fixed set of maskers and tones as done in the MEG experiments.
Based on these data, we made two predictions. The first is that a wideband modulated masker should give rise to stronger phase locking in the evoked magnetic fields than narrowband noise (Fig. 1, top). This is due both to the stronger locking evoked by wideband maskers in individual neurons, and to
rate (sp/s)
30 |
|
|
wideband |
20 |
narrowband |
|
|
10 |
|
0 |
|
20 |
|
masker only masker + tone
10
0
0 |
100 |
200 |
300 |
400 |
500 |
600 |
700 |
time (ms)
Fig. 1 Average unit responses in A1 of halothane-anesthetized cats. Top: responses to wideband modulated maskers are larger than responses to narrowband modulated maskers (45 units). Bottom: adding a tone to a modulated masker reduces, but does not abolish, envelope locking (41 units tested at SNRs comparable to those used in the MEG experiment). The arrow marks tone onset
Neuromagnetic Representation of Comodulation Masking |
127 |
the larger number of neurons presumably activated by the wideband relative to the narrowband masker.
The second prediction from the neural data was that the addition of a tone would reduce, but not eliminate, the locking of the magnetic fields to the noise. This was due to our finding of hypersensitive locking suppression in A1 (Las et al. 2005). However, in the data described by Las et al., the tone was always a best-frequency tone. MEG recordings would be influenced by activity evoked in large neuronal populations, extending beyond the population whose BF exactly matches the tone frequency. Figure 1 (bottom) illustrates the average population response to a wideband masker alone and to a masker+tone stimulus. The arrow indicates tone onset. While locking is substantially the same during the first noise cycle following tone onset in the two conditions (as described by Las et al. 2005), it is partially suppressed during the following noise cycles. The remaining locking is presumably due to the presence of neurons with higher masked thresholds and to neurons whose best frequency may be away from the tone frequency, and therefore would be less sensitive to its presence.
3Neuromagnetic Representation of CMR in Human Listeners
3.1Methods
Twelve normal hearing listeners (24–41 years) participated in the neuromagnetic study. In the first condition we used amplitude modulated noise maskers with a 10-Hz modulation rate. The noise contained six cycles, the first being 25 ms and the others 50 ms long with 50 ms silence between each noise burst. In the second condition maskers were presented in a continuous manner. Masking conditions included a broadband (900 Hz) and a narrowband noise (90 Hz) gated using a 12-ms linear window. The test signal was a 500-Hz pure tone, 275 ms in duration including 10-ms linear ramps. It was switched on 250 ms after masker onset. The longer delay between masker onset and tone onset was selected in order to switch the tone in after the main magnetic fields evoked by noise onset have died out. Psychoacoustic thresholds were determined by an adaptive 2AFC procedure in conjunction with a two-down one-up tracking rule to estimate the 70.7% correct point based on the psychometric curve.
We applied two different signal levels for the MEG-experiments, i.e. 5 dB and 15 dB above the average thresholds of all stimulus conditions (derived from the first five participants of the psychoacoustic task). The resulting signal-to-noise ratios were kept constant for all MEG recordings. The broadband masker level was 70 dB SPL. Sounds were presented diotically via ER-3 earphones (Etymotic Research Inc.) connected to 90-cm plastic tubes and foam earpieces.
128 |
A. Rupp et al. |
The auditory evoked magnetic fields (AEFs) were recorded using a Neuromag-122 whole head system with a sampling rate of 1000 Hz (bandwidth: DC-330 Hz) and an interstimulus interval of 1000 ms. About 350 sweeps were averaged per condition. During the MEG recordings subjects were watching a silent movie and were instructed not to attend to the sounds.
Spatio-temporal source analysis (Scherg 1990) was performed using the BESA®5.1 software package (MEGIS Software GmbH). Two source models with one equivalent dipole in each hemisphere were used to analyse the CMR related responses. The first source model was based on the initial deflection of the pooled conditions to analyse the Pam. The specific N1m response elicited by the test tone embedded in the noise masker was modeled using the N1m deflection of the difference waveforms (tone+masker minus masker of the unmodulated wideband condition). Dipole solutions of both models were held fixed and used as a spatial filter to derive the source waveforms for each of the 12 stimulus conditions separately.
Grand average source waveforms were computed for each condition. Difference waveforms were computed to derive the specific response elicited by the test tones. The specific representation of the middle latency components was analyzed using a bandpass filter ranging from 15 to 100 Hz. The analysis of the late AEFs were based on lowpass filtered data (0.001–30 Hz, zero-phase filter). The significance of the amplitudes were assessed by a permutation test for waveform differences (Blair and Karniski 1993). The output of this procedure is a single multivariate statistic, denoted as tsum.
3.2Results and Discussion
In all subjects both dipole sources localized bilaterally within or near Heschl’s gyrus. The bandpass filtered (10–100 Hz) dipole source waveforms showed in both modulated masker conditions a highly similar pattern of the left and right auditory cortex with a Pam-P1m complex evoked by each noise burst. Due to the similarity of the Pam responses, the comparisons of this component were carried out using the average of the left and right waveforms (Fig. 2). The simultaneous comparison of all Pam deflections evoked by the six noise cycles showed significant higher amplitudes in the wideband condition (tsum = 165.9, P<0.005).
A significant suppression of the Pam locking to the bursts after tone onset was found for the fifth and sixth response in the +15 dB condition (fifth burst: tsum = −33.8, P<0.05; sixth burst: tsum = −35.7, P<0.05) but could not be observed
for the first burst after tone onset (tsum = 0.36, n.s.) as well as in the +5 dB wideband condition and both narrowband conditions.
Thus, the Pam, which is supposed to represent specific activation of the primary auditory cortex (Liègeois-Chauvel et al. 1994), exhibited a comparable behaviour as found in extracellular recordings of cat primary auditory cortex, at least for tones 15 dB above masked threshold.
Neuromagnetic Representation of Comodulation Masking |
129 |
|
10 |
|
|
modulated wideband |
|
|
|
||
|
|
|
|
|
|
Pam |
|
|
|
|
|
|
P1m |
|
|
|
|
|
|
|
5 |
|
|
|
|
|
|
|
|
|
Pam |
|
|
|
|
|
|
|
|
|
0 |
|
|
|
|
|
|
|
|
(nAm) |
−5 |
|
|
|
|
|
|
|
|
−10 |
0 |
100 |
200 |
300 |
400 |
500 |
600 |
700 |
|
|
|||||||||
moment |
|
||||||||
10 |
|
|
modulated narrowband |
|
masker |
||||
|
|
|
|
|
|
||||
dipole |
|
|
|
|
|
|
|||
|
|
|
|
|
|
|
+15dB |
||
5 |
|
|
|
|
|
|
+5dB |
|
|
|
0 |
|
|
|
|
|
|
|
|
|
−5 |
|
|
|
|
|
|
|
|
|
−10 |
0 |
100 |
200 |
300 |
400 |
500 |
600 |
700 |
|
|
||||||||
|
|
|
|
|
time (ms) |
|
|
|
|
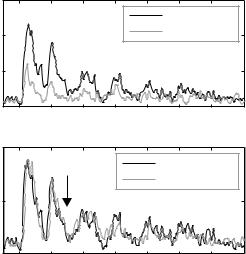
Fig. 2 Top panel: locking of the Pam and its suppression after low-level tone onset (grand-average waveforms). The grey lines at the bottom of each panel indicate the temporal position of the masker and tone. Note the reduction of the Pam component evoked by the fifth and sixth sixth noise burst when a tone (15 dB above threshold) is added to the modulated masker (grey arrows). Bottom panel: locking suppression is not found for low level tones
In order to demonstrate these effects more directly, we analysed the gradiometer data of a single subject (AR). The three 100 ms long periods following the first noise burst after tone onset (fifth and sixth noise cycles) were used.
Modulation of the detrended signal was tested by a one-way ANOVA with the lag in the period as the factor and the signal during the two periods as repeated measurements (as in Nelken et al. 2004). F-values above 2 were considered as significant in order to compensate for multiple comparisons. The average modulation pattern tended to have rather similar shape in the responses of all gradiometers that were significantly modulated by the noise, except for possible sign switches. The polarity of the data from all gradiometers was therefore adjusted such that the main peak around 40 ms in the response to the modulated masker alone was positive.
The results of this analysis are shown in Fig. 3. The black lines represent the modulation pattern in response to masker alone, averaged across all gradiometers with significant modulation (F>2). The error bars represent

130 |
A. Rupp et al. |
|
wideband |
|
field (fT/cm) |
narrowband |
|
magnetic |
||
+5dB |
||
|
masker |
|
|
+15dB |
0 |
25 |
50 |
75 |
100 |
time (ms)
Fig. 3 Analysis of single-subject gradiometer data. Average modulation patterns across all gradiometers showing significant modulation locked to the noise periodicity, based on all noise periods following the fifth and sixth periods
one SEM (estimated from the variance across gradiometers, averaged across all conditions). The modulation depth in the responses to the wideband modulated masker was significantly larger than in the responses to the narrowband masker. Furthermore, the addition of the tone reduced the depth of modulation. In order to test for the changes in responses due to the presence of the tone, the squared modulation patterns were analyzed in a three-way ANOVA (condition × lag × gradiometer). All three factors had a highly significant main effect. This analysis confirms, at the level of the magnetic fields, the results of the source modeling presented above. In addition to the early response components, the magnetic fields showed late response components locked to the tone onset. The analysis showed the emergence of a N1m preceded by a small P1m (Fig. 4). These late responses had two important properties: first, the resulting tone-evoked N1m was larger for tones at about 15 dB above threshold compared to the +5 dB conditions. Second, there was a clear hemispheric asymmetry (data not shown), and the larger right hemisphere responses were significant for all conditions except for the low-level tone in the modulated narrow band con-
dition (tsum = 448.4, P = 0.66). Third, the N1m evoked by the +15 dB tone was much larger in both unmodulated masking conditions, presumably due to
the much higher absolute level of that tone.

Neuromagnetic Representation of Comodulation Masking |
131 |
modulated wideband
|
20 |
|
|
|
|
|
|
|
|
0 |
|
|
|
|
|
|
|
(nAm) |
− 20 |
tone onset |
|
|
|
|
|
|
− 40 |
|
|
|
|
|
|
|
|
moment |
|
|
unmodulated wideband |
|
|
|||
20 |
Pam |
P1m |
|
|
|
|
||
dipole |
0 |
|
|
|
|
|
|
|
|
|
|
|
|
|
|
|
|
|
−20 |
|
|
|
|
|
|
|
|
|
|
N1m |
|
|
|
|
|
|
−40 |
0 |
200 |
400 |
600 |
800 |
1000 |
1200 |
|
|
|||||||
time (ms)
modulated narrowband
masker +15dB +5dB
unmodulated narrowband
|
|
SF |
|
|
|
|
0 |
200 |
400 |
600 |
800 |
1000 |
1200 |
time (ms)
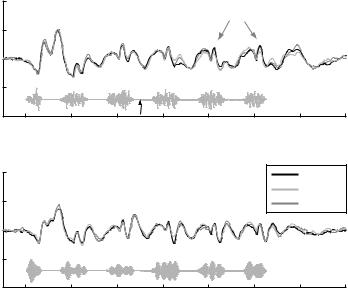
Fig. 4 Grand-average source waveforms of the two-dipole model tone evoked N1m for all conditions. Due to the similarity of the difference wave morphology of the left and right hemisphere data, the average of both hemispheres is shown. Note the increase in negativity at about 400 ms evoked by the test tone
4Conclusions
The presence of envelope locking and locking suppression in the cat A1 suggested the presence of similar findings in the evoked magnetic fields in humans. The main result of this paper is the confirmation of the resulting predictions. Indeed, the middle latency AEF demonstrated locking suppression for the fifth and sixth noise bursts in the wideband condition. Since these are the second and third noise bursts following tone onset, this finding mirrors exactly the data of Las et al. (2005), as illustrated here in Fig. 1.
In addition to the locking suppression of the early responses, we identified another response component, the N1m wave locked to tone onset. This component was significant even with very low-level tones, just 5 dB above psychoacoustic threshold, at least in the right hemisphere. This component did not have a correlate in the neural data from cat auditory cortex. There are two possible interpretations of this finding: the cat may not show an N1 wave locked to tone onset, or alternatively the N1 is not elicited in A1. Because of the high correlation between this component and human perception, we speculate that it is related to the appearance of a new auditory object in the sound.
Acknowledgement. This work was supported by grants from the Israeli Science Foundation and the Human Frontiers Science Program.
132 |
A. Rupp et al. |
References
Bar-Yosef O, Rotman Y, Nelken I (2002) Responses of neurons in cat primary auditory cortex to bird chirps: effects of temporal and spectral context. J Neurosci 22:8619–8632
Blair RC, Karniski W (1993) An alternative method for significance testing of waveform difference potentials. Psychophysiology 30:518–524
Hall JW, Haggard MP, Fernandes MA (1984) Detection in noise by spectro-temoro pattern analysis. J Acoust Soc Am 76:50–56
Las L, Stern EA, Nelken I (2005) Representation of tone in fluctuating maskers in the ascending auditory system. J Neurosci 25:1503–1513
Liègeois-Chauvel C, Musolino A, Badier JM, Marquis P, Chauvel P (1994) Evoked potentials recorded from the auditory cortex in man: evaluation and topography of the middle latency components. Electroencephalogr Clin Neurophysiol 92:204–214
Nelken I, Bizley JK, Nodal FR, Ahmed B, Schnupp JW, King AJ (2004) Large-scale organization of ferret auditory cortex revealed using continuous acquisition of intrinsic optical signals. J Neurophysiol 92:2574–2588
Neuert V, Verhey JL, Winter IM (2004) Responses of dorsal cochlear nucleus neurons to signals in the presence of modulated maskers. J Neurosci 24:5789–5797
Pressnitzer D, Meddis R, Delahaye R, Winter IM (2001) Physiological correlates of comodulation masking release in the mammalian ventral cochlear nucleus. J Neurosci 21:6377–6386 Scherg M (1990) Fundamentals of dipole source analysis. In: Grandori F, Hoke M, Romani GL (eds) Auditory evoked magnetic fields and electric potentials, advances in audiology, vol 6.
Karger, Basel, pp 40–69
Comment by Verhey
Wouldn’t your N100 data (shown in Fig. 4) indicate that thresholds should be lower in the unmodulated condition than in the corresponding modulated condition, in contrast to the psychophysical data?
Reply
The tone levels we used were set relative to the average masked thresholds in each condition. The +5 dB tones in the modulated condition has an absolute level which was more than 30 dB below that of the +5 dB tone in the unmodulated condition. Thus, the N100 data is in fact fully consistent with the psychophysical data. When the tones were above energy detection threshold (the +15 dB unmodulated conditions), the data indicates indeed a steep increase in N100 amplitude which may reflect non-linear effects.