

Учебники / Hearing - From Sensory Processing to Perception Kollmeier 2007
.pdfInfluence of Neural Synchrony on the Compound Action |
7 |
Discriminability of these scaled harmonic complexes from either cosinephase (i.e., scalar = 0) or from scalars of ±1.0 generally improves when the difference between the standard and the signal in the duration of cochlear activation increases (Fig. 6).
5Conclusions
These results show that several physiological and behavioral measures of the processing of harmonic complexes are remarkably similar across a number of very diverse species when considered in terms of two simple parameters: species-specific cochlear response delay and the time distribution of harmonic frequencies within the harmonic complex. Variation in CAP amplitude across harmonic complexes correlates well with the spatial extent of cochlear activation. The duration of cochlear activation around probe frequency is consistent with masking data from birds but does not explain the reduced masking seen in humans with positive scaled harmonic complexes. Discriminability of harmonic complexes is generally related to differences in the duration of cochlear activation except for birds discriminating negative scalars from a cosine background.
Acknowledgments. Supported by NIH Grants DC-00198 to RJD and DC-00626 to MRL.
References
Dau T, Wegner O, Mellert V, Kollmeier B (2000) Auditory brainstem responses with optimized chirp signals compensating basilar-membrane dispersion. J Acoust Soc Am 107:1530–1540 Donaldson GS, Ruth RA (1993) Derived band auditory brain-stem response estimates of travel-
ing wave velocity in humans. I: Normal-hearing subjects. J Acoust Soc Am 93:940–951 Dooling RJ, Lohr B, Dent ML (2000) Hearing in birds and reptiles. In: Dooling RJ, Fay RR,
Popper AN (eds) Comparative hearing: birds and reptiles. Springer, berlin Heidelberg New York, pp 308–359
Dooling RJ, Dent ML, Leek MR, Gleich O (2001) Masking by harmonic complexes in three species of birds: psychophysical thresholds and cochlear responses. Hear Res 152:159–172
Gleich O, Narins PM (1988) The phase response of primary auditory afferents in a songbird. Hear Res 32:81–92
Gummer AW, Smolders JW, Klinke R (1987) Basilar membrane motion in the pigeon measured with the Mossbauer technique. Hear Res 29:63–92
Lauer AM, Dooling RJ, Leek MR, Lentz JJ (2006) Phase effects in masking by harmonic complexes in birds. J Acoust Soc Am 119:1251–1259
Leek MR, Dooling RJ, Gleich O, Dent ML (2005) Discrimination of temporal fine structure by birds and mammals. In: Presnitzer D, Cheveigne A, McAdams S, Collet L (eds) Auditory signal processing. Springer Science+Business Media, p 471–477
Palmer AR, Russell IJ (1986) Phase-locking in the cochlear nerve of the guinea-pig and its relation to the receptor potential of inner hair-cells. Hear Res 24:1–15
8 |
O. Gleich et al. |
Sachs MB, Young ED, Lewis RH (1974) Discharge patterns of single fibers in the pigeon auditory nerve. Brain Res 70:431–447
Schmiedt RA, Zwislocki JJ (1977) Comparison of sound-transmission and cochlear-microphonic characteristics in Mongolian gerbil and guinea pig. J Acoust Soc Am 61:133–149
Schoonhoven R, Prijs VF, Schneider S (2001) DPOAE group delays versus electrophysiological measures of cochlear delay in normal human ears. J Acoust Soc Am 109:1503–1512
Schroeder M (1970) Synthesis of low-peak-factor signals and binary sequences with low autocorrelation (Corresp.). Information Theory, IEEE Trans 16:85–89
Comment by Kohlrausch
In your Fig. 5, you analyze masking properties of scaled Schroeder-phase complexes by your measure of cochlear activation (basilar-membrane response synchrony across a certain frequency range) in the spectral region of the signal. I wonder whether this property of the stimulus is primarily responsible for the amount of masking. The influence of masker phase on masking properties in such conditions has been explained quite successfully by the peakiness of the on-channel masker waveform after going through the inner-ear filter at the signal frequency (see the original publications by Smith et al. 1986 and Kohlrausch and Sander 1995, but also the recent paper by Lauer et al. 2006, all in JASA). According to this explanation, the Schroederphase masker producing the least amount of masking is the one for which the phase curvature is similar (and opposite) to the one of the relevant inner ear filter. Thus, masking depends primarily on the phase characteristic of an individual point of the basilar membrane, which is a priori independent of the place-dependent cochlear delay.
For humans, the psychophysical data by Lauer et al. and by Lentz and Leek (2001) suggest that around 3 kHz, scalar values between 0.5 and +1 result in the least effective masker. For the bird condition, the least effective masker is one with a scalar value close to zero, i.e. a zero-(or sine-) phase masker. This has lead Lauer et al. to the conclusion that, around 3 kHz, the phase curvature of the corresponding inner ear filter in birds is a factor 4 to 8 smaller than the curvature in humans.
Introducing a curvature in the stimulus phase spectrum (i.e., increasing the scalar from 0 to either +1 or −1) will for birds have two effects. First, and in my view most important, the energy at the output at the 2.8-kHz filter will be smeared out over a longer portion of each masker period as for the zerophase complex, leading to an increase in masking. Second, the synchrony across frequency will be reduced, because the frequency-dependent delays in the Schroeder-phase stimuli will be much larger than the place-dependent delay in the bird inner ear. For humans, on the other hand, the smearing out of the energy at the output of the corresponding inner-ear filter will only occur for negative scalar values (because stimulus phase curvature and filter phase curvature will add up to increase the resulting curvature, leading to a flat temporal envelope), but not for positive scalars (at least up to +1), for which the phase characteristics compensate each other to a certain extent.
Influence of Neural Synchrony on the Compound Action |
9 |
Such a view, based on within-channel masker waveforms, agrees with all experimental data for both humans and birds shown in the left panel of Fig. 5.
References
Kohlrausch A, Sander A (1995) Phase effects in masking related to dispersion in the inner ear. II. Masking period patterns of short targets. J Acoust Soc Am 97:1817–1829
Lentz JJ, Leek MR (2001) Psychophysical estimates of cochlear phase response: masking by harmonic complexes. J Assoc Res Otolaryngol 2:408–422
Smith BK, Sieben UK, Kohlrausch A, Schroeder MR (1986) Phase effects in masking related to dispersion in the inner ear. J Acoust Soc Am 80:1631–31637
Reply
We are aware of, and agree with, the explanations reviewed by Dr. Kohlrausch regarding the masking data, and our data analysis is not inconsistent with the within-channel views. We were looking for a general analysis of cochlear activation patterns that could be related to various aspects of data on perception and processing of harmonic complexes. These included questions of synchronization (CAP), masking, and discrimination. The masking analyses of cochlear activation across a rough estimate of critical band around the probe frequency provides an alternative explanation for data obtained in birds that is consistent with within-channel masking in humans.
These analyses reconcile masking differences across species except for the release from masking when the phase spectrum of the masker compensates for the phase characteristic of the sensory epithelium (as pointed out by Kohlrausch). They also are useful (if not perfect) explanations of the amplitudes of the compound action potentials and some aspects of discrimination across the complexes. Our goal was to find a physiological mechanism that would support all these experimental findings.
Comment by Lütkenhöner
Did the scalar C affect only the amplitude of the compound action potential (CAP) or did you observe also changes in shape? In that case, it might be useful to consider alternative measures of the response magnitude, for example the area under the dominant CAP peak.
Reply
The scalar not only affected the amplitude, but also the shape of the CAP waveform as illustrated for a set of typical examples in Fig. A. Despite these

10 |
O. Gleich et al. |
Fig. A Typical CAP waveforms in response to selected scaled harmonic complexes, collapsed across 10 periods from a gerbil (black lines) and a zebra finch (gray line). The inset in each diagram illustrates one period of the waveform of the corresponding harmonic complex
changes in the shape of the waveform, the peak to peak amplitude appears as a useful measure for the present analysis of synchronized cochlear activation (see also Fig. 4).

2 A Nonlinear Auditory Filterbank Controlled by Sub-band Instantaneous Frequency Estimates
VOLKER HOHMANN AND BIRGER KOLLMEIER
1Introduction
Functional models of basilar membrane motion have a long tradition and a wide range of applications. They usually take as input the stapes vibration and provide the excitation pattern of the inner hair cells as an output. Even though the design of these models and the psychophysical data put into the model design are based on simple signals (e.g. sinusoids and twotone complexes), these models have the advantage to be also applicable to complex sounds (such as speech). Hence, they describe the degree to which we understand the response of the human peripheral auditory system to every-day sounds.
While transmission line and coupled elements models (such as, e.g., Duifhuis et al. 1985; Talmadge et al. 1998) are primarily used to describe the “effective” influence of physical parameters and mechanical properties on the basilar membrane response, filterbank models are primarily used to describe the “effective” signal processing properties of the basilar membrane at a fixed position on the BM. While single-filter approaches (both linear and – in more refined models – nonlinear filters) have been used in the past, dual resonance filter approaches (see, e.g., Goldstein 1988; Meddis et al. 2001) have been suggested more recently. They explicitly model the approximately linear response to input frequencies remote from the best frequency separately from the nonlinear, compressive response to frequencies close to the best frequency. This approach has the advantage of adequately describing the frequency-selective gain and instantaneous compression. However, it does not correctly describe suppression phenomena for configurations with high frequency separation between suppressor and suppressee: While psychoacoustic and physiological data show an increase of suppression up to 2.5 dB per dB with increasing suppressor level in lowside suppression, typical dual resonance filter models can only show a suppression rate of less than 1 dB per dB suppressor level. This originates from
Medizinische Physik, Fakultät V, Institut für Physik, Carl von Ossietzky Universität, Oldenburg, Germany, volker.hohmann@uni-oldenburg.de, birger.kollmeier@uni-oldenburg.de
Hearing – From Sensory Processing to Perception
B. Kollmeier, G. Klump, V. Hohmann, U. Langemann, M. Mauermann, S. Uppenkamp, and J. Verhey (Eds.) © Springer-Verlag Berlin Heidelberg 2007
12 |
V. Hohmann and B. Kollmeier |
the fact that in these models the increase in suppression with suppressor level is directly coupled to the amount of compression in the on-frequency nonlinear filter. For this reason, the current paper describes a new approach that extends the idea of a dual resonance filter by including a control of the nonlinear filter gain by the sub-band instantaneous frequency. This approach enables us to control to a certain extent the amount of suppression separately from the frequency-dependent gain characteristics.
The main idea is to appropriately model the observation that the auditory system yields an increasingly linear response with less gain to an on-frequency component as soon as an increasing level of off-frequency components falls into the respective on-frequency filter. Using this approach, two-tone suppression data with suppressor frequencies well below the on-frequency component (low-side suppression) will be considered in this paper as well as the different behavior of onand off-frequency masking in simultaneous and non-simultaneous masking conditions.
2Description of the Model
The key feature of the model introduced here is the extraction of the instantaneous frequency which is well defined for AM/FM-signals, e.g., signals after peripheral bandpass filtering. The instantaneous frequency (IF) can be derived efficiently within a few waveforms from the analytical signal s(t) by computing the derivative of its phase. The assumption is that the deviation of the instantaneous frequency from the best frequency of the channel determines the amount of gain and compression. The hypothetical physiological mechanism may be the instantaneous-frequency-dependent direction of outer haircell stereocilia deflection. According to Wersäll et al. (1965) the direction of outer haircell deflection differs between on-frequency excitation and offfrequency excitation at the same place on the basilar membrane with the sensitivity of the OHC being highest for the direction of motion induced by an on-frequency signal (see also Duifhuis 1976). Hence, the gain and compression for a given best frequency is modeled to depend on the difference between instantaneous frequency and the best frequency as given exemplarily in Fig. 1. The gain characteristic is obtained from a typical BM gain response curve obtained for ∆IF = 0 ERB (no deviation between best frequency and instantaneous frequency). With increasing difference, the gain characteristics is modeled to become less compressive and achieves less gain at low input levels, i.e., gain(dB) = gain_exp(∆IF) × dbgain(L) where the gain exponent gain_exp decreases linearly with ∆IF from one to zero and dbgain(L) describes the standard on-frequency compressive input/output characteristic as a function of input level L.
The complete design of one frequency channel of the model is given in Fig. 2. The dual-resonance approach is achieved with a wide, linear filter F1 in combination with a more frequency-selective filter F2 which is followed by
A Nonlinear Auditory Filterbank |
13 |
|||||||
|
|
|
|
|
|
|
|
|
|
|
|
|
|
|
|
|
|
|
|
|
|
|
|
|
|
|
|
|
|
|
|
|
|
|
|
|
|
|
|
|
|
|
|
|
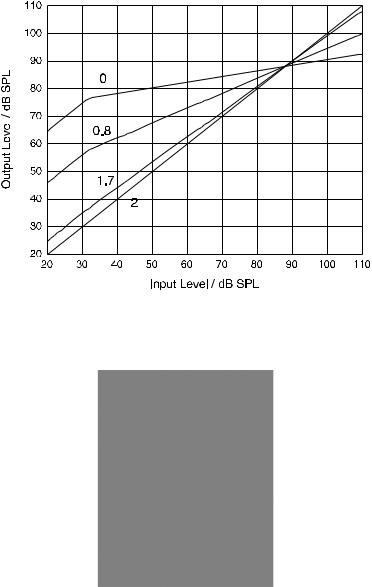
Fig. 1 I/O-characteristics, i.e., output level as a function of input level for deviations of the instantaneous frequency from best frequency (∆IF-values) of 0, −0.8, −1.7 and −2 ERB. At ∆IF = −2 ERB and below, response is linear and gain is zero
Fig. 2 Block diagram of one frequency-channel of the model. F1: wide band filter, F2: narrow band filter, IC: instantaneous compression, IF: instantaneous frequency estimation
a nonlinear instantaneous compression circuit (IC, right column in Fig. 2) which adds its output to the output of F1. The control of this compression is achieved by a feed-forward simulation of the dual-resonance filter with fixed IC (middle column in Fig. 2) which is taken as the input to the instantaneous frequency estimation (IF). The resulting difference ∆IF is used to compute
14 |
V. Hohmann and B. Kollmeier |
the gain_exp(∆IF) (see above) which alters the gain characteristic of the IC as shown in Fig. 1. Note that instead of employing two separate IC blocks for the feedforward structure in Fig. 2, only one IC block would be sufficient for a feedback structure where the output of the complete filter is used as input to the IF-circuit. Whereas such a feedback control might be simpler and more physiologically plausible, it would produce numerical instabilities. In addition, the chosen structure from Fig. 2 has the advantage that the compressed on-frequency components are used as input to the IF which is a necessary prerequisite for predicting the correct two-tone suppression characteristic (see below).
The implementation of the model employs linear bandpass filters (F1, F2) which were chosen as double exponential filters parameterized by the respective centre frequency and the lower and upper slope in dB per octave (F1: lower slope 12 dB/octave, upper slope −48 dB/octave, F2: lower slope 60 dB/octave and upper slope −60 dB/octave). The filters were implemented as FFT-based minimum phase filters with a length of 1000 sample at a sampling frequency of 22.05 kHz using a complex output to approximate the analytical signals. A linear distribution of centre frequencies was obtained on an ERBscale with two filters per ERB. The instantaneous compression stage operates on a sample-by-sample basis on the Hilbert envelope (as in Herzke and Hohmann 2005) and uses the I/O-characteristics as sketched in Fig. 1. These parameters were selected in order to fit best to a variety of psychophysical masking data. Specifically, the parameters were fitted to best produce the two-tone suppression data and the upward spread of masking data were predicted using these fixed parameter settings.
3Results
3.1Two-tone Suppression Data
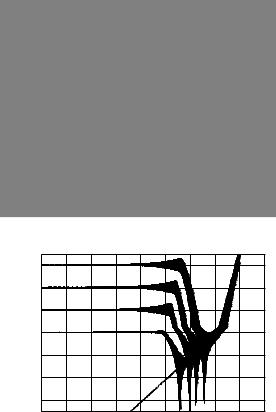
Figure 3a shows psycho-acoustical two-tone suppression data obtained by Duifhuis (1980) where the suppressor level (L2 at 400 Hz) is given on the abscissa while the pulsation threshold of a tone (1 kHz) that achieves the same “internal level” as the suppressed tone (1 kHz) is given on the ordinate. Parameter of the curve is the level L1 of the suppressee. With increasing suppressor level, the “effective” suppressee level (given here by the level of the equivalent pulsation threshold) drops at a very high rate (approximately −2.5 dB per dB suppressor level) as soon as the suppressor level exceeds a suppression threshold. In addition, the suppression threshold increases at a slope of approximately 4 dB in suppressee level per dB suppressor level. This high slope can be taken as an indicator of the effective compression of the suppressee in the control channel (such as the middle column in Fig. 2), assuming the suppressor is processed linearly. With even higher suppressor
A Nonlinear Auditory Filterbank |
15 |
(b) |
|
|
|
|
|
|
|
|
|
|
dB |
60 |
|
|
|
|
|
|
|
|
|
/ |
|
|
|
|
|
|
|
|
|
|
Level |
50 |
|
|
|
|
|
|
|
|
|
40 |
|
|
|
|
|
|
|
|
|
|
Excitation |
|
|
|
|
|
|
|
|
|
|
30 |
|
|
|
|
|
|
|
|
|
|
20 |
|
|
|
|
|
|
|
|
|
|
|
|
|
|
|
|
|
|
|
|
|
Relative |
10 |
|
|
|
|
|
|
|
|
|
0 |
|
|
|
|
|
|
|
|
|
|
|
|
|
|
|
|
|
|
|
|
|
|
20 |
30 |
40 |
50 |
60 |
70 |
80 |
90 |
100 |
110 |
Suppressor Level / dB
Fig. 3 Upper panel a psychoacoustical two-tone suppression data from Duifhuis (1980). Lower panel b model simulations
levels, the “effective” on-frequency excitation determining the pulsation threshold is dominated by the suppressor which explains the curve increase at the right side of the graph.
Figure 3b shows the corresponding model output derived for the same stimuli and approximate levels as given for the data plot (20 dB suppressee level is missing). The plot shows the output of the on-frequency channel at 1000 Hz for suppressee levels of 30, 40, 50 and 60 dB, respectively, as a function of suppressor level and referenced to an on-frequency signal. To generate the model data, the suppressor level increased linearly from 20 dB to 100 dB within 2 s and the instantaneous output level inversely transformed across the on-frequency compressive I/O-characteristics is plotted. This inverse transformation is necessary, because the pulsation threshold is
16 |
V. Hohmann and B. Kollmeier |
measured with a reference on-frequency test tone that is transformed compressively. Obviously, the general pattern is consistent with the data given in Fig. 3a while the fine structure of the total output level is generated by interference between suppressor and suppressee. The strong dips in the curves between 75 and 85 dB suppressor level, respectively, are due to interference in the signal path, i.e., where suppressor and suppressee level are approximately the same at the output. The modulation close to suppression threshold is due to interference between suppressor and suppressee in the control channel which leads to a modulation of instantaneous frequency and subsequently in overall gain.
3.2Upward Spread of Masking
Figure 4a shows spectral masking data from Oxenham and Plack (1998) obtained with a narrowband noise as masker at different masker levels (given at the abscissa) and a short sinusoidal tone as signal to be detected either in a simultaneous masking condition (filled symbols) or a non-simultaneous masking condition (i.e., forward masking, open symbols). Squares denote on-frequency masking (masker and test tone centered at 4 kHz), where simultaneous and non-simultaneous masking data coincide quite well, whereas circles denote the off-frequency masking conditions (masker centered at 2.4 kHz, test tone at 4 kHz) where the simultaneous masking condition shows a much higher slope in masked threshold as function of masker level than the non-simultaneous condition. The difference between these curves represents the suppression of the 4-kHz-tone in the simultaneous condition (i.e., the level has to be increased considerably in order to achieve detection), whereas no suppression is exerted from the 2.4-kHz-masker in the non-simultaneous condition.
Figure 4b shows the respective prediction from the model described above: To predict detection data, the output of the 4-kHz-channel was monitored and the detection threshold was assumed as soon the output level for masker plus test tone exceeds the output level for the masker alone by 1 dB. For predicting the threshold in quiet at the left-end side of the plot, an appropriate threshold criteria was assumed. For comparison, the estimation for the non simultaneous off-frequency condition is given (lower solid line), which was achieved by finding those test tone levels in the test tone-only condition that yield the same output level as the masker-alone condition in the 4-kHz-channel. In addition, the on-frequency condition for simultaneous and non simultaneous masking is plotted which was derived in the same way and which yields a 1:1 characteristic (upper solid curve). Obviously, the model predicts the average subjects data from Oxenham and Plack (1998) quite accurately even though the model parameters were not fit to this particular experimental condition. This underlines that the implementation of the suppression mechanism proposed here seems to be an adequate model of suppression effects in humans.