

Учебники / Hearing - From Sensory Processing to Perception Kollmeier 2007
.pdf112 |
M.G. Heinz |
3.4The Effect of Noise Level on Coding Schemes
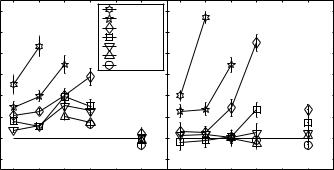
The quantification of spectral coding in terms of SMP functions is shown in the left panels of Fig. 4. Average rate was compared between conditions with F1 and T1 at the AN fiber BF. The ALSR metric was computed from the predicted spatiotemporal responses (Fig. 2), across effective BFs within ± 0.25 octaves of the vowel feature. One simple cross-BF coincidence metric was taken as the value of the SCC function (Fig. 3) at the characteristic delay (i.e., maximum coincidence rate closest to zero delay). This metric was motivated by the cross-correlation model of Deng and Geisler (1987).
The robustness of spectral coding was evaluated based on the slopes of the SMP functions as a function of noise level (right panels). Although this AN fiber had excellent rate-based spectral coding for the 50-dB SPL vowel in quiet, rate coding degraded significantly as noise was added. The SMP slope for rate dropped to one half the in-quiet slope at a SNR=10 dB. In contrast,
Fig. 4 Spectral coding versus noise level. The left panels show rate, ALSR, and the coincidence metrics versus vowel feature level (F1=50 dB SPL, T1=20 dB SPL) for each noise condition. The right panels show the SMP-function slopes versus noise level. The in-quiet values are shown by filled squares. The vertical dotted lines indicate the SNR at which each metric degraded to one half the SMP slope value in quiet

Spatiotemporal Encoding of Vowels |
113 |
Fig. 5 SNR at which spectral coding degraded. Down (up) arrows on filled symbols indicate the lowest (highest) SNR measured for AN fibers for which SMP slope never (always) fell below half the in-quiet value (e.g., ALSR data in Fig. 4). Squares: high-SR; Triangles: low/med-SR
coding based on ALSR was not affected over this noise range. Spectral coding based on this implementation of a cross-BF coincidence detector degraded with noise level, with the F1 response being slightly higher than the T1 response in quiet and for the lowest noise level, but equal at the two highest noise levels. This was the general pattern observed across most units for the cross-BF coincidence SMP functions.
A comparison of the relative degradation of each spectral coding scheme with noise is shown in Fig. 5 for the AN fibers for which full STMP data was collected over this range of noise levels. All data presented in Fig. 5 represent fibers from which at least 11 repetitions of all 80 conditions were measured (average of 17 reps). All AN fibers studied showed similar trends, including those for which fewer repetitions were measured (not shown).
For each fiber, the SNR was computed at which spectral coding (as quantified by the SMP slope) degraded to half the value in quiet (see dotted lines in Fig. 4). The rate and cross-BF coincidence schemes both typically degraded at positive SNRs, whereas spectral coding based on ALSR degraded for negative SNRs. The 20-dB range of noise levels was chosen in most cases to cover the range over which rate coding degraded (Fig. 1), and thus it was often the case that ALSR did not degrade over the range of noise levels studied (solid symbols in Fig. 5).
4Discussion
Spectral coding based on rate degraded in all fibers as noise level increased, even low-SR fibers with robust encoding in quiet. The ALSR metric was more robust, often remaining unaffected at SNRs 20 dB lower than rate. The one simple cross-BF coincidence mechanism evaluated here also was much less
114 |
M.G. Heinz |
robust than ALSR, despite its similarity to the Deng and Geisler (1987) and Shamma (1985) models. It is possible that the most robust spatiotemporal information exists between adjacent BFs that are not centered exactly at the formant frequency. Another factor that requires further study is the confounding effect that differences in average discharge rate have on the ability of a coincidence detector to decode differences in across-BF temporal patterns.
Differences in the ALSR values and SCC function shapes between formant and trough responses in noise indicate robust spatiotemporal information does exist for spectral coding of vowels. Alternative spatiotemporal mechanisms for decoding this spectral information can be evaluated based on AN data using the STMP and SCC functions. Spatiotemporal mechanisms have also recently been proposed to be useful for the detection of tones in noise (Carney et al. 2002) and for pitch coding of complex tones (Cedolin and Delgutte 2007).
Acknowledgments Supported by NIH grant R03DC007348. Data collected in the lab of Eric Young, who also provided invaluable support. Diana Ma helped with data collection.
References
Carney, L.H., Heinz, M.G., Evilsizer, M.E., Gilkey, R.H. and Colburn, H.S. (2002) Auditory phase opponency: A temporal model for masked detection at low frequencies. Acustica -Acta Acustica 88, 334-347.
Cedolin, L. and Delgutte, B. (2007) Spatio-temporal representation of the pitch of complex tones in the auditory nerve. In B. Kollmeier, G. Klump, V. Hohmann, U. Langemann, M. Mauermann, S. Uppenkamp and J. Verhey (eds.), Hearing – From Sensory Processing to Perception. Springer Verlag, Berlin, pp. 61-70.
Conley, R.A. and Keilson, S.E. (1995) Rate representation and discriminability of second formant frequencies for /ε/-like steady-state vowels in cat auditory nerve. J. Acoust. Soc. Am. 98, 3223-3234.
Delgutte, B. and Kiang, N.Y. (1984) Speech coding in the auditory nerve: V. Vowels in background noise. J. Acoust. Soc. Am. 75, 908-918.
Deng, L. and Geisler, C.D. (1987) A composite auditory model for processing speech sounds. J. Acoust. Soc. Am. 82, 2001-2012.
Heinz, M.G. (2005) Spectral coding based on cross-frequency coincidence detection of audi- tory-nerve responses. Assoc. for Res. in Otolaryngology Abstracts 28, 27.
Heinz, M.G. and Young, E.D. (2004) Response growth with sound level in auditory-nerve fibers after noise-induced hearing loss. J. Neurophysiol. 91, 784-795.
Joris, P.X. (2003) Interaural time sensitivity dominated by cochlea-induced envelope patterns. J. Neurosci. 23, 6345-6350.
Joris, P.X., Van de Sande, B., Louage, D.H., and van der Heijden, M. (2006) Binaural and cochlear disparities. Proc Natl Acad Sci USA 103, 12917–12922.
May, B.J., Huang, A., Le Prell, G. and Hienz, R.D. (1996) Vowel formant frequency discrimination in cats: Comparison of auditory nerve representations and psychophysical thresholds. Aud. Neurosci. 3, 135-162.
Palmer, A.R. (1990) The representation of the spectra and fundamental frequencies of steadystate singleand double-vowel sounds in the temporal discharge patterns of guinea pig cochlear-nerve fibers. J. Acoust. Soc. Am. 88, 1412-1426.
Sachs, M.B. and Young, E.D. (1979) Encoding of steady-state vowels in the auditory nerve: Representation in terms of discharge rate. J. Acoust. Soc. Am. 66, 470-479.
Spatiotemporal Encoding of Vowels |
115 |
Sachs, M.B., Voigt, H.F. and Young, E.D. (1983) Auditory nerve representation of vowels in background noise. J. Neurophysiol. 50, 27-45.
Shamma, S.A. (1985) Speech processing in the auditory system. II: Lateral inhibition and the central processing of speech evoked activity in the auditory nerve. J. Acoust. Soc. Am. 78, 1622-1632.
Young, E.D. and Sachs, M.B. (1979) Representation of steady-state vowels in the temporal aspects of the discharge patterns of populations of auditory-nerve fibers. J. Acoust. Soc. Am. 66, 1381-1403.
Zhang, X., Heinz, M.G., Bruce, I.C. and Carney, L.H. (2001) A phenomenological model for the responses of auditory-nerve fibers: I. Nonlinear tuning with compression and suppression. J. Acoust. Soc. Am. 109, 648-670.
Comment by Ghitza
Your study is restricted to measurements in anaesthetized cats, with the efferent system not operating. For awaken cats, it may very well be that a rate strategy is sufficient in providing the degree of robustness-to-noise adequate for predicting human performance (e.g. in perceiving degraded speech. See “Towards predicting consonant confusions of degraded speech”, Ghitza et al., this Volume).
Reply
Rate-based coding may be more robust in awake cats with a functioning efferent system. The key question is the degree to which the efferent system improves rate-based coding. The present data suggest that the efferent system needs to improve the robustness of rate-based coding by 20 dB to match temporal-based coding. Modelling studies, such as Ghitza et al. (this volume), are important for demonstrating the potential of the efferent system to improve speech understanding in noise. Unfortunately, experimental data to quantify the true extent to which the efferent system improves speech understanding in noise do not exist. The most relevant data are from May, LePrell, and Sachs (1998), who showed limited evidence suggesting that rate-based coding of vowels in quiet by high-SR primary-like units in the ventral cochlear nucleus (VCN) is more robust in awake cats than in barbiturateanesthetized cats. However, overall rate-based coding of vowels in the VCN was quite similar between awake and anesthetized cats, suggesting that the effects of anaesthesia on vowel coding in the auditory periphery are small.
References
May, B.J., Le Prell, G.S. and Sachs, M.B. (1998) Vowel representations in the ventral cochlear nucleus of the cat: Effects of level, background noise, and behavioral state. J. Neurophysiol. 79, 1755-1767.

13 Role of Peripheral Nonlinearities in Comodulation
Masking Release
JESKO L. VERHEY AND STEPHAN M.A. ERNST
1Introduction
The detection of a signal in the presence of a masker at the signal frequency (on-frequency masker, OFM) is enhanced when one or more additional offfrequency maskers (flanking band, FB) are presented, but only if the FB and OFM are coherently modulated. This phenomenon, known as comodulation masking release (CMR), has been traditionally attributed to across-channel processing. However, it was also argued that part of the effect might be due to the processing within the auditory channel at the signal frequency. Withinchannel effects were usually discussed in relation to a possible excitatory interaction of FB, OFM and signal within the auditory filter at the signal frequency. However, the FB might also suppress the excitation evoked by the OFM (Oxenham and Plack 1998). Suppression can also be regarded as a within-channel cue, since it is an effect related to the nonlinear response of the auditory filter centred at the signal frequency (Ernst and Verhey 2005).
The first two experiments of the present study investigated the role of suppression in CMR experiments with large spectral distances between OFM and FB. CMR was measured with various combinations of level and centre frequencies of OFM and FB. In order to determine the amount of CMR due to nonlinear properties of the basilar membrane, the data are simulated with a suppression model. The model is a modified version of the model proposed by Plack et al. (2002). They showed that a combination of the dual-resonance nonlinear (DRNL) filter (Meddis et al. 2001) and a temporal window (TW, e.g. Oxenham 2001) was able to describe two-tone suppression as observed in psychoacoustical experiments.
In addition to the simulations with a within-channel model, an experiment is performed that was hypothesized to distinguish between withinchannel and across-channel processes in CMR experiments (Dau et al. 2005). Grose and Hall (1993) showed that onset asynchrony can abolish CMR. Dau et al. (2005) extended the experiment of Grose and Hall (1993) using different spectral distances between the OFM and the FBs. They
AG Neurosensorik, Institut für Physik, Fakultät V, Carl von Ossietzky Universität Oldenburg, 26111 Oldenburg, Germany, jesko.verhey@uni-oldenburg.de, stephan.ernst@uni-oldenburg.de
Hearing – From Sensory Processing to Perception
B. Kollmeier, G. Klump, V. Hohmann, U. Langemann, M. Mauermann, S. Uppenkamp, and J. Verhey (Eds.) © Springer-Verlag Berlin Heidelberg 2007
118 |
J.L. Verhey and S.M.A. Ernst |
showed the same effect as Grose and Hall (1993) for large spectral distances between FB and OFM but they found no effect for a small spectral distance between the masker components. They argued that for the small spectral distance CMR is due to a within-channel process on an early stage of the auditory pathway. This process would not be affected by the detrimental effect of onset asynchrony on the perceptual fusion of the masker components, which is presumably a higher level process. The third experiment investigates if the CMR for large frequency separations between FB and OFM is robust against onset asynchrony when the simulations with the suppression model indicate that the CMR is a consequence of the peripheral nonlinearity.
2Suppression Model
The first stage of the model is a combined outer and middle ear filter as used in Breebaart et al. (2001). A low-level noise is added to the output of the filter to approximate the threshold in quiet. The following two stages of the model (DRNL and temporal window) are essentially the same as proposed in Plack et al. (2002). The filter is divided into a linear pathway and a nonlinear pathway. The linear pathway consists of a gammatone filter followed by a low-pass filter. The non-linear pathway consists of a gammatone filter, a compressive nonlinearity and a second gammatone filter. The nonlinear pathway has a gain relative to the linear pathway. The input is processed in parallel through both pathways and then added. In general, all DRNL parameters were taken from Plack et al. (2002). In contrast to Plack et al. (2002), a fourth order gammatone filter was used in the linear pathway and for the second filter of the nonlinear pathway. The output is squared and then passed through the temporal window. The window comprises three exponential functions, one to describe backward masking, and two to describe forward masking. All parameters for the temporal window were taken from Oxenham (2001), which showed the best fit between his data and predictions with the same compression values for the nonlinearity as used by Plack et al. (2002). The decision variable is the quotient of the maximum intensity of the whole temporal window output from the masker plus signal interval and the maximum intensity of the two masker-only intervals. To determine a threshold the decision variable has to exceed the parameter k. The value of k was set to 1.2 in order to match measured and simulated threshold for the reference condition. To determine the threshold with the model the same procedure was used as in the experiment. The final threshold estimate was taken as the mean of 10 threshold estimates. The first stage, the decision device and the derivation of the thresholds differ from the model proposed by Plack et al. (2002) but proved to be necessary for the stochastic stimuli used in the present study.
Role of Peripheral Nonlinearities in Comodulation Masking Release |
119 |
3Methods
All stimuli were generated digitally with a sampling rate of 44.1 kHz, D/A converted (RME ADI-8 DS) and amplified (Tucker-Davis HB7). The stimuli were presented to both ears through headphones (Sennheiser hd580 for the first and third experiments and Sennheiser hda200 for the second experiment). The frequency of the sinusoidal signal differed in the experiments. The signal duration was 250 ms including 50-ms raised-cosine ramps and the signal was temporally centred in the masker. Depending on the masking condition, the masker was composed of one or two 20 Hz wide noise bands. If not specified otherwise the masker duration was 500 ms including 50-ms raised cosine ramps. Each noise band was created by multiplying a sinusoidal carrier with a 10-Hz low-pass-filtered noise extending down to 2 Hz. For each stimulus presentation new noise bands were computed.
The signal threshold was determined for two conditions. The signal was always in phase with the sinusoidal carrier of the masker. In the comodulated condition, the masker was composed of an OFM and a FB with the same envelope, obtained by using the same low-pass filtered noise for OFM and FB. In the reference condition, only the OFM was present. The centre frequency of the noise bands and their levels differed in the experiments.
A three-alternative, forced-choice procedure with adaptive signal-level adjustment was used to determine the masked threshold of the sinusoidal signal. In general, the three intervals in a trial were separated by gaps of 500 ms. The signal was added to one of these intervals. Subjects had to indicate which of the intervals contained the signal. Visual feedback was provided after each response.
The signal level was adjusted according to a two-down one-up rule to estimate the 70.7% detection threshold. The initial step size was 8 dB. After every second reversal the step size was halved until a step size of 2 dB was reached. The run was then continued for another six reversals. From the level of these last six reversals the mean was calculated and used as an estimate of the threshold. Four threshold estimates were collected for each condition. The final threshold value for that condition was taken as the mean of the four threshold estimates.
Normal hearing subjects participated in the experiment varying in age from 23 to 35 years. All subjects had thresholds ≤15 dB HL (ISO 8253-1, 1989) at octave frequencies from 0.125 to 8.0 kHz. They had practice trials in CMR experiments before collecting the data.
4Results and Discussion
4.1Experiment 1
In the first experiment the dependence of CMR on the centre frequency CFFB and the level of the FB was investigated. The signal frequency was 2 kHz and the OFM had a level of 20 dB SPL. The CFFB varied in the range from four octaves
120 |
J.L. Verhey and S.M.A. Ernst |
below the signal frequency to one octave above the signal frequency. The level of the FB was 20, 30, 40, 50, 60, 70, or 80 dB SPL. Only five of the levels of the FB were used for each CFFB with the highest level producing at least 10 dB less excitation in the auditory filter at the signal frequency than the OFM.
The left panel of Fig. 1 shows the mean CMR for 10 listeners, i.e. the difference between the threshold for the reference condition (4 dB re OFM level) and the thresholds for the CM conditions. CMR is plotted as a function of CFFB. Different symbols indicate the CMR for different levels of the FB. Two general trends were observed in the data for CFFB smaller than the signal frequency: (i) CMR increased as the FB level increased and (ii) CMR decreased as the CFFB decreased. The magnitude of CMR was largest (9 dB) for the FB three octaves below the signal frequency and a level of the FB of 80 dB. CMR was generally absent for CFFB higher than the signal frequency (less than 1 dB). Similar trends were observed in Cohen (1991) and Ernst and Verhey (2005).
The right panel of Fig. 1 shows the model predictions. In agreement with the data, the predicted CMR decreased with increasing spectral distance between the FB and the OFM and decreasing level of the FB. In general, the model overestimated the CMR for the highest level of the FB and slightly underestimates the CMR for low levels of the FB. The simulations indicate that also for large spectral distances between the masker components CMR can still be accounted for by within-channel cues as long as the level of the off-frequency components are large compared to the level of the OFM. This interpretation is in line with Oxenham and Plack (1998), who suggested suppression as
|
12 |
|
80 dB SPL |
|
|
|
|
|
70 dB SPL |
|
|
|
10 |
|
60 dB SPL |
|
|
|
|
50 dB SPL |
|
|
|
|
|
|
|
|
|
|
8 |
|
40 dB SPL |
|
|
(dB) |
|
30 dB SPL |
|
|
|
6 |
|
20 dB SPL |
|
|
|
|
|
|
|
||
CMR |
4 |
|
|
|
|
2 |
|
|
|
|
|
|
|
|
|
|
|
|
0 |
|
|
|
|
|
−2 |
data |
|
predictions |
|
|
|
−4 −3 −2 −1 0 |
1 |
−4 −3 −2 −1 0 |
1 |
CFFB / CFOFM (octaves)
Fig. 1 Mean data (left panel) for ten subjects and model predictions (right panel) as function of the centre frequency of the flanking band CFFB relative to the centre frequency of the signal
centred band CFOFM (2 kHz). The level of the OFM was 20 dB SPL. The data for the different levels of the FB are indicated by different symbols. Error bars indicate plus or minus one stan-
dard error
Role of Peripheral Nonlinearities in Comodulation Masking Release |
121 |
a possible mechanism to account for the CMR for FBs centred at frequencies below the signal frequency.
In contrast to the data, a CMR of up to 3 dB was also predicted for CFFB higher than the signal frequency. This is presumably due to the inadequacy of the model to predict suppression in this frequency region (Plack et al. 2002).
4.2Experiment 2
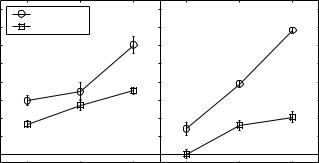
The first experiment showed a substantial CMR (up to 5 dB) over a four octaves range. The topic of the second experiment was to investigate if CMR was also obtained for spectral distances between the masker components larger than four octaves. The FB was centred at 125 Hz. The level of the FB was either 60 or 70 dB HL (i.e. 80 or 90 dB SPL). The signal frequency was 2, 4, or 8 kHz, i.e. four, five, or six octaves above CFFB. The level of the OFM was set to 20 dB HL.
Figure 2 shows mean data for five subjects (left panel) and model predictions (right panel). Different symbols indicate different levels of the FB. The mean thresholds in the reference condition were the same for the different signal frequencies (4–5 dB re OFM level). The data showed the same trends as in the first experiment. The CMR decreased as the spectral distance between FB and signal increased and CMR is larger for the higher level of the FB. A CMR of up to 6 dB was still measured for a spectral distance between FB and OFM of six octaves.
In general, the model predictions show the same trends as the data. However, for the FB centred four octaves below the signal frequency the model
|
16 |
70 dB HL |
data |
predictions |
|
|
|
|
|
||||
|
14 |
60 dB HL |
|
|
|
|
|
12 |
|
|
|
|
|
(dB) |
10 |
|
|
|
|
|
8 |
|
|
|
|
|
|
CMR |
|
|
|
|
|
|
6 |
|
|
|
|
|
|
|
|
|
|
|
|
|
|
4 |
|
|
|
|
|
|
2 |
|
|
|
|
|
|
0 |
|
|
|
|
|
|
−6 |
−5 |
−4 |
−6 |
−5 |
−4 |
CFFB / CFOFM (octaves)
Fig. 2 Mean measured (left panel) CMR for five subjects and model predictions (right panel) as
function of CFFB relative to CFOFM. CFFB was always 125 Hz. The OFM level was set to 20 dB HL. The FB level is indicated by different symbols as shown in the legend. Error bars indicate plus
minus one standard error
122 |
J.L. Verhey and S.M.A. Ernst |
overestimates the CMR for the higher level of the FB and underestimates the CMR for the level of the FB of 60 dB HL. For a spectral distance of six octaves, the model predictions are 3 dB lower than the measured CMR for both levels of the FB. This and the failure of the model to predict CMR for lower levels of the FB and for smaller spectral distances might indicate that part of the CMR is a consequence of an across-channel process and that this process operates over a six octave range.
4.3Experiment 3
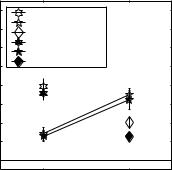
The third experiment investigated if onset asynchrony between the masker components eliminates CMR in conditions where the model predicts a CMR similar to the measured data. In contrast to the previous experiments, the OFM was gated on and off synchronously with the 250-ms signal, i.e. 125 ms after FB onset and 125 ms before masker offset (fringe condition). For comparison, masked thresholds were also measured for a synchronous condition, where all masker components and the signal were gated on and off synchronously. Only four combinations of level and centre frequency of the FB from the first experiment were considered. The FB was centred either two or three octaves below the signal frequency. For both FB positions the two highest levels of the first experiment were used. In these conditions, the suppression model predicted a substantial CMR. Figure 3 shows mean CMR for 11 subjects for the synchronous condition (open symbols) and for the fringed condition (filled symbols) for the two frequency separations between FB and
CMR (dB)
16
14
12
10
8
6
4
2
0
sync 80 dB SPL sync 70 dB SPL sync 60 dB SPL fringe 80 dB SPL fringe 70 dB SPL fringe 60 dB SPL
−3 |
−2 |
CFFB / CFOFM(octaves)
Fig. 3 Mean measured CMR for 11 subjects for two CFFB for a synchronous condition (open symbols), where all masker components were gated on and off synchronously and in the fringe condition (filled symbols), where the FB were gated on earlier and gated off later. The OFM level was 20 dB SPL. The FB level is indicated by different symbols. Error bars indicate plus or minus one standard error