

32 NEUROLOGICAL MONITORS
41.Phillips BA, Anstead MI, Gottlieb DJ. Monitoring sleep and breathing: methodology. Part I: Monitoring breathing. Clin Chest Med 1998;19(1):203–212.
42.Hoppenbrouwers T. Polysomnography in newborns and young infants: sleep architecture. J Clin Neurophysiol 1992;9(1):32–47.
43.Barbosa GA, Keefe MR, Lobo ML, Henkin R. Adaptation of a cardiac monitor for collection of infant sleep data and development of a computer program to categorize infant sleep state. J Nurs Meas 2003;11(3):241–251.
44.Huch R, Huch A, Rooth G. An Atlas of Oxygen-Cardiorespir- ograms in Newborn Infants. London: Wolfe Medical Publications, Ltd.; 1983.
45.Neuman MR, Huch R, Huch A. The neonatal oxycardiorespirogram. CRC Crit Rev Biomed Eng 1984;11:77.
46.Neuman MR, Flammer CM, O’Connor E. Safety devices for neonatal intensive care. J Clin Eng 1982;7:51.
47.Neuman MR. Therapeutic and prosthetic devices. In: Webster JG, editor. Medical Instrumentation: Application and Design. 3rd ed. New York: John Wiley & Sons, Inc.; 1998. pp. 577–622.
See also BLOOD GAS MEASUREMENTS; INCUBATORS, INFANT; MONITORING,
INTRACRANIAL PRESSURE; MONITORING, UMBILICAL ARTERY AND VEIN; TEMPERATURE MONITORING; VENTILATORY MONITORING.
NERVE CONDUCTION STUDIES. See
ELECTRONEUROGRAPHY.
NEUROLOGICAL MONITORS
R. R. GHARIEB
Infinite Biomedical Technologies
Baltimore, Maryland
N. V. THAKOR
Johns Hopkins University
Baltimore, Maryland
INTRODUCTION
The electroencephalogram (EEG) is an electrical activity of the brain that is recorded by using electrodes appropriately placed on the scalp, then amplifying and displaying the electrical signal and its clinical relevant feature using a computer, or other suitable monitors. The EEG signal is a wave that varies in time. This wave contains frequency components that can be measured and analyzed. These frequency components have meaning and valuable properties. Table 1 shows the commonly defined waves or rhythms, their frequency, and their properties. Hans Berger, the discoverer of the EEG in humans, observed in 1924 all of the rhythms known today (except the 40 Hz ‘‘gamma’’ band). The described many of their basic properties. Since then, our definitions and understandings of the rhythms have been refined. However, there still remains some uncertainty, and controversy, in how to define and use these bands, for various purposes. Clinicians view the brainwaves for diagnostic purposes and seek to identify patterns that are associated with specific pathologies or conditions. Psychologists also study them in association with mental states, mental processing, and to test concepts of how the brain processes information (1–6).
The EEG is therefore a noninvasive marker for cortical activity. The EEG in humans and animals is used to monitor alertness; coma and brain death; locate area of damage following head injury, stroke, tumor, and so on; monitor cognitive engagement; control depth of anesthesia; investigate and locate seizure origin; test epilepsy drug effects; monitor human and animal brain development; test drugs for convulsive effects; investigate sleep disorder, monitor and track brain ischemia; and so on. Continuous EEG monitoring is a common routine in the intensive care unit (ICU). However, in digital processed EEG, we study the patterns that emerge during various behavioral, as well as introspective, states, and then see what they are defining in terms of a multidimensional representation of some state space. Research that is focused on understanding specific properties, such as attention, alertness, mental acuity, and so on; has uncovered combinations of rhythms, and other EEG properties, that are relevant to these studies. Generally, derived properties are found, that involve computer processing of the EEG, to produce quantification measurements that are useful for research, monitoring, and so on.
Since high speed computers and sophisticated and efficient digital signal processing methodologies have become available. These properties are significant and new features and properties have been extracted from the EEG signal. These features are combined in a system of multivariable representationtoformulatevariousquantitativeEEG(qEEG) measures. The features commonly employed are (7–21).
Amplitude
Subband powers
Spectrogram
Entropy and complexity
Coherence
Biocoherence
Power spectrum
Joint-time frequency
Spectral edge frequencies
Coefficient-based EEG modeling
Bispectrum
Etc.
In the following section, the EEG monitors are classified and the main devices of the monitor are described. This section presents two types of monitors. In the common specification of Optimized Monitor section, the general specifications of the optimized EEG monitor are provided.
CLASSIFICATION OF EEG MONITORS
What is an EEG Monitor?
The neurological monitor is simply a display that shows the ongoing neurological activity recorded as the electrical potential by appropriately placing electrodes on the scalp. The conventional monitor goes back to EEG machine, where the electrical activity of the brain could be detected and plotted on scaled paper. Today, the neurological monitors are based on advanced technologies. They are
|
|
NEUROLOGICAL MONITORS |
33 |
Table 1. EEG Rhythms their Frequency Bands and Properties |
|
||
|
|
|
|
|
Frequency |
|
|
Rhythm Name |
Band, Hz |
Properties |
|
|
|
|
|
Delta |
0.1–3 |
Distribution: generally broad or diffused, may be bilateral, widespread |
|
|
|
Subjective feeling states: deep, dreamless sleep, non-REM sleep, trance, unconscious |
|
|
|
Associated tasks and behaviors: lethargic, not moving, not attentive |
|
|
|
Physiological correlates: not moving, low level of arousal |
|
|
|
Effects of Training: can induce drowsiness, trance, deeply relaxed states |
|
Beta |
4–7 |
Distribution: usually regional, may involve many lobes, can be lateralized or diffuse; |
|
|
|
Subjective feeling states: intuitive, creative, recall, fantasy, imagery, creative, dream-like, |
|
|
|
switching thoughts, drowsy; oneness, knowing |
|
|
|
Associated tasks & behaviors: creative, intuitive; but may also be distracted, unfocused |
|
|
|
Physiological correlates: healing, integration of mind/body |
|
|
|
Effects of Training: if enhanced, can induce drifting, trance-like state if suppressed, can improve |
|
|
|
concentration, ability to focus attention |
|
Alpha |
8–12 |
Distribution: regional, usually involves entire lobe; strong occipital w/eyes closed |
|
|
|
Subjective feeling states: relaxed, not agitated, but not drowsy; tranquil, conscious |
|
|
|
Associated tasks and behaviors: meditation, no action |
|
|
|
Physiological correlates: relaxed, healing |
|
|
|
Effects of Training: can produce relaxation |
|
|
|
Sub band low alpha: 8–10: inner-awareness of self, mind/body integration, balance |
|
|
|
Sub band high alpha: 10–12: centering, healing, mind/body connection |
|
Low Beta |
12–15 |
Distribution: localized by side and by lobe (frontal, occipital, etc.) |
|
|
|
Subjective feeling states: relaxed yet focused, integrated |
|
|
|
Associated tasks & behaviors: low SMR can reflect ‘‘ADD’’, lack of focused attention |
|
|
|
Physiological correlates: is inhibited by motion; restraining body may increase SMR |
|
|
|
Effects of Training: increasing SMR can produce relaxed focus, improved attentive abilities, |
|
|
|
may remediate Attention Disorders. |
|
Mid-range |
15–18 |
Distribution: localized, over various areas. May be focused on one electrode. |
|
Beta |
|
Subjective feeling states: thinking, aware of self and surroundings |
|
|
|
Associated tasks and behaviors: mental activity |
|
|
|
Physiological correlates: alert, active, but not agitated |
|
|
|
Effects of Training: can increase mental ability, focus, alertness, IQ |
|
High Beta |
15–18 |
Distribution: localized, may be very focused. |
|
|
|
Subjective feeling states: alertness, agitation |
|
|
|
Associated tasks and behaviors: mental activity, for example, math, planning, and so on. |
|
|
|
Physiological correlates: general activation of mind & body functions. |
|
|
|
Effects of Training: can induce alertness, but may also produce agitation, etc. |
|
Gamma |
40 |
Distribution: very localized |
|
|
|
Subjective feeling states: thinking; integrated thought |
|
|
|
Associated tasks and behaviors: high level information processing,‘‘binding |
|
|
|
Physiological correlates: associated with information-rich task processing |
|
|
|
Effects of Training: not known |
|
|
|
|
|
computer based and display not only the raw EEG, but also various quantitative indexes representing processed EEG. The monitors are EEG processors that have the ability to perform data acquisition, automatic artifact removal, EEG mining and analysis, saving/reading EEG data, and displaying the quantitative EEG (qEEG) measures (indexes) that best describe neurological activity and that are clinically relevant to brain dysfunction.
Neurological Monitor Main Components
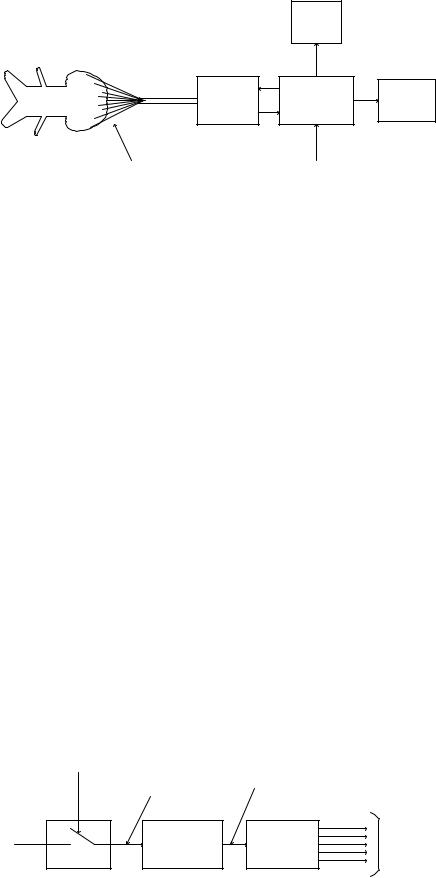
As shown in Fig. 1, a typical neurological monitor consists of a few main devices. These devices are connected together through a microcomputer, which supervises and controls the data flow from one device to another. It also receives and executes the user instructions. It implements the EEG methodology routine. The main devices of a typical monitor can be summarized as follows:
ELECTRODES AND ELECTRODE PLACEMENT
Electrodes represent the electrical link between the subject’s brain and the monitor. These electrodes are appropriately placed on the scalp for recording the electrical potential changes. Electrodes should not cause distortion to the electrical potential recorded on the scalp and should be made of materials that do not interact chemically with electrolytes on the scalp. The direct current (dc) resistance of each electrode should measure no more than a few ohms. The impedance of each electrode is measured after an electrode has been applied to the recording site to evaluate the contact between the electrode and the scalp. The impedance of each electrode should be measured routinely before every EEG recording and should be between 100 and 5,000 V (2).
The international 10–20 system of electrode placement provides for uniform coverage of the entire scalp. It uses
34 NEUROLOGICAL MONITORS
Graphics
display
Subject
Patient cable
Data |
Microcomputer |
Hard copy |
acquisition |
output |
|
system |
|
device |
Figure 1. Block diagram of main components of a neurological monitor.
the distances between bony landmarks of the head to generate a system of lines, which run across the head and intersect at intervals of 10 or 20% of their total length. The use of the 10–20 system assures symmetrical, reproducible electrode placement and allows a more accurate comparison of EEG from the same patients, recorded in the same or different laboratories.
Patient Cable
The patient cable assembles the electrode terminals to the recording machine and monitoring instrument. It is preferable that the patient cable be of short length, which assures low impedance and causes no distortion of the electrical potential representing the neurological activity.
Data Acquisition System
It is composed of filters, amplifiers, analog-to-digital converters (ADC), and buffers. Bandpass filters of 0.5–100 Hz band are usually used to enhance the quality of the EEG signal. High gain amplifiers are required since the electrical potentials on the scalp are of microvolt. The input impedance of the amplifiers should be a large value while the output impedance should be a few ohms. The ADC converter digitizes the EEG data by sampling (converts the continuous-time EEG into discrete-time EEG) the data and assign a quantized number for each sample. Figure 2 shows a schematic diagram for the ADC converter while Fig. 3 shows the output–input characteristic of the uniform quantizer. Uniform quantization generates additive white noise to the EEG signal. Portable and wireless units of ADC have been used. The unit is connected to the monitor device through a standard wireless communication routine. This makes the monitor more comfortable and easier to be used.
Electrodes |
User |
|
input |
|
device |
|
|
Microcomputer
The microcomputer represents the master of the EEG monitor. It controls the data flow from one device to another. It reads the EEG data from the ADC buffers. It also hosts the software of the qEEG approaches and the artifact removal programs. Mathematical operations and analysis are carried out in the microcomputer. After processing the EEG data, the microcomputer sends the EEG signal and its qEEG measure (index) to the display. When the microprocessor is instructed to save the EEG session and its qEEG measure, it sends the data to the hard copy device.
Graphics Display
The graphics display displays the contentious EEG signals and online quantitative EEG (qEEG) measure. It helps the neurologists to follow and track in real-time fashion the changes in the brain activity and to monitor the brain development in the intensive care unit (ICU).
Hard Copy Output Device
This device is connected to the microcomputer and stores a version of the EEG data for future use. It could be a hard drive, computer CD, or a printer–plotter for plotting either version of the EEG or the qEEG measure to be investigated by neurologists and to be a part of the patient record.
User Input Device
Through this device, the user can communicate and interact with the monitor. Instructions and various parameters required for the EEG analysis are sent to the microcomputer through this device.
Sampling |
|
|
|
|
frequency |
Discrete-time |
Quantized |
|
|
Fs Hz |
EEG |
EEG |
|
|
Analog |
|
|
Binary |
|
EEG |
Quantization |
Digitization |
||
numbers |
||||
|
Figure 2. Schematic diagram of the ADC. |
Sampling |
Vo
3q
2q
q
-q/2
|
|
|
|
Vi |
|
q/2 |
3/2 q |
||
|
5/2 q |
|||
|
|
|
|
|
|
|
|
|
|
Figure 3. Input–output characteristic of the uniform quantization system.
TYPES OF EEG MONITORS
The EEG monitors can be classified into two main categories based on either their applications or the quantitative EEG index employed for processing and assessment of the brain electrical activity. Accordingly, the most popular monitors can be categorized as follows (7,22):
Application-Based Monitors
Cerebral function monitor (CFM) Cortical injury monitor (CIM) Anesthesia monitor
Narcotrend monitor
Patient state analyzer (PSA) with frontal patient state index (PSI)
BrainMaster 2E monitor portable bedside monitor
EEG Index-Based Monitors
Amplitude integrated monitor
Spectral index monitor
Spectral-edge frequency monitor
Bispectral index monitor
Entropy and complexity based monitor
This section presents, a very brief description of both monitor types. This description gives the intuition for the neurological applications of the monitor and the EEG index employed.
Cortical Injury Monitor
The lack of blood and oxygen flow to the brain due to cardiac arrest causes brain ischemia, causing brain cells to die, and consequently affecting (changes) brain activity. It has been demonstrated by many studies that brain ischemia slows the brain electrical activity by suppressing the high frequency and enhances the background activity; the cortical injury monitor has been developed and used for the detection and tracking of brain ischemia. The advantage of the monitor comes from the fact that it provides a
NEUROLOGICAL MONITORS |
35 |
quantitative measure extracted from the processed EEG signal for the severity of brain injury after cardiac arrest. It aids neurologists in providing better care for patients with cardiac arrest and provides them with therapeutic intervention, such as hypothermia. The monitor provides assessment of the brain function within the first 4 h after cardiac arrest.
Anesthesia Monitors
Patients receive general anesthesia during surgery. Anesthesia causes reduction of brain activity and concussions. The depth of anesthesia should be evaluated and tracked in real-time fashion to prevent perfect suppression of brain activity. The anesthesia monitor has been developed and used for the assessment of anesthesia and concussions. It provides a quantification measure or index for the depth of anesthesia. The monitor helps patients ‘‘rest easy’’ when they receive general anesthesia for surgery. Of the known anesthesia monitors, the bispectral (BIS) monitor, the narcotrend monitor, and the patient state analyzer (PSA4000) monitor are commonly employed. In the BIS monitor, a qEEG measure based on bispectrum is employed for tracking the depth of anesthesia. The PSA4000 is indicated for use in the operating room (OR), ICU, and clinical research laboratories. The monitor includes the patient state index (PSI), a proprietary computed EEG variable that is related to the effect of anesthetic agent. The narcotrend monitor provides a 6-letter classification from A (awake) to F (general anesthesia with increasing burst suppression). The narcotrend EEG monitor is similar to the BIS monitor positioned on the patient’s forehead. The EEG classification made by the narcotrend monitor are 6 letters: A (awake), B (sedate), C (light anesthesia), D (general anesthesia), E (general anesthesia with deep hypnosis), F (general anesthesia with increasing burst suppression) (23).
Cerebral Function Monitor
The cerebral function monitor (CFM) enables continuous monitoring of the cerebral electrical activity over long periods of time due to slow recording speeds. The cerebral electrical signals picked up by the electrodes attached to the scalp are registered in the form of a curve, which fluctuates to a greater or lesser extent depending on the recording speed. Examination of the height of the curve with respect to zero and its amplitude indicates the voltage of cerebral activity and yields information regarding polymorphism. Thus it is possible to monitor variations in cerebral activity over a prolonged period during anesthesia as well as during the revival phase with the monitor of cerebral function. The CFM is common practice in monitoring the cerebral function in intensive care. To bring the CFM into a polygraphy environment the hardware processing and paper write-out have to be implemented in software. The processor comprises a signal shaping filter, a semilogarithmic rectifier, a peak detector, and low pass filter. After taking the absolute value of the filtered EEG signal, the diode characteristic used to compress the signal into a semilogarithmic value was mimicked by adding a small offset to the absolute value before taking the

36 NEUROLOGICAL MONITORS
Figure 4. Color CFM of 2.5 h, red is high density, blue low density, and black zero. Vertical scale from 0–5 mV linear, from 5–100 mV logarithmic. The median is given in black and the percentiles in white. As only 1 h of data was available to test the reproducibility of the process, we used a repeated playback mode for this picture. The low median episodes are neonatal State 1 (Quiet Sleep) with the beginning trace´-alternant (high peaks followed by low amplitude EEG) with half way diminishing peak heights, and a neonatal State 2 (REM Sleep) with symmetrical continuous EEG.
logarithm. The envelope of the resulting signal has been made by means of a leaky peak detector and a boxcar averager. Writing the resulting signal on a pixelized computer screen at a speed of 6 cm/h, say 200 pixels per hour gives 18 s per pixel. At a sample rate of 200 Hz, 3600 samples will be written to the same pixel column. Only a line connecting the highest and lowest value of the 18 s period will be seen. All information about local density of the signal between the high and low values will be lost. Therefore there is an amplitude histogram per pixel column and a color plot of this histogram is built. To give even more information, the median and the fifth and ninety-fifth percentile as bottom and peak estimates are shown. The CFM is shown to be useful for seizure detection, neonatal, care in the emergency room, and for the assessment of other brain disorders (18,19,21). The CFM trace may require a specialist for its interpretation. An EEG atlas provides a summary for the interpretation of the EEG based trace. Figure 4 shows an example for neonatal EEG monitoring. Studies have shown that when CFM is used in combination with a standard neurological examination, it enhances the clinician’s ability to identify the presence of seizures or to monitor infants EEG and others.
Amplitude-Integrated EEG (aEEG) Monitor
Various brain activities may causes changes in normal EEGs. These changes might be in the amplitude, power, frequency, BIS, entropy or complexity. In fact, since EEG has become available, visual investigation of EEG has been used to asses the neurological function. It is evident that continuous EEG is a sensitive, but nonspecific measure of brain function and its use in cerebrovascular disease is limited. Visual interpretation of EEG is not an easy target and need well-trained expertise, which is not available all the times in the ICU. Besides, information that can be extracted by visual investigation is limited. The EEG amplitude shown in Fig. 5 by the aEEG monitor is the first feature, which has received the attention of neurologists and researchers. It is obvious that there is no clear difference between the aEEG associated with the normal and ischemic injury EEGs. The cerebral function monitor (CFM) uses the aEEG extracted from one channel. The aEEG can show bursts and suppression of the EEG. The
|
104 |
|
|
|
|
|
|
|
aEEG |
102 |
|
|
|
|
|
|
|
|
|
|
|
|
|
|
|
|
|
100 |
50 |
100 |
150 |
200 |
250 |
300 |
350 |
|
0 |
|||||||
|
104 |
|
|
|
|
|
|
|
aEEG |
102 |
|
100
0 |
50 |
100 |
150 |
200 |
250 |
300 |
350 |
Time (s)
Figure 5. Amplitude-integrated EEG for normal EEG (top) and injury-related EEG of grade CPC 5. It is obvious that no significant differences between the two cases, which implies that amplitude may not be used for injury identification.
CFM is well used for seizure detection and neonatal monitoring (18,19,21). However, the EEG amplitude shows low capability. To clarify this disadvantage, let us ask the question: Does isolectrical EEG mean brain death or even coma? There has been a study seeking the answer of this question (24). In this study, from 15 patients with clinical diagnosis as brain death, EEG was isoelectricity in eight patients while the remaining seven showed persistence of electrical activity. Comatose patients may also show the presence of electrical activity in the alpha band (8–13 Hz). Such diagnosis is referred to as alpha coma. This implies that both investigation and monitoring of EEG amplitude may not be a reliable confirmatory test of brain function and coma. The amplitude assessment of the EEG may then mislead the neurologist’s decision.
Spectrogram-Based Monitor
A number of studies have focussed their attention to the prognostication of frequency contents and the power spectrum of EEG (6,20,25,26). The normal EEG of adults often show three spectral peaks in delta, theta, and alpha, as demonstrated in Fig. 5 (top). The most common observation, in ischemic injury, for example, has been slowing background frequencies by increasing the power of delta rhythm and decreasing the powers of theta and alpha rhythms. Numerous approaches have been employed the frequency contents for developing a diagnostic tool or index. Monitoring the real-time spectrum has also been employed. While this approach gives an indication for ischemic injury, it requires a well-trained specialist. In animal studies, the spectral distance between a baseline (i.e., normal) EEG and the underlying injury-related one was employed as a metric for injury evaluation and
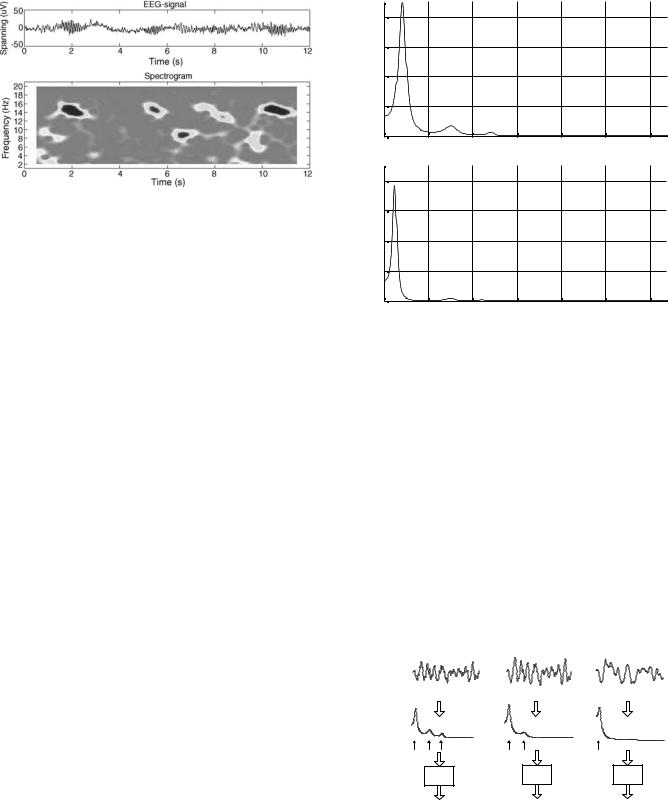
Figure 6. The EEG fragment with isolated 15 Hz spindles, which are clearly visible in the spectrogram. The spectrogram also shows that the spindles are alternated by short periods of 9 Hz activity.
monitoring. However, the spectral distance has the disadvantage of using the whole frequency contents. This is because using the whole frequency contents of the EEG signal increases the likelihood of artifacts-corrupted spectral contents. Time–frequency analysis is a signal analysis technique that provides an image of the frequency contents of a signal as a function of time. Several methods (or time– frequency distributions) can be used, one of which is the spectrogram. The spectrogram is the power spectrum of the investigated signal seen through a time window that slides along the time axis. Figure 6 shows a segment of sleep EEG signal (top) anditsspectrogram.Itisobvious that the spectrogram shows a sleep spindle at 15 Hz. The spectrogram shows the times where the spindle is activated. The time–frequency analysis can then be a helpful tool to facilitate the EEG interpretation, as is shown in the examples below.
Normalized Separation-Based Monitor
As mentioned, ischemic injury manifests itself in the EEG by slowing the background activity and reducing the high frequency. Such injury-related changes can be used for the separation of normal EEG from injury-related one. Based on this frequency information, a normalized separation was adopted as an qEEG measure. The normalized separation is a spectral-based qEEG measure for assessment of severity of brain injury. It uses the most relevant spectral information related to the normal EEG signal. The normal EEG has a power spectral density showing three fundamental spectral peaks as shown in Fig. 7 (top). It has been demonstrated that employing these three peaks is enough to yield a satisfactory quantitative measure. Moreover, looking selectively at the principal features of the EEG spectrum reduces the sensitivity of the measure to noise and artifacts. This is primarily because a full spectrumbased measure is likely to be susceptible to spectral components related to noise and artifacts. Therefore, the normalized separation employs the principal features of the spectrum and ignores the minor features, which are more sensitive to noise and artifacts. In comparison with amplitude-based measures, such as the aEEG, the aEEG is not a quantitative measure and represents a continuous EEG. This finding implies that well-trained specialist are needed for the interpretation of the aEEG trace. The
|
|
|
|
|
NEUROLOGICAL MONITORS |
37 |
||
|
|
8 |
|
|
|
|
|
|
|
|
6 |
|
|
|
|
|
|
PSD |
4 |
|
|
|
|
|
|
|
|
|
|
|
|
|
|
||
|
|
2 |
|
|
|
|
|
|
|
|
0 |
|
|
|
|
|
|
|
|
0 |
20 |
40 |
60 |
80 |
100 |
120 |
|
0.8 |
|
|
|
|
|
|
|
PSD |
0.6 |
|
|
|
|
|
|
|
0.4 |
|
|
|
|
|
|
||
|
|
|
|
|
|
|
||
|
0.2 |
|
|
|
|
|
|
|
|
|
0 |
|
|
|
|
|
|
|
|
0 |
20 |
40 |
60 |
80 |
100 |
120 |
|
|
|
|
|
Frequency (Hz) |
|
|
|
Figure 7. Power spectral density of EEG computed using the AR method applied to 4 s window and averaged >10 windows. (Top) Normal EEG signal and (bottom) abnormal. It is obvious that with abnormal EEG the background frequency gets slower and the high frequencies diminish.
amplitude is also susceptible to noise and artifacts that mislead the interpretation. In comparison with the higher order spectra-based measures, the normalized separation is enough since most information and features of the EEG are described by the power spectrum. A recent study and clinical investigation supports this claim. The EEG is commonly modeled as a stochastic process and for this reason phase is not important. The phase is the only feature retained in higher order spectra. Figure 8 shows three EEG signals and their corresponding normalized separations. The first EEG is very close to normal and provides a normalized separation of 0.2. In the second EEG spectrum, the third peak is diminished and the normalized
EEG
Spectrum |
|
|
|
Quantitative |
NS |
NS |
NS |
EEG |
|||
Processing |
|
|
|
|
0.2 |
0.55 |
0.98 |
Figure 8. Normalized separation for three EEG cases. The left one is normal EEG where three spectral peaks are shown, the middle one is mildly injury-related, and the right one is a severely injury-related EEG. It is obvious that the spectral-based normalization makes significant separation between these three categories.
38 NEUROLOGICAL MONITORS
|
1 |
|
|
|
|
|
|
PSD |
0.8 |
|
|
|
|
|
|
0.6 |
|
|
|
|
|
|
|
Normalized |
|
|
|
|
|
|
|
|
|
Spectral Peak Frequency |
|
||||
0.4 |
|
|
|
|
|
|
|
0.2 |
|
|
0.9 Spectral Edge Frequency |
||||
|
|
|
|
|
|
|
|
|
0 |
10 |
15 |
20 |
25 |
30 |
35 |
|
5 |
||||||
|
|
|
Frequency (Hz) |
|
|
||
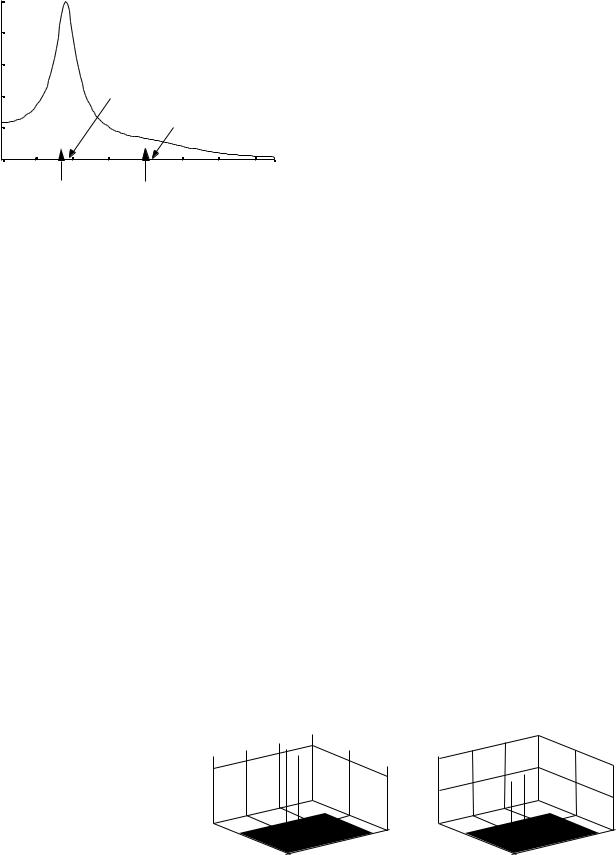
Figure 9. Normalized power spectral density (PSD) showing the spectral peak frequency (SPF) and the 90% spectral edge frequency.
separation is 0.55. In the third EEG spectrum, both second and third spectral peaks are diminished causing the EEG to be separated from the normal EEG by 0.98. The normalized separation ranges from 0 to 1, where the zero value represents and quantifies the normal EEG, while the one value corresponding to the sever abnormal EEG.
Spectral Edge Frequency Monitor
Computers make computation and search for spectral edge frequency of the EEG signal applicable for assessing and monitoring the cortical activity and brain dysfunction. The median frequency and the frequency edges providing 90–95% of the power have been reported to be useful (27,28). The spectral mean and peak frequencies have also been employed (29,30). The success of computing the time-varying spectral edge frequencies depends on the best estimation of the time-varying power spectrum. The fast-Fourier transform (FFT) is a commonly used approach for computing the real-time power spectrum. However, the FFT-based power spectrum provides poor frequency resolution since the resolution is proportional to the reciprocal of the analysis window. The model-based power spectrum estimate, such as the time-varying autoregressive, provides high resolution and low variance estimate of the power spectrum (Fig. 9).
Bispectral Index Monitor
In addition to spectrum, BIS also describes the frequency contents of the EEG. The power spectrum is often used for
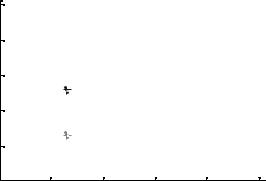
describing the frequency contents of the EEG modeled as a sum of noncoupled harmonics (17,31–33). In such situations, BIS are identically zero. However, if the focus is on the frequency contents of coupled harmonic (quadratic phase coupling harmonics), BIS is often used. Bispectrum is one of the first successful applications of electroencephalography, which measures the effects of anesthetics on the brain. The BIS index is a number between 0 and 100. It produces a number between 0 and 100 (100 represents the fully awake state, and zero no cortical activity). The BIS correlates with depth of sedation and anesthesia, and can predict the likelihood of response to commands and recall. The BIS values correlate with end-tidal volatile agent concentrations, and with blood and effect-site propofol concentrations. It is not very good at predicting movement in response to painful stimuli. However, there has been a recent study, which shows that BIS information is not necessary and power spectrum is satisfactory to describe an EEG signal. Another fact is that BIS is very sensitive to spike artifacts. The BIS index is a quantitative EEG index developed and employed for measuring the depth of anesthesia. It is based on third-order statistics of the EEG signal, specifically BIS density, and is commercially used for monitoring anesthetic patients. The index quantitatively measures the time-varying BIS changes in the EEG signal acquired from the subject before and during anesthesia. The BIS index will be zero when both the baseline and the underlying signal are either identical or Gaussians. This measure has been demonstrated to be effective for depth of anesthesia measurements. However, in some applications (classification of brain injury due to hypoxic/asphyxic cardiac arrest) the principal information and features of the EEG signal lie in second-order statistics, that is the power spectrum, and only minor information and features are associated with higher order statistics. Therefore, indexes based on higher order statistics may not be best suited to classify brain injury due to hypoxia/asphyxia (33). Besides, that higher order statistics are very sensitive to sparse-like artifacts, which deteriorates the index (34). Therefore, employing higher order statistics-based indexes require an efficient artifact removal approach for preprocessing the EEG signal. Below, a simulated example of BIS is presented. In this example, the BIS density is shown to present information on the coupling harmonics. Let x(n) be a time-series consisting of three sinusoidal components whose frequencies are 64, 128, and 192 Hz. It is obvious that harmonic coupling between the first two sinusoids exists. Fig. 10a
Figure 10. Bispectral density (a) and bicoherence (b) of a simulated sinusoidal signal. Bispectral density shows two lines at the coupling frequencies (f1, f2) ¼ (64, 64) and (f1, f2) ¼ (64, 128). Bicoherence shows two lines of unity value at the coupling frequencies.
Bispectraldensity |
0 |
|
5 |
400
|
|
|
|
1 |
|
|
|
|
|
|
|
|
|
|
|
|
|
|
|
|
|
|
|
Bicoherence |
|
|
|
||
|
|
|
|
|
|
|
|||
|
|
|
|
0.5 |
|
|
|
|
|
|
|
|
|
|
|
|
|
|
|
|
|
|
|
0 |
|
|
|
|
|
200 |
|
300 |
400 |
|
|
|
|
300 |
|
|
200 |
200 |
|
100 |
200 |
||||
f 2 (Hz) |
0 0 |
100 |
|
|
f 2 (Hz) |
0 0 |
f 1 (Hz) |
||
f 1 (Hz) |
|
|
|
||||||
|
|
(a) |
|
|
|
|
(b) |
|
|
|
250 |
|
200 |
2 (Hz) |
150 |
f |
|
|
100 |
|
50 |
50 |
100 |
150 |
200 |
250 |
f 1(Hz)
Figure 11. Contour plot of the bicoherence of x(n).
and b shows the mesh plots of the BIS and the two-dimen- sional bicoherence. Figure 11 shows the contour plot of the bicoherence. It is obvious that the BIS density shows two spectral lines at the frequencies (f1, f2) ¼ (64, 64) and (f1, f2) ¼ (64,128). The bicoherence is unity (perfect coupling) at these frequencies.
Entropyand Complexity-Based Monitor
Since the brain processes information, the brain’s total electrical activity probably corresponds to information processing in the brain. This assumption was used to study the entropy or self-information in the EEGs of anesthetic patients, postcardiac arrest, in sleep research, and seizure. Entropy as a measure quantifies the disorder of the EEG signal. It represents the complexity and nonlinearity inherent in the EEG signal. It has been shown that normal control subjects provide larger entropy values than those showing ischemic injury postcardiac arrest. The entropy starts to increase with the recovery of brain function. That is, entropy is a relevant indication of the brain order– disorder following cardiac arrest. The subject under anesthesia provides low entropy, while the awake subject shows high entropy since their brain is full of thinking and activity. Numerous approaches for the calculation of entropy have been used, such as Shannon entropy, approximate entropy, Tasllis entropy, and wavelet entropy.
Complexity based on chaotic, state space and correlation dimension has also been employed for assessment and monitoring of brain function (11–13,22,35–41).
COMMON SPECIFICATIONS OF OPTIMIZED MONITOR
The EEG monitor specifications are the hardware and software properties that make the monitor capable of easily and significantly performing assessment and classification of cortical activity. The monitor should satisfy minimum requirements. Common specifications of EEG monitors may include the following: compact design that is rugged and lightweight; automatic classification of EEG; offand on-line qEEG index; optimized recognition and removal of artifacts; easy operation via friendly touch screen;
NEUROLOGICAL MONITORS |
39 |
continues testing of the electrodes to ensure a constant high quality of the EEG signal; variable electrode position; interface to external monitors and documentation systems; wireless communication between various sensors attached to the human; provides a secure way to transmit and store measured data; high-speed data processing; large amount of memory; on-board Ethernet connection.
CONCLUSION
This article presented a descriptive review for commonly known and employed neurological monitors. The typical neurological monitor consists of a few main devices and the software for running these devices. A brief review of the device specifications and their roles have been given. The monitors are classified into two main categories based on their applications and the indexes acquired from the digital EEG signal and employed for monitoring and assessment of cortical dysfunctions. Intuitions of the EEG monitors, with no mathematical details, have been presented. The article concludes by describing the most common specifications for the optimized monitor.
BIBLIOGRAPHY
1.Schneider G. EEG and AEP monitoring during surgery The 9th ESA Annual Meeting, Gothenburg, Swede, April 7–10, 2001.
2.Fisch BJ. EEG PrimerBasic princibles of digital and analog EEG. Fisch & Spehlmann’s, Third revised and enlarged edition. New York: Elsevier Science BV; 1999.
3.Collura TF. The Measurement, Interpretation, and Use of EEG Frequency Bands. Report Dec. 7, 1997.
4.Berger H. Uber das elecktroenkephalogram des menchen. Arch Psychiatr Nervenkr 1929;87:527–570.
5.Teplan M. Fundamentals of EEG measurement. Meas Sci Rev 2002;2.
6.Gharieb RR, Cichocki A. Segmentation and tracking of EEG signal using an adaptive recursive bandpass filter. Int Fed Med Biol Eng Comput Jan. 2001;39:237–248.
7.Kong X, et al. Qauntification of injury-related EEG signalchanges using distance measure. IEEE Trans Biomed Eng July 1999;46:899–901.
8.Wendling F, Shamsollahi MB, Badier JM, Bellanger JJ. Timefrequency matching of warped depth-EEG seizure observations. IEEE Trans Biomed Eng May 1999;46:601–605.
9.Mingui Sun, et al. Localizing functional activity in the brain through time-frequency analysis and synthesis of the EEG. Proc IEEE Sept. 1996;84:1302–1311.
10.Ning T, Bronzino JD. Bispectral analysis of the rate EEG during various vigilance states. IEEE Trans Biomed Eng April 1989;36:497–499.
11.Hernero R, et al. Estimating complexity from EEG background activity of epileptic patients-Calculating correlation dimensions of chaotic dynamic attractor to compare EEGs of normal and epileptic subjects. IEEE Eng Med Biol Nov./Dec. 1999; 73–79.
12.Roberts SJ, Penny W, Rezek I. Temporal and spatial complexity measures for electroencephalogram based brain-computer interface. Med Biol Eng Comput 1999;37:93–98.
13.Zhang XS, Roy RJ. Predicting movement during anesthesia by complexity analysis of electroencephalograms. Med Biol Eng Comput 1999;37:327–334.
40 NEUROLOGICAL MONITORS
14.Anderson CW, Stolz EA, Shamsunder S. Multivariate autoregressive models for classification of spontaneous electroencephalographic signals during mental tasks. IEEE Trans Biomed Eng March 1998;45:277–286.
15.Hazarika N, et al. Classification of EEG signals using wavelet transform. Signal Process 1997;59:61–72.
16.Quiroga RQ, et al. Searching for hidden information with Gabor transform in generalized tonic-clonic seizures. Electroenceph Clin Neurophysiol 1997;103:434–439.
17.Gajraj RJ, et al. Analysis of the EEG bispectrum, auditory potentials and the EEG power spectrum during related transitions from consciousness to unconsciousness. Br J Anesthes 1998;80:46–52.
18.Toer MC, et al. Amplitude integrated EEG 3 and 6 hours after birth in full term neonates with hypoxic-ischemic encephalopathy. Rch Dis Child Fetal Neonatal Ed 1999;81:19–23.
19.Toet MC, et al. Comparison between simultaneously recoded amplitude integrated EEG (Cerebral function monitor) and standard EEG in neonates. Pediatrics 2002;109:772–779.
20.Hassanpour H, et al. Time-frequency based newborn EEG seizure detection using low and high frequency signatures. Physiol Meas 2004;25:935–944.
21.Nageeb N, et al. Assessment of neonatal encephalopathy by amplitude-integrated EEG. Pediatrics June 1999;103:1263– 1266.
22.Bezerianos A, Tong S, Thakor N. Time-dependent entropy estimation of EEG rhythm changes following brain ischemia. Ann Biomed Eng 2003;31:1–12.
23.Kreuer S, et al. The narcotrend- a new EEG monitor designed to measure the depth of anesthesia. Anethesit 2001;50:921–925.
24.Paolin A, et al. Reliability in diagnosis of brain death. Intensive Care Med Aug. 1995;21:657–662.
25.Jung TP, et al. Estimating alertness from the EEG power spectrum. IEEE Trans Biomed Eng Jan. 1997;44:60–69.
26.Celka P, Colditz P. A computer-aided detection of EEG seizures in infants: A singular spectrum approach and performance comparison. IEEE Trans Biomed Eng May 2002;49:455–462.
27.McDonald T, et al. Median EEG frequency is more sensitive to increase in sympathetic activity than bispectral index. J Neurosurg Anesthesiol Oct. 1999;11:255–264.
28.Inder TE, et al. Lowered EEG spectral edge frequency predicts presence of cerebral white matter injury in premature infants. Pediatrics Jan. 2005;111:27–33.
29.Rampil IJ, Matteo RS. Changes in EEG spectral edge frequency correlated with the hemodynamic response to laryngoscopy and intubation. Anesthesiol 1987;67:139–142.
30.Rampil IJ, Matteo RS. A primer for EEG signal Processing in anesthesia. Anesthesiology 1998;89:980–1002.
31.Akgul T, et al. Characterization of sleep spindles using higher order statistics and spectra. IEEE Trans Biomed Eng Aug. 2000;47:997–1000.
32.Michael T. EEGs, EEG processing and the bispectral index. Anesthesiology 1998;89:815–817.
33.Miller A, et al. Does bispectral analysis of the electroencephalogram add anything bur complexity? B J Anesthesia 2004;92: 8–13.
34.Myles PS, et al. Artifact in bispectral index in a patient with severe ischemic brain injury. Case Report Int Anesth Res Assoc 2004;98:706–707.
35.Radhakrishnan N, Gangadhar BN. Estimating regularity in epileptic seizure time-series data- A complexity measure approach. IEEE Eng Med Biol May/June 1998; 98–94.
36.Lemple A, Ziv J. On the complexity of finit sequences. IEEE Trans Inf Theory Jan 1976;22:75–81.
37.Tong S, et al. Parameterized entropy analysis of EEG following hypoxic-ischemic brain injury. Phys Lett A 2003;314: 354–361.
38.Lerner DE. Monitoring changing dynamics with correlation integrals: Case study of an epileptic seizure source.
39.Xu-Sheng, et al. EEG complexity as a measure of depth of anesthesia for patients. Yearbook of Medical Informatics. 2003; 491–500.
40.Bhattacharya J. Complexity analysis of spontaneous EEG. Acta Neurobiol Exp 2000;60:495–501.
41.Quiroga RQ, et al. Kullback-Leibler and renormalized entropies application to electroencephalogram of epilepsy patients. Phys Rev E Dec. 2000;62:8380–8386.
42.Mizrahi EM, Kellaway P. Characterization and classification of neonatal seizures. Neurology Dec. 1987;37:1837–1844.
Reading List
Blanco S, et al. Time-frequency analysis of electroencephalogram series. Phys Rev 1995;51:2624–2631.
Blanco S, et al. Time-frequency analysis of electroencephalogram series. III wavelet packets and information cost function. Phys Rev 1998;57:932–940.
Caton R. The electric currents of the brain. BMJ 1875;2–278. D’attellis CE, et al. Detection of epileptic events in electroence-
phalograms using wavelet analysis. Annals of Biomed Eng 1997;25:286–293.
Franaszczuk PJ, Blinowska KJ, Kowalczyk M. The application of parameteric multichannel spectral estimates in the study of electrical brain activity. Biol Cybern 1985;51:239–247.
Gabor AJ, Leach RR, Dowla FU. Automated seizure detection using self-organizing neural network. Electroenceph Clin Neurophysiol 1996;99:257–266.
Gath I, et al. On the tracking of rapid dynamic changes in seizure EEG. IEEE Trans Biomed Eng Sept. 1992;39:952–958.
Geocadin RG, et al. A novel quantitative EEG injury measure of global cerebral ischemia. Clin Neurophysiol 2000;11:1779–1787.
Geocadin RG, et al. Neurological recovery by EEG bursting after resuscitation from cardiac arrest in rates. Resucitation 2002;55: 193–200.
Gotman J, et al. Evaluation of an automatic seizure detection method for the newborn EEG Electroenceph Clin. Neurophysiol 1997;103:363–369.
Hernandez JL, et al. EEG predictability:adequacy of non-linear forcasting methods. Int J Bio-Medical Comput 1995;38:197–206.
Holzmann CA, et al. Expert-system classification of sleep/awake states in infants. Med Biol Eng Comput 1999;37:466–476.
Liberati D, et al. Total and Partial coherence analysis of spontaneous and evoked EEG by means of multi-variable autoregressive processing. Med Biol Eng Comput 1997;35:124–130.
Pardey J, Roberts S, Tarassenko LT. A review of parametric modeling techniques for EEG analysis. Med Eng Phys 1996;18:2–11.
Petrosian A, et al. Recurrent neural network based prediction of epileptic seizures in intraand extracranial EEG. Neurocomput 2000;30:201–218.
Popivanov D, Mineva A, Dushanova J. Tracking EEG dynamics during mental tasks-A combined linear/nonlinear approach, IEEE Eng. Med Biol 1998; 89–95.
Quiroga RQ, et al. Performance of different synchronization measures in real data: A case study on electroencephalographic signals. Phys Rev E 2002;65:1–14
Sadasivan PK, Dutt DN. SVD based technique for noise reduction in electroencephalogram signals. Signal Process 1996;55: 179–189.
Salant Y, Gath I, Hebriksen O. Prediction of epileptic seizures from two-channel EEG, Med Biol. Eng Comput 1998;36:549–556.
Schraag S, et al. Clinical utility of EEG parameters to predict loss of consciousness and response to skin incision during total intervention anesthesia. Anesthesia April 1998;53:320–325.