

- •VOLUME 5
- •CONTRIBUTOR LIST
- •PREFACE
- •LIST OF ARTICLES
- •ABBREVIATIONS AND ACRONYMS
- •CONVERSION FACTORS AND UNIT SYMBOLS
- •NANOPARTICLES
- •NEONATAL MONITORING
- •NERVE CONDUCTION STUDIES.
- •NEUROLOGICAL MONITORS
- •NEUROMUSCULAR STIMULATION.
- •NEUTRON ACTIVATION ANALYSIS
- •NEUTRON BEAM THERAPY
- •NEUROSTIMULATION.
- •NONIONIZING RADIATION, BIOLOGICAL EFFECTS OF
- •NUCLEAR MAGNETIC RESONANCE SPECTROSCOPY
- •NUCLEAR MEDICINE INSTRUMENTATION
- •NUCLEAR MEDICINE, COMPUTERS IN
- •NUTRITION, PARENTERAL
- •NYSTAGMOGRAPHY.
- •OCULAR FUNDUS REFLECTOMETRY
- •OCULAR MOTILITY RECORDING AND NYSTAGMUS
- •OCULOGRAPHY.
- •OFFICE AUTOMATION SYSTEMS
- •OPTICAL FIBERS IN MEDICINE.
- •OPTICAL SENSORS
- •OPTICAL TWEEZERS
- •ORAL CONTRACEPTIVES.
- •ORTHOPEDIC DEVICES MATERIALS AND DESIGN OF
- •ORTHOPEDICS PROSTHESIS FIXATION FOR
- •ORTHOTICS.
- •OSTEOPOROSIS.
- •OVULATION, DETECTION OF.
- •OXYGEN ANALYZERS
- •OXYGEN SENSORS
- •OXYGEN TOXICITY.
- •PACEMAKERS
- •PAIN SYNDROMES.
- •PANCREAS, ARTIFICIAL
- •PARENTERAL NUTRITION.
- •PERINATAL MONITORING.
- •PERIPHERAL VASCULAR NONINVASIVE MEASUREMENTS
- •PET SCAN.
- •PHANTOM MATERIALS IN RADIOLOGY
- •PHARMACOKINETICS AND PHARMACODYNAMICS
- •PHONOCARDIOGRAPHY
- •PHOTOTHERAPY.
- •PHOTOGRAPHY, MEDICAL
- •PHYSIOLOGICAL SYSTEMS MODELING
- •PICTURE ARCHIVING AND COMMUNICATION SYSTEMS
- •PIEZOELECTRIC SENSORS
- •PLETHYSMOGRAPHY.
- •PNEUMATIC ANTISHOCK GARMENT.
- •PNEUMOTACHOMETERS
- •POLYMERASE CHAIN REACTION
- •POLYMERIC MATERIALS
- •POLYMERS.
- •PRODUCT LIABILITY.
- •PROSTHESES, VISUAL.
- •PROSTHESIS FIXATION, ORTHOPEDIC.
- •POROUS MATERIALS FOR BIOLOGICAL APPLICATIONS
- •POSITRON EMISSION TOMOGRAPHY
- •PROSTATE SEED IMPLANTS
- •PTCA.
- •PULMONARY MECHANICS.
- •PULMONARY PHYSIOLOGY
- •PUMPS, INFUSION.
- •QUALITY CONTROL, X-RAY.
- •QUALITY-OF-LIFE MEASURES, CLINICAL SIGNIFICANCE OF
- •RADIATION DETECTORS.
- •RADIATION DOSIMETRY FOR ONCOLOGY
- •RADIATION DOSIMETRY, THREE-DIMENSIONAL
- •RADIATION, EFFECTS OF.
- •RADIATION PROTECTION INSTRUMENTATION
- •RADIATION THERAPY, INTENSITY MODULATED
- •RADIATION THERAPY SIMULATOR
- •RADIATION THERAPY TREATMENT PLANNING, MONTE CARLO CALCULATIONS IN
- •RADIATION THERAPY, QUALITY ASSURANCE IN
- •RADIATION, ULTRAVIOLET.
- •RADIOACTIVE DECAY.
- •RADIOACTIVE SEED IMPLANTATION.
- •RADIOIMMUNODETECTION.
- •RADIOISOTOPE IMAGING EQUIPMENT.
- •RADIOLOGY INFORMATION SYSTEMS
- •RADIOLOGY, PHANTOM MATERIALS.
- •RADIOMETRY.
- •RADIONUCLIDE PRODUCTION AND RADIOACTIVE DECAY
- •RADIOPHARMACEUTICAL DOSIMETRY
- •RADIOSURGERY, STEREOTACTIC
- •RADIOTHERAPY ACCESSORIES
406POSITRON EMISSION TOMOGRAPHY
65.Zhang R, Ma PX. Processing of polymer scaffolds: Phase separation. In: Atala A, Lanza R, editors. Methods of Tissue Engineering, San Diego, CA: Academic Press; 2001. p 715– 724.
66.Ishaug SL, et al. Bone formation by three-dimensional stromal osteoblast culture in biodegradable polymer scaffolds. J Biomed Mater Res 1997;36:17–28.
67.Ishaug-Riley SL, et al. Ectopic bone formation by marrow stromal osteoblast transplantation using poly(DL-lactic-co- glycolic acid) foams implanted into the rat mesentery. J Biomed Mater Res 1997;36:1–8.
68.Sherwood JK, et al. A three-dimensional osteochondral composite scaffold for articular cartilage repair. Biomaterials 2002;23:4739–4751.
69.Athanasiou KA, Schmitz JP, Agrawal CM. The effects of porosity on in vitro degradation of polylactic acid-polyglycolic acid implants used in repair of articular cartilage. Tissue Eng 1998;4:53–63.
70.Agrawal CM, McKinney JS, Lanctot D, Athanasiou A. Effects of fluid flow on the in vitro degradation kinetics of biodegradable scaffolds for tissue engineering. Biomaterials 2000;21:2443–2452.
71.Lightfoot EN. Transport phenomena and living systems. New York: John Wiley & Sons, Inc.; 1974.
72.Colton CK. Implantable biohybrid artificial organs. Cell Transplant 1995;4:415–436.
73.Hulbert SF, et al. Potential of ceramic materials as permanently implantable skeletal prostheses. J Biomed Mater Res 1970;4(3):433–456.
74.Yuan H, et al. A preliminary study on osteoinduction of two kinds of calcium phosphate ceramics. Biomaterials 1999;20(19):1799–1806.
75.Turner S, et al. Cell attachment on silicon nanostructures. J Vas Sci Technol B 1997;15:2848–2854.
76.Pattison MA, Wurster S, Webster TJ, Haberstroh KM. Threedimensional, nano-structured PLGA scaffolds for bladder tissue replacement applications. Biomaterials 2005;26(15): 2491–2500.
77.Gibson LJ, Ashby MF. Cellular Solids: Structure and Properties. 2nd ed. Cambridge University Press; 1997.
78.Ma PX, Langer R. Fabrication of Biodegradable Polymer foams for cell transplantation and tissue engineering. In: Yarmush M, Morgen J, editors. Tissue Engineering Methods and Protocols, Totowa, NJ: Humana Press; 1998. p 47–56.
79.Ma Z, Gao C, Gong Y, Shen J. Paraffin spheres as porogen to fabricate poly(L-lactic acid) scaffolds with improved cytocompatibility for cartilage tissue engineering. J Biomed Mater Res Part B 2003;67(1):610–617. Mikos AG, et al. Preparation and characterization of Poly(L-lactic acid) foams. Polymer 1994;35:1068–1077.
80.Liu X, Ma PX. Polymeric scaffolds for bone tissue engineering [Review]. Ann Biomed Eng 2004;32(3):477–486.
81.Harris LD, Kim BS, Mooney DJ. Open pore biodegradable matrices formed with gas foaming. J Biomed Mater Res 1998;42:396–402.
82.Mooney DJ, et al. Novel approach to fabricate porous sponges of poly(D,L-lactic-co-glycolic acid) without the use of organic solvents. Biomaterials 1996;17:1417–1422.
83.Nam YS, Park TG. Porous biodegradable polymeric scaffolds prepared by thermally induced phase separation. J Biomed Mater Res 1999;47:8–17.
84.Whang K, Thomas CH, Healy KE, Nuber G. A novel method to fabricate bioabsorbable scaffolds. Polymer 1995;36(4):837– 842.
85.Ho MH, et al. Preparation of porous scaffolds by using freezeextraction and freeze-gelation methods. Biomaterials 2004;25:129–138.
86.Matthews JA, Wnek GE, Simpson DG, Bowlin GL. Electrospinning of collagen nanofibers. Biomacromolecules 2002;3: 232–238.
87.Reneker DH, Chun I. Nanometre diameter fibres of polymer, produced by electrospinning. Nanotechnology 1996;7:216–223.
88.Giordano RA, et al. Mechanical properties of dense polylactic acid structures fabricated by three dimensional printing. J Biomater Sci-Polym Ed 1996;8:63–75.
89.Ma J, Wang C, Peng KW. Electrophoretic deposition of porous hydroxyapatite scaffold. Biomaterials 2003;24(20):3505–3510.
90.Chang, et al. 2005.
91.Popat KC, et al. Influence of nanoporous alumina membranes on long-term osteoblast response. Biomaterials 2005;26(22): 4516–4522.
92.Shimko DA, et al. Effect of porosity on the fluid flow characteristics and mechanical properties of tantalum scaffolds. J Biomed Mater Res Part B Appl Biomater 2005;73(2):315–324.
93.Goodman SL, Sims PA, Albrecht RM. Related Articles, Links Three-dimensional extracellular matrix textured biomaterials. Biomaterials. 1996;17(21):2087-2095.
94.Ayad S, et al. The extracellular matrix factsbook, San Diego, CA: Academic Press; 1994.
95.Baraton MI, Chen X, Gonsalves KE. FTIR study of a nanostructured aluminum nitride powder surface: Determination of the acidic/basic sites by CO, CO2 and acetic acid adsorptions. Nanostruct Mater 1997;8(4):435–445.
96.Klabunde KJ, et al. Nanocrystals as stoichiometric reagents with unique surface chemistry. J Phys Chem 1996; 100:12142–12153.
97.Gutwein LG, Webster TJ. Increased viable osteoblast density in the presence of nanophase compared to conventional alumina and titania particles. Biomaterials 2004;25(18):4175–4183.
98.Webster TJ, Ejiofor JU. Increased osteoblast adhesion on nanophase metals: Ti, Ti6Al4V, and CoCrMo. Biomaterials 2004;25(19):4731–4739.
99.Price RL, et al. Osteoblast function on nanophase alumina materials: Influence of chemistry, phase, and topography, J Biomed Mater Res 2004;67(4):1284–1293.
100.Chun AI, Moralez JG, Fenniri H, Webster TJ. Helical rosette nanotubes: a more effective orthopaedic implant material. Nanotechnology 2004;15(4):S234–S239.
101.McKenzie JL, Waid MC, Shi R, Webster TJ. Decreased functions of astrocytes on carbon nanofiber materials. Biomaterials 2004;25(7–8):1309–1317.
See also BIOMATERIALS: TISSUE ENGINEERING AND SCAFFOLDS; ORTHOPEDICS, PROSTHESIS FIXATION FOR; VASCULAR GRAFT PROSTHESIS.
POSITRON EMISSION TOMOGRAPHY
GEORGE KONTAXAKIS
Universidad Polite´cnica de
Madrid
Madrid, Spain
INTRODUCTION: FROM MEDICAL TO MOLECULAR IMAGING
Medical imaging conventionally refers to the non invasive or minimally invasive techniques employed to view internal organs of the body, typically for diagnosing disease. In a broader sense, it refers to a field that enables acquisition, processing, analysis, transmission, storage, display, and
archiving of images of internal body parts for interpretation and patient management (diagnosis, disease staging and evaluation, treatment planning and follow-up). Medical imaging was practically born with the discovery of the X rays by W. C. Roentgen in 1895 and has since based its success on observation and the accumulated experience of the examining physician.
Molecular imaging is a natural out grown of the medical imaging field. Recent advances in molecular biology have resulted in an improved understanding of many disease and natural processes. Consequently, molecular imaging links the empirical diagnostics and experimentally tried treatment management protocols with the fundamental understanding of the underlying processes that generate the observed results. As discoveries of the molecular basis of disease unfold, one top research priority is the development of imaging techniques to assess the molecular basis of cell dysfunction and of novel molecular therapy. Molecular imaging techniques are ideally based on technologies that have an intrinsically high resolution (spatial and temporal) and allow the detection of low concentrations of target biomolecules involved, such as nuclear medicine imaging (Positron Emission Tomography, PET; Single-Photon Emission Tomography, SPET), magnetic resonance imaging (MRI) and spectroscopy (MRS), optical tomography, autoradiography, or acoustical imaging.
The examination of biochemical processes with an imaging technology is of vital importance for modern medicine. As, in most cases, the location and extent of a disease is unknown, the first objective is an efficient means of searching throughout the body to determine its location. Imaging is an extremely efficient process for accomplishing this aim, because data are presented in pictorial form to the most efficient human sensory system for search, identification, and interpretation: the visual system. Recognition depends on the type of information in the image, both in terms of interpreting what it means and how sensitive it is to identifying the presence of disease.
PET stands in the forefront of molecular imaging and allows the quantitative evaluation of the distribution of several pharmaceuticals in a target area in vivo. PET is a unique diagnostic imaging technique for measuring the metabolic activity of cells in the human body. It produces images of the body’s basic biochemistry and biological activity in a noninvasive way, combining techniques applied in nuclear medicine with the precise localization achieved by computerized image reconstruction. PET is therefore a powerful diagnostic test that is having a major impact on the diagnosis and treatment of disease, as well as on patient management.
PET images can demonstrate pathological changes and detect and stage tumors long before they would be revealed with other conventional imaging modalities. Traditional diagnostic techniques, such as X rays, computerized tomography (CT) scans, or MRI, produce anatomical images of what the internal organs look like. The premise with these techniques is that a visible structural change exists in anatomy caused by disease. However, biochemical processes are also altered with disease and may occur before a change in gross anatomy occurs. Furthermore, PET can provide medical doctors with important early information
POSITRON EMISSION TOMOGRAPHY |
407 |
about very subtle changes of function in the brain and heart, due to disease-related modifications in tissue perfusion, cell metabolic rates heart disease, or neurological disorders (Alzheimer’s, Parkinson’s, epilepsy, dementia, etc.), allowing physicians to diagnose and treat these diseases earlier and, consequently, more efficiently and accurately, according to the axiom ‘‘the earlier the diagnosis, the better chance for treatment.’’ PET can also help physicians monitor a patient’s response to treatment, as well as identify distant metastases that can affect treatment, helping curtail ineffective treatments and reduce unnecessary invasive procedures. The field of PET has been emerging today into clinical diagnostic medicine and is approved by many insurance carriers for coverage.
HISTORY OF PET
The positron emission and detection of the radiation produced was a known technique that dates back to the early days of the twentieth century. However, it is only in the last few decades, with the booming development of fast electronic circuits and powerful computer systems, that this knowledge could be used in practice as a valuable diagnostic tool: The electronic circuits used in PET should be able to detect the coincidental arrival of two high energy photons (a timing resolution of the order of few nanoseconds), and the image reconstruction requires modern computer systems in order to produce an accurate image of the activity distribution within a clinically reasonable time.
In the beginning of the 1950s, researchers at the Massachusetts General Hospital (MGH) in Boston and the Duke University in Durham proposed the idea that, in spite of the short half-lives of the, by that time recently discovered, positron-emitting radionuclides, they offered an attractive method for the regional study of metabolism due to their commonality. A single-detector pair brain probe was then developed at MGH and used in experiments. However, it was not until the early 1960s that these positron-emitting radionuclides began to gain popularity, when a number of centers such as the MGH in Boston, the Sloan Kettering Institute in New York, Ohio State University, and the University of California at Berkeley began to use cyclotrons. At the same time, the first image reconstruction techniques were proposed by researchers at MGH, and, in the early 1970s, the concept of computerized tomography (CT) was presented by Hounsfield, who later was awarded with the Nobel Prize.
In the early 1970s, the first PET scanners were developed at the MGH, the Brookhaven National Laboratory, the Washington University, and the Montreal Neurological Institute in Canada, used then as research tools. At the same time, a private company (EG&G OTREC, Oak Ridge, TN, USA) got involved in the developments of the first ring PET scanners, joined in the market a couple of years later by TCC (The Cyclotron Corporation, Berkeley, CA, USA), and in 1976 the first commercial PET scanner was delivered at the University of California, Los Angeles (UCLA). A year later, Scanditronix from Sweden brought Europe into PET. The first PET scanners used single slices when

408 POSITRON EMISSION TOMOGRAPHY
performing tomographs, with transaxial resolution greater than 2 cm full-width half-maximum (FWHM) and used NaI crystal material. Such systems were installed at several research institutions, apart from the ones mentioned above, like the University of California at Berkeley, the Lawrence Berkeley Laboratory, and the University of Pennsylvania.
By the end of 1970s, PET had shown its potential for application to clinical medicine. The following generation of PET scanners reduced detector size and added additional rings to allow for simultaneous acquisition of multiple slices. The slice resolutions improved from greater than 2 cm FWHM to less than 1 cm FWHM. As time progressed, more detectors and photomultiplier tubes (PMTs) were added to these machines to increase their sensitivity and resolution. In the mid-1980s, the first BGO pixelated detector blocks were presented. At the same time, the first dedicated medical PET cyclotron units with automated radiopharmaceutical delivery systems were commercially available.
At the end of 1980s, the major medical imaging companies (mainly Siemens with CTI PET, Inc., and General Electric with Scanditronix) began investing in PET. The first whole-body PET scanners have been presented and research in new detector materials led to significant discoveries (LSO, etc.) in the beginning of the 1990s. Since then, PET has shown a steady increase in acceptance for clinical application, both medically and administratively, and PET centers are being installed worldwide at an increasing pace. PET is now a well-established medical imaging technique that assists in the diagnosis and management of many diseases.
More details on the history of PET instrumentation and the related developments can be found in References 1 and 2.
PHYSICAL PRINCIPLES OF PET
PET images molecules of substances with a specific biological activity. In order to monitor their distribution, kinetic characteristics, and behavior of (pharmaceuticals) within the body, these substances are tagged with radioactive compounds (with short half-life and at extremely low concentrations) (3). These radiopharmaceuticals are chosen to have a desired biological activity, depending on the metabolic activity of the organ under study, and are introduced to the subject by injection or inhalation.
The most commonly used radionuclides are listed in Table 1 and are compounds that constitute, or are consumed by, the living body, like carbon, nitrogen, and oxy-
Table 1. The Most Commonly Used Radionuclides in PET
Radionuclide |
Half-life |
|
|
Carbon-11 |
20.3 min |
Nitrogen-13 |
9.97 min |
Oxygen-15 |
2.03 min |
Fluorine-18 |
1.83 h |
Gallium-68 |
1.83 h |
Rubidium-82 |
1.26 min |
|
|
Table 2. Major PET Radiopharmaceuticals and their Specific Medical Applications
Agent |
Images |
|
|
F-18 fluorodeoxyglucose |
Regional glucose metabolism |
F-18 sodium fluoride |
Bone tumors |
C-11 methionine |
Amino acid uptake/protein |
|
synthesis |
C-11 choline |
Cell membrane proliferation |
C-11 deoxyglucose |
Regional brain metabolism |
O-15 oxygen |
Metabolic rate of oxygen use/OEF |
C-11 carbon monoxide |
Cerebral blood volume |
O-15 carbon monoxide |
Cerebral blood volume |
O-15 water |
Cerebral blood flow |
O-15 carbon dioxide |
Cerebral blood flow |
(Inhaled) |
|
C-11 butanol |
Cerebral blood flow |
C-11 N-methylspiperone |
Dopamine D2 and Serotonin |
|
S2 receptors |
F-18 N-methylspiperone |
D2 and S2 receptors |
C-11 raclopride |
D2 receptors |
F-18 spiperone |
D2 receptors |
Br-76 bromospiperone |
D2 receptors |
C-11 carfentanil |
Opiate mu receptors |
C-11 flumazenil |
Benzodiazepine (GABA) receptors |
|
|
gen. They are isotopes of biologically significant chemical elements that exist in all living tissues of the body and in almost all nutrients. Therefore, the above radionuclides are easily incorporated in the metabolic process and serve as tracers of the metabolic behavior of the body part, which can be studied in vivo.
Table 2 shows a list of the major radiopharmaceuticals used as PET agents with their specific medical applications. The most common radiopharmaceutical used in PET studies today is fluorodeoxyglucose (FDG) (4), a chemical compound similar to glucose, with the difference that one of the -OH groups has been replaced by F-18. Carbon-11 can also be used as a radiotracer to glucose. The short half-lives of these particles allow the subject and the people handling them to receive only a low radiation dose.
The identification and detection of the presence of the molecules of the radiotracer in a specified location within the source (i.e., the body under study) is performed by a chain of events, based on physical principles and data processing techniques, which are schematically depicted in Fig. 1 and briefly described below.
A positron is emitted during the radioactive decay process, annihilates with an electron, and, as a result, a pair of g rays is emitted (two high energy photons of 511 keV each). The two g rays fly off in almost opposite directions (according to the momentum conservation laws), penetrate the surrounding tissues, and can be recorded outside the subject’s body by scintillation detectors placed on a circular or polygonal detector arrangement, which forms a PET tomograph. When the g ray hits a scintillation detector material, it then deposits its energy in that crystal by undergoing photoelectric effect, which is an atomic absorption process where an atom totally absorbs the energy of an incident photon (5). This energy is then used to eject an orbital electron (photoelectron) from the atom and is,
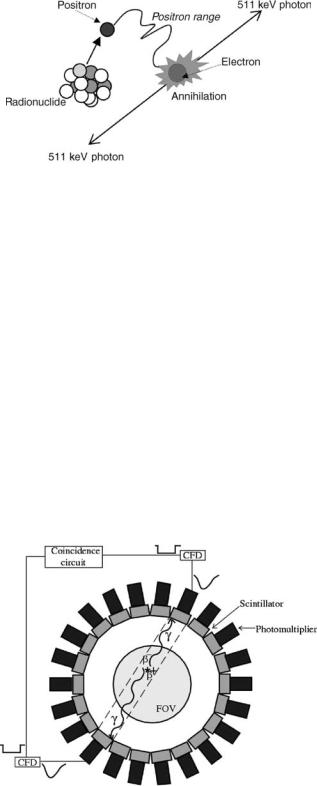
Figure 1. This schematic depicts the chain of events that described the physical properties of high energy gamma pair emission from positron-emitting radioisotopes. All radioisotopes used with PET decay by positron emission. Positrons are positively charged electrons. Positron emission stabilizes the nucleus of unstable radioisotopes by removing a positive charge through the conversion of a proton into a neutron. An emitted positron travels a short distance (positron range, which depends on the energy of the positron) and collides with an ordinary electron of a nearby atom in an annihilation reaction. When the two particles annihilate, their mass turns into two 511 keV gamma rays that are emitted at 1808 to each other. When detected, the 1808 emission of two gamma rays following the disintegration of positronium is called a coincidence line. Coincidence lines provide a unique detection scheme for forming tomographic images with PET.
therefore, transformed in visible light. This light can be detected by specialized devices (photomultiplier tubes, PMT) that capture and transform it into an electronic signal, shaped at a later stage by the electronic circuits of the tomograph to an electronic pulse, which provides information about the timing of the arrival of the incident g ray and its energy. Figure 2 summarizes the principles of gamma ray event detection in PET described here.
Figure 2. Scintillation detectors coupled to photomultiplier tubes are placed around the detector ring of the scanner. An annihilation event ( ) inside the field of view (FOV) produces two g rays that get detected by a pair of detectors. The event is identified to occur inside a specific detector tube (dashed stripe) by the electronic devices (constant fraction discriminators, CFD, and the coincidence detection circuit) that connect every pair of detectors.
POSITRON EMISSION TOMOGRAPHY |
409 |
By measuring a coincidence photon, the detector array in a PET system identifies that an annihilation event occurred inside the volume defined between the surfaces of the pair of detectors that registered the coincidence event. At the end of a PET scan, for each pair of detectors, a number of coincidence events that have been identified exist. This information represents the radioactivity in the subject viewed at different angles, when sorted in closely spaced parallel lines. In order to reconstruct the activity density inside the source from its projections (events registered at each detector pair), a mathematical reconstruction algorithm is applied by computer. The collected data are corrected for scatter, attenuation, and accidental coincidences; normalized for the differences in detector efficiencies, and reconstruct the spatial distribution of the radioactivity density inside the organ or the system under study in the form of a 2D or 3D image. The result is a digital image of the source, where the value of each picture element (pixel) or, in modern 3D tomograph systems, volume element (voxel) is proportional to the activity density inside the source at the area (or volume) that corresponds to this pixel/voxel. This image can be directly displayed on a screen. Further analysis of the data and processing of the produced images can be carried out with the use of a computing system.
A high energy photon produced by an annihilation event can deviate from its original trajectory if it gets involved in Compton scattering inside the subject’s body, a collision between a photon and a loosely bound outer-shell orbital electron of an atom. In this case, because the incident photon energy greatly exceeds the binding energy of the electron to the atom, the interaction can be considered as a collision between the photon and a ‘‘free’’ electron. The photon does not disappear in Compton scattering, but it is deflected through a scattering angle u and some of its energy is transferred to the electron (recoil electron) (5). In the case this ray gets detected in coincidence with the second gamma produced at the same event, then this event will be counted to have occurred in a detector tube that will not contain the original annihilation site: This is an erroneous event (scattered event).
It is also possible that this ray will never reach a detector crystal and, therefore, get lost. This type of Compton scattering, along with photoelectric absorption of the produced gamma rays inside the source, where they have been generated, are the major sources of attenuation of the emitted radioactivity.
The physics of positron emission allow for attenuation correction of the collected data, which can produce a quantitatively (but also qualitatively) accurate image that may resolve small lesions, especially when these lie deep within the body. In order to correct for attenuation, two additional measurements are typically performed: the blank scan and the transmission scan. The blank scan is recorded using an external source without the patient, representing the unattenuated case. For the transmission scan, the patient and the bed are placed into the scanner and the attenuated data are measured using the external source. The attenuation correction factors (ACF) can be calculated as the ratio of the measured counts without and with the attenuating object. The disadvantages of attenuation correction are that it

410 POSITRON EMISSION TOMOGRAPHY
requires more time for image acquisition and the potential exists to add noise to the image if the attenuation measurements become misaligned by patient motion or if inadequate statistics in the transmission scan are collected. As a result of noise, transmission measurements are usually smoothed prior to the division. Otherwise, the noise in the ACF propagates to the corrected emission sinogram. The drawback of smoothing is that the resulting blurring of ACFs propagates to the emission sinogram as well. Techniques for the reduction of noise propagation include, as an example, classification techniques for the main tissue categories observed in the transmission images (segmentation) or the use of iterative methods for the reconstruction of the transmission images (6).
Compton scattering can also occur inside the detector crystal before the ray undergoes (the desirable) photoelectric effect. In that case, it is possible that the ray will escape the detector material and deposit its energy in an adjacent scintillator, causing the detected event to be mispositioned. Another source of erroneously counted events is the coincidental arrival at the detector ring of two single gamma rays coming from two different annihilation events (random or accidental coincidence). When three or more g rays arrive at the detector ring within the time coincidence window set by the electronic circuitry of the scanner for the coincidence detection, then these gammas must be rejected, because it is not possible to recognize, in that case, the pairs of photons that came from the same annihilation event (7).
The high energy gamma rays have increased penetrating abilities and can be detected coming from deep-lying organs better than a particles or electrons (b particles), which can penetrate only a few millimeters of tissue and, therefore, cannot get outside the body to the radiation detector (5). Imaging system detectors must, therefore, have good detection efficiency for g rays. It is also desirable that they have energy discrimination capability, so that g rays that have lost energy by Compton scattering within the body can be rejected and a good timing resolution to accurately measure the time difference of the arrival of two photons. Sodium iodide (NaI), BaF2 (barium fluoride), and BGO (bismuth germanate oxide) provide both of these features at a reasonable cost (5). Research for new scintillator materials, like LSO (lutetium oxyorthosilicate) (8), GSO (germanate oxide) (9), PbCO3 (lead carbonate) (10), PbSO4 (lead sulfate) (11), CeF3 (cerium fluoride) (12), YalO (13), and LuAlO (14), is very active in an effort to produce faster detector crystals with good stopping power and light output.
Table 3 summarizes some of the main physical properties of the scintillators used for PET: NaI(Tl), BGO, BaF2,
CsF, GSO, and LSO. In order to interpret this table, assume the following:
-An elevated density guarantees a high stopping power for the high energy 511 keV annihilation photons and consequently assures elevated detection efficiency. High stopping power also allows the use of crystals of small dimensions, which means an improved spatial resolution of the tomograph.
-High scintillation efficiency, due to a good intrinsic energy resolution of the crystal, leads to a good energy resolution of the detection system, which leads to a better discrimination of scatter.
-A fast scintillation (described by a short scintillation constant decay time) translates to a low dead time of the system and, therefore, to good count rate performance. Moreover, this property directly influences the temporal resolution (uncertainty of the moment of detection), on which depends the choice of the length of the time coincidence resolution window and, therefore, the rate of accidental coincidences.
The comparison of the characteristics of scintillation crystals shows that the ideal scintillator for PET must have the temporal characteristics (decay time) of BaF2, the density (stopping power) of BGO, and the scintillation efficiency (light output) of NaI(Tl) (15). It also reveals that the newest crystals GSO and LSO are very promising for PET applications.
Originally, NaI was the detector of choice for nuclear medicine imaging cameras and is still in use by some manufacturers of gamma cameras, SPET, and even PET systems. NaI is a scintillation crystal discovered in 1949 with very high scintillation efficiency but a stopping power too low for high energy photons; therefore, NaI has very low sensitivity. In the 1980s, BGO emerged as the detector of choice for PET scanners, a material with considerably lower light output than NaI but, on the other side, twice as dense and, therefore, able to detect high energy photons more effectively. LSO was discovered in the early 1990s and exhibits a very fast scintillation time (40 ns), which provides significantly reduced detector dead time and consequently higher count-rate capabilities, which is essential in clinical PET imaging in order to use the injected activity most efficiently and to make the emission scan time as short as possible, meaning the patient spends less time immobile on the tomograph’s bed without compromising the image quality.
In the optimization of the design of a PET tomograph, an important aspect is the way crystals are assembled and the
Table 3. Scintillation Crystal Characteristics
|
NaI |
BGO |
BaF2 |
CsF |
LSO |
GSO |
Density (g/cm3) |
3.67 |
7.13 |
4.87 |
4.64 |
7.40 |
6.71 |
Relative scintillation efficiency |
100 |
20 |
16 |
6 |
75 |
30 |
Decay constant (ns) |
250 |
300 |
0.6 |
2.5 |
40 |
60 |
Hygroscopic |
Yes |
No |
No |
Yes |
No |
No |
|
|
|
|
|
|
|
way they are coupled to the photomultiplier tubes. Various strategies have been developed, including:
-one-to-one connection crystal-PMT (5);
-detector blocks, where a crystal array (mainly BGO or LSO) is coupled to a smaller number of PMTs (15,16);
-NaI(Tl) crystals of large dimensions coupled to a grid of PMT (Anger logic, common to gamma cameras) (17);
-the most recent design of a system of GSO crystals coupled to light guides to a PMT grid (18).
Scintillation detectors have been the dominant element in high energy gamma ray detection for PET. However, other technologies have also been applied, explored, and developed for this purpose. One of the oldest alterantive technologies is the High Density Avalanche Chamber (HIDAC) PET system (19), which consists of a Multiwire Proportional Chamber (MWPC) with the provision of laminated cathodes containing interleaved lead and insulating sheets and mechanically drilled with a dense matrix of small holes. Ionization resulting from photons interacting with the lead is trapped by, amplified in, and extracted from, the holes by a strong electric field into the MWPC. On arrival at an anode wire, further avalanching occurs. Coordinate readout may be obtained from orthogonal strips on the cathodes. The result is precise, 2D localization of the incident gamma rays. Every hole on the cathodes acts as an independent counter. By stacking these MWPCs, millions of these counters are integrated to form a large-area radiation camera with a high spatial resolution.
The resolution of a PET scanner primarily depends on the size of the detectors and on the range of positrons in matter (distance traveled by the positron in the tissue before interacting with a free electron, see also Fig. 1). For most of the positron emitters, the maximum range is 2–20 mm. However, the effect on spatial resolution is much smaller, because positrons are emitted with a spectrum of energies and only a small fraction travel the maximum range, and, in addition, in case of 2D acquisitions, the range of the third dimension is compressed. Another limitation in the resolution is that the paired annihilation photons are not emitted precisely 1808 from each other, because the eþ–e system is not at complete rest. Other components of the system resolution are the sampling scheme used, the interactions between more than one crystal due to intercrystal scatter, the penetration of annihilation photons from off-axis sources to the detector crystals, the reconstruction technique used, the filters applied, and the organ and patient motion during the scan.
Three types of spatial resolution exist in a typical ring PET system, defined by a full-width at half-maximum (FWHM): the radial, tangential, and axial resolutions. The radial, or in-slice, resolution deteriorates as we move from the center of the FOV and is best at the center. The same happens for the tangential resolution, which is measured along a line vertical to a radial line, at different radial distances. In systems with more than one detector
POSITRON EMISSION TOMOGRAPHY |
411 |
ring, the axial resolution, or slice thickness, is measured along the axis of the tomograph.
A major source of error during the coincidence detection is the fact that not all the annihilation events are registered correctly as mentioned earlier. Additional accidental coincidences can result from poor shielding or backscatter and from ordinary g rays from the radionuclide administered. The random and scattered coincidences are registered together with the true coincidences, obtained when a pair of gammas is correctly identified and classified to the appropriate detector tube, and are sources of background noise and image distortion.
In order to keep the number of scattered coincidences low, a discriminator should be used. A discriminator primarily generates timing pulses upon the arrival of a photon, but also can verify the total energy of the illuminating ray is above a preset energy threshold. Scattered rays have already deposited part of their energy and, therefore, can be identified.
Furthermore, the choice of the appropriate time coincidence (or coincidence resolving time) window is essential: It has to be narrow enough to keep the number of random coincidences as low as possible but also wide enough to include all valid coincidence pulses. In the existing PET units, the timing accuracy is of the order of tenths of nanoseconds.
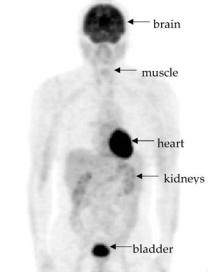
A PET scanner can be designed to image one single organ, such as the brain or the heart, or can be able to image any organ in the body, including whole-body scans. Whole-body studies with F-18-FDG consist of repeated PET acquisitions at contiguous bed positions in order to provide 3D images (axial, sagittal, coronal, and oblique cut planes) covering one considerable portion of the patient’s body (Fig. 3), which facilitates the search for metastases in oncological diagnostics (20).
Figure 3. A whole-body F-18-FDG PET image of a normal subject (no pathological situation diagnosed). Areas with high metabolic activity (brain, myocardium) or with high concentration of the radioactive tracer (bladder) are visible. [Courtesy of A. Maldonado and M.A. Pozo from the Centro PET Complutense, Madrid, Spain.]

412 POSITRON EMISSION TOMOGRAPHY
Figure 4. Sequential images from an F-18-FDG PET brain study of a normal individual. Redyellow areas correspond to the high metabolic activity in the gray matter (cortex). [Courtesy of A. Maldonado and M.A. Pozo from the Centro PET Complutense, Madrid, Spain.]
Most PET systems today are whole-body systems (i.e., they have a typical transaxial FOV of 60 cm). This FOV is adequate to handle most patients. The axial FOV of most PET systems today is limited to approximately 10–15 cm (21). This relatively narrow axial FOV imposes some limitation on the imaging procedures that can be performed clinically. It also requires more accurate positioning of the patient in comparison with conventional nuclear medicine procedures. For a clinical system, it would be desirable to extend the axial FOV to 15–20 cm, which would, for instance, allow full brain (Fig. 4) and heart imaging in a single frame and more efficient whole-body imaging. As the detectors contribute a significant portion of the total cost of the scanner, however, this would bring into question what would be an acceptable cost for the PET scanner.
MANUFACTURING OF RADIOPHARMACEUTICALS
A cyclotron is a particle accelerator that produces positronemitting elements or short-lived radioisotopes. These radioisotopes can then be incorporated into other chemical compounds that are synthesized into a final product that can be injected into a person. These radioisotopes are used to ‘‘label’’ compounds so it can later be identified where in the body the radiopharmaceutical is being distributed. The compounds that are being labeled are organic molecules
normally used in the body, such as sugar, neurotransmitters, and so on (22).
First, the cyclotron bombards nonradioactive elements in the target with accelerated particles, which converts these elements into positron-emitting radioactive isotopes of fluorine, nitrogen, oxygen, or carbon. The major radioactive isotope produced at almost all sites is fluorine-18 (F-18), which has a half-life of 110 min. F-18 thus produced from the cyclotron is delivered to a chemical synthesis unit called the chemical processing unit, which is where F-18 is incorporated into a precursor to produce the final product FDG, the labeled sugar molecule. This entire process is fully automated and performed in the cyclotron lab. When a dose is needed, it is transported to the PET scan room by various means, depending on the distance between the production site and the PET tomograph and ranging from a dedicated pneumatic tube system to long-distance transport via air or road.
APPLICATIONS OF PET
Molecular imaging opens the way for medical doctors to successfully pursue the origin of disease. As long as disease is of unknown origin, more tests and exams are needed, something that means increased health-care costs, in addition to the patient’s discomfort and pain. PET can
accurately identify the source of many of the most common cancers, heart diseases, and neurological diseases, eliminating the need for redundant tests, exploratory surgeries, and drug overload of the patient. PET produces powerful images of the body’s biological functions and reveals the mysteries of health and disease (23).
PET can be used to obtain information about the tissue perfusion using inert tracers (e.g., O-15 labeled water), the metabolism with metabolically active tracers (e.g., F-18-FDG), or the kinetic of a cytostatic drug (e.g., F-18-Fluorouracil).
In cardiology (22), this imaging technique represents the most accurate test to reveal coronary artery disease or rule out its presence. Traditionally, when a patient shows signs or symptoms of heart disease, his or her physician will prescribe a thallium stress test as the initial diagnostic study. The conventional thallium stress test, however, is often not as accurate as a PET scan. PET images can show inadequate blood flow to the heart during stress that can pass undetected by other noninvasive cardiac tests. A PET study could enable patients to avoid cardiac catheterization when a conventional perfusion or echocardiographic stress test is equivocal. A PET scan shows myocardial viability in addition to perfusion abnormality. More specifically, PET exams for metabolism and perfusion of the heart tissues can determine the need for heart transplant, in case both are absent in a large area of the heart, or confirm with certainty that simple bypass surgery would be enough, when metabolism is maintained even if blood flow is significantly reduced. As metabolism indicates that tissue is still alive, complicated heart transplantation can be avoided and coronary bypass would have great chances to improve cardiac function. Documented studies have shown that thallium stress testing overestimates irreversible myocardial damage in at least 30% of cases, which can result in the patient being placed on the transplant list rather than receiving bypass surgery or angioplasty. No other diagnostic test can more precisely assess myocardial viability than PET. The most recent developments in cardiac PET have been summarized in Reference 3.
PET can reveal abnormal patterns in the brain and is, therefore, a valuable tool for assessing patients with various forms of dementia (3,22). PET images of the brain can detect Parkinson’s disease: A labeled aminoacid (F-DOPA) is used as tracer at a PET examination in order to determine if the brain has a deficiency in dopamine synthesis. If it does not, Parkinson’s disease can be ruled out and possible tremors in the patient’s muscles will be treated in a different manner. Although the only definitive test for Alzheimer’s disease (AD) is autopsy, PET can supply important diagnostic information. When comparing a normal brain versus an AD-affected brain on a PET scan, a distinctive and very consistent image pattern appears in the area of the AD-affected brain, where certain brain regions have low metabolism at the early stages of the disease, allowing early detection several years before diagnosis can be confirmed by a physician. PET can also help to differentiate Alzheimer’s from other confounding types of dementia or depression (29). Conventionally, the confirmation of AD was a long process of elimination that averaged between two and three years of diagnostic and cognitive
POSITRON EMISSION TOMOGRAPHY |
413 |
testing. PET can help to shorten this process by identifying distinctive patterns earlier in the course of the disease. Furthermore, PET allows the accurate identification of epileptogenic brain tissue (because of its reduced glucose metabolic rates) and can successfully lead the surgical removal of the epileptic foci.
In oncology (3,22), in which the clear majority the total PET examinations refer, this technique inspects all organs and systems of the body to search for cancer in a single examination. PET is very accurate in distinguishing malignant tumors from benign growths. It can help detect recurrent brain tumors and tumors of the lung, breast, lymph nodes, skin, colon, and other organs. The information obtained from PET studies can be used to determine what combination of treatment is most likely to be successful in treating a patient’s tumor, as it can efficiently determine the resistance of a specific cancer to the drugs applied and, consequently, can dynamically optimize the treatment management and follow-up of the patient on an individual basis. With this technique, it is possible to evaluate if a tumor has been successfully destroyed after therapy, as anatomical follow-up imaging is often not in the position to assess if a residue is still active or has definitely been eliminated after chemotherapy, radiation, or surgery.
A summary of the current status and future aspects of PET for cancer detection, as it has been recently presented by the Health Technology Advisory Committee is as follows (23):
Brain Cancer: F-18-FDG PET in brain tumor imaging may be useful, but its clinical application has yet to be established. F-18-FDG PET does not appear to be able to define tumor histology. Additional studies are warranted regarding the value of F-18-FDG PET in detecting Central Nervous System (CNS) and nonCNS brain metastasis, differentiating malignant from nonmalignant lesions, detecting disease recurrence in subjects who have undergone intensive radiotherapy, and in pediatric brain tumors. As a result of the paucity of data on radiotracers other then F-18-FDG, further studies will be required to validate the use of PET brain scanning with these radiotracers.
Head and Neck Cancer: Studies suggest that F-18-FDG PET is superior to MRI but comparable with CT in identifying the presence, absence, or recurrence of cancer.
Pituitary Cancer, Thyroid Cancer, Urinary Cancer, Kidney Cancer: The paucity of data on the use of PET in pituitary tumors, thyroid tumors, urinary cancer, and kidney cancer prevents conclusions regarding its value at this time.
Lung Cancer: Numerous studies evaluating PET for lung cancer applications demonstrate that PET, using F- 18-FDG as a radiotracer, is effective and may be more effective than other noninvasive techniques, particularly CT, in differentiating benign and malignant pulmonary lesions. Thus, F-18-FDG PET appears to be an effective means of diagnosing lung cancer, whether a primary disease or a secondary metastatic disease, and detecting disease recurrence following lung cancer therapy.
Breast Cancer: Preliminary data suggest that F-18-FDG PET can differentiate benign from malignant breast lesions, when used in breast cancer staging, and can
414 POSITRON EMISSION TOMOGRAPHY
determine the presence of axillary node involvement. Although data are scarce regarding the use of PET in monitoring the effects of breast cancer therapy, available data suggest that both F-18-FDG PET and C-11-MET PET may be useful for breast cancer and may show response earlier than conventional methods. Regardless, due to the small study samples and limited amount of available data, further studies will be required to confirm the efficacy of PET for breast cancer imaging.
Esophageal Cancer: F-18-FDG PET may be valuable in the staging of esophageal cancer. Evidence is limited by the small number of subjects in each study and the lack of additional trials.
Pancreatic Cancer: Studies indicate that PET may have a role in the imaging of pancreatic tumors, but further study is needed to verify this indication.
Renal Cancer: F-18-FDG PET shows promise for evaluating renal masses, but confirmation is required.
Ovarian Cancer: Preliminary data suggest a potential role for F-18-FDG PET in ovarian cancer; however, further studies are required to confirm these findings.
Prostate Cancer: Although F-18-FDG PET has been used in certain prostate cancer cases, it is possible that the use of radiotracers other than F-18-FDG may be of more value. However, insufficient data exists at this time to draw conclusions regarding the use of PET in prostate cancer.
Testicular Cancer: With limited data, no conclusions can be made at this time.
Malignant Melanoma: Additional studies are needed to determine the role of PET in the imaging of malignant melanoma.
Colorectal Cancer: F-18-FDG PET may be a valuable tool for colorectal cancer in diagnosis, preoperative staging, and monitoring for recurrent disease or treatment response. However, further study is required to confirm these findings.
Neuroendocrine Gastrointestinal Cancer: PET proved superior to CT in detecting, delineating, and visualizing lesions. The study claimed that PET had a superior role, but further study is required to confirm this finding.
Malignant Lymphoma: Studies comparing F-18-FDG PET with alternative techniques found PET to be more accurate than CT, 99mTc-MIBI SPET, and 111In-soma- tostatin scintigraphy in detecting untreated and treated lymphoma. Supportive evidence is limited to a few trials that are hampered by small study samples. No conclusions can be drawn at this time regarding the efficacy of PET for malignant lymphoma.
A major use of PET is its ability for kinetic imaging analyses. This term refers to the measurement of tracer uptake over time. An image of tracer activity distribution is a good starting point for obtaining more useful information such as regional blood flow or regional glucose metabolism. The process of taking PET images of radioactivity distribution and then using tracer kinetic modeling to extract useful information is termed image analysis. The tracer kinetic method with radiolabeled compounds is a primary and fundamental principle underlying PET and autoradiography. It has also been essential to the investigation of basic chemical and functional processes in biochemistry,
biology, physiology, anatomy, molecular biology, and pharmacology. Tracer kinetic methods also form the basis in in vivo imaging studies in nuclear medicine (24).
Besides its direct clinical applications, PET imaging is emerging as a powerful tool for use by the pharmaceutical industry in drug discovery and development (25). The role of small animal PET imaging (26) studies in rodents for the discovery of PET tracers for human use is significant, as it has the potential for permitting higher throughput screening of novel tracers in transgenic mice as well as the confounding effects resulting from potential species differences on receptor affinity, blood-brain barrier (BBB) transport, metabolism, and clearance. This setting is expected to allow new and unique experimental laboratory studies to be performed.
Other recent developments include dedicated mammography devices (known as positron emission mammographs, PEM) for breast functional imaging (27). Furthermore, the first PET/CT tomographs have made their way to the market (28). These are devices that house a positron tomograph and a CT scanner in a single device, allowing the acquisition and visualization of registered images detailing both anatomy and biological processes at the molecular level of internal organs and tissue, without the need of multiple examinations and further image processing to achieve similar results.
IMAGE INTERPRETATION
One of the final steps in the processing chain of the PET study is to produce a final layout of the images for the diagnosing physician. The conventional way of presenting the image data is to produce a transparency film (X-ray film) of the images on the computer display. In addition to the image data, the film should also be labeled with demographic data about the study, such as patient name and scan type. As this information is usually stored in the image files together with the image data, the labeling and layout of the images on the display can be automated in software. With the rapid development of local area networks, films may soon no longer be necessary. Instead, the images can be read from a display system located in the reading room, which has access to the PET image data through a computer network. Referring physicians do, in most cases, require a hard copy of the study, which can be accomplished using X ray films. With recent improvements in printer technology, high quality color output may also be a low cost alternative to the traditional film.
PROCEDURE FOR A PET SCAN
Most patients will be in the PET center for 2 or 3 h, depending on the type of study being conducted. The patient is informed as to when to stop eating before the test. Drinking lots of water is recommended before the scan. The patients also need to inform the PET center if they are diabetic or claustrophobic. In general, before the scan is performed, a catheter is placed in the arm so that the radioactive tracer can be injected. A glucose test will also be performed. Depending on the type of study conducted,
POSITRON EMISSION TOMOGRAPHY |
415 |
scanning may take place before and after the injection is given. After the tracer is given, the patient waits for approximately 40–60 min before the final scan is done.
PET SCAN AND ASSOCIATED RISKS
The radiation exposure of PET is similar to that of having a CT scan or any other standard nuclear medicine procedure involving heart or lung scans. No pain or discomfort results from the scan. The half-life of F-18 is so short that by the time the patient leaves the PET center, almost no activity remains in the body. Patients typically do not experience any reactions as a result of the PET scan, because the tracer material is processed by the body naturally. Therefore, no side effects are expected. Of course, as with any other nuclear medicine procedure, when breast-feeding or pregnant, a PET scan must be performed under special conditions.
CURRENT STATUS AND FUTURE ASPECTS IN PET INSTRUMENTATION
Technological developments and research in the field of PET instrumentation are currently marking a fast evolution (30). New PET systems have been designed and developed with whole-body scanning capabilities. These systems are clearly designed for oncological studies (currently almost entirely performed in the clinical practice with the use of F-18-FDG), which represent maybe more than 80% of the total PET examinations performed worldwide. Therefore, a clear shift has occurred from the earliest systems, which were then mostly oriented to neurological applications.
The main requirement, which drive current R&D activities both in academia and in industry, is to increase the diagnostic accuracy (lesion detectability) of the technique and, at the same time, decrease the cost of a PET system installation, operation, and maintenance, which would allow the widespread use of PET in the clinical practice. In order to achieve this goal, an optimal balance should be found between high performance specifications and cost efficiency for the newly designed tomographs.
In particular, very high resolution 3D PET imaging (with applications in brain imaging, positron emission mammography, as well as small animal imaging) has demanded further advances in scintillation detector development, image reconstruction, and data correction methodology.
Table 4 lists the major performance characteristics of some last-generation tomographs for human whole-body
studies, based on different design architectures and operating in 3D acquisition mode. For 2D acquisitions, lead or tungsten septa are placed between the detectors to absorb scattered radiation (out of slice activity). The septa reduce the amount of scatter to 10–15% of the total counts acquired and improve image contrast. For 3D acquisitions, the septa are removed and each individual detector is sensitive to radiation from a much larger area (30). This mode allows a significant increase of the detection efficiency of the order of a factor 5–6 over the 2D mode and therefore, provides an increase of the SNR in the produced images, an aspect of extreme importance in whole-body studies. 3D PET imaging can, in addition, significantly reduce the amount of tracer activity needed for the exam and shorten the acquisition time, thus reducing the time during which the patient must remain immobile on the tomograph’s bed.
A limitation of the 3D mode, however, is an increase of the scatter component (almost one out of every two of the detected events has been scattered in the source or even inside the scintillation detectors) as well as of the number of the detected accidental coincidences (randoms) (30). A good energy resolution is therefore imperative in 3D PET systems, in order to reduce the scatter component (by correctly identifying detected g rays with deposited energy lower than 511 keV). Furthermore, these systems must be able to manage high count rates in order to match the radioactivity present in the FOV. High temporal resolution in PET (high count rate) also permits dynamic imaging (repeated studies at short time intervals). With high count rates, pulses receiving a detector block can ‘‘pile-up’’ and the detector may become paralyzed, which decreases the sensitivity and detection efficiency of the tomograph. In addition, when scanning in a high counting rate environment, the random counting rate increases much more rapidly than does the true counting rate as a function of radioactivity in and near the FOV. In general, in 3D mode, an increased number of random events is detected, which degrades the image quality. Appropriatescatter and randoms corrections must therefore be applied to 3D-acquired data (31). Considering the nature of the scatter correction process and the heterogeneity of the activity distribution in the thoracic and abdominal areas (which are of particular interest for whole-body F-18-FDG PET studies), the use of scatter correction techniques is not yet consolidated and their effectiveness regarding the quality and quantitative accuracy of whole-body PET studies demands more research work.
The performance of a 3D-enabled PET tomograph is, therefore, the result of a compromise between the various physical parameters considered (spatial resolution,
Table 4. Performance Characteristics of PET Scanners in 3D Mode (15)
|
Philips C-PET |
GE Advance |
ECAT HRþ |
ECAT Accel |
Philips Allegro |
Crystal |
NaI |
BGO |
BGO |
LSO |
GSO |
Crystal dimensions (mm) |
500 300 25 |
4.0 8.2 30 |
4.0 4.4 30 |
6.8 6.8 20 |
4.0 6.0 20 |
Spatial resolution FWHM, mm (10 cm) |
6.4 |
5.4 |
5.4 |
6.7 |
5.9 |
Efficiency (kpcs/Ci/cc) |
450 |
1060 |
900 |
900 |
> 800 |
% Scatter fraction |
25 |
35 |
36 |
36 |
25 |
50% Dead time (kcps/Ci) |
0.2 |
0.9 |
0.6 |
- |
0.6 |
|
|
|
|
|
|
416 POSITRON EMISSION TOMOGRAPHY
detection efficiency, energy resolution, and linearity of count rate). In the modern design of such systems, the primary objective evolves from the optimization of the spatial resolution and the efficiency (typical of tomographs for cerebral applications) to the optimization of the balance between energy resolution and count rate performance. The size of the scintillation detector crystals, which together with the photomultiplier tubes constitute the main elements in the design of a PET system, determines the intrinsic spatial resolution of the tomograph. The volume of each crystal has a minimum, defined by the current technological limitations, but, at the same time, should be large enough to include a sufficient mass of material so that a significant number of the incident high energy g rays are absorbed and converted to visible (detectable) light. A very small detector crystal could result transparent to g rays, which would decrease the system’s sensitivity.
Spatial resolution, an area of interest in the design of PET systems, refers to the development and implementation of techniques for the correction of the effect of ‘‘depth of interaction’’ (DOI) parallax error, which limits the uniformity of the spatial resolution in the FOV for PET tomographs with rings of detector block arrays (18). In such systems, the length of the detector crystals is about ten times as long as their width in order to improve detection efficiency. Therefore, PET measurements exhibit shiftvariant characteristics, such as broadened sensitivity functions of each detector pair from center to edge of FOV and for oblique lines of response. Spatial uniformity can be restored if the DOI of the incident photons is known. A number of techniques for deriving DOI information from PET detectors have been proposed, including the use of a phoswich technique (32) (detector arrangements, composed from scintillation crystal layers; e.g., LSO/GSO phoswich block detector, where the distinct temporal characteristics of the crystals used allow to identify the DOI), extracting the DOI information by controlling the light-sharing between two crystals, coupling of two ends of the detection crystals to separate photodetectors, and extracting DOI information from a 3D matrix detector (33). Other approaches include the application of a lightabsorbing band around each crystal, the introduction of a light-absorbing material between sections of the detector or use of a Multipixel Hybrid Photomultiplier (M-HPD) (34). When fully available in commercial tomographs, the implementation of correction techniques for DOI will allow the improvement of the spatial resolution and an ultimate optimization in the design of scintillation detection systems.
In order to draw a full advantage from the increase of the detection efficiency offered by 3D PET, developments in the field of the image formation are equally necessary. The acquired PET data are not an image of the activity distribution in the source but rather projections of it. The unknown image must be estimated from the available data computationally. Great interest is turned nowadays to completely 3D iterative image-reconstruction techniques (21). The more interesting feature of iterative techniques consists of the possibility to incorporate to the reconstruction process the statistical model of the process of acquisition and detection. In spite of their high computational cost, iterative techniques offer greater flexibility in the
data processing, particularly of data with elevated statistical noise. The implementation of these reconstruction algorithms on clusters of workstations, grid platforms, or other high performance computing systems is an area of state-of-the-art research (35).
In spite of the fact that the clinical impact of the attenuation correction for whole-body F-18-FDG PET studies is still under discussion and study, iterative imagereconstruction techniques combined with correction for measured attenuation seem to offer various advantages:
-anatomical localization and spatial definition of lesions are improved,
-the geometric distortions observed can be compensated and corrected (requirement for being able to proceed to the co-recording with anatomical images – CT, MRI, and so on),
-the tracer update can be quantified.
An issue of greater technological interest for its major impact on oncological diagnosis is the development of integrated multimodality systems PET/CT (36). A PET/ CT system consists of a PET tomograph and a CT tomograph, both of the last generation, assembled in a single gantry, controlled from a single workstation, with one unique patient bed. A PET/CT system allows the acquisition of PET and CT images in a unique examination with significant advantages:
-reduction of the examination time,
-integrated diagnosis by means of combined use of information from PET and CT,
-accurate interpretation of the PET functional images based on anatomical CT images (functional-anatomic correlation),
-improvement of the PET functional image quality using the anatomical information from CT (reconstruction with iterative techniques of the PET data with the use of the anatomical CT information as a priori information, for attenuation correction, and for accurate scatter correction, and for the correction of the partial volume effect),
-elimination of the radionuclide source for transmission scanning and elimination of the need for periodic replacement of decayed transmission sources.
The development of commercial PET/CT systems is quite recent, and the number of such systems installed and operational is still limited. Beyond the evaluation of the clinical effectiveness of such systems, various technical aspects still demand additional studies based on the clinical experience. The techniques of patient positioning must be optimized (arm position, etc.). The correction for attenuation based on CT studies must be validated (calibration of the attenuation-correction coefficients based on CT to the 511 keV energy window). The alignment of CT and PET studies must be verified, in particular regarding the acquisition protocols (conditions of apnea in CT studies and free respiration in PET studies). Furthermore, the
performance of these complex and expensive systems should be compared with the performance of currently available software-based solutions for the co-registration and fusion of multimodality images (PET with CT, but also PET with MRI, ultrasound, etc.), which are shown to produce very accurate results, at least for brain studies.
Apart from whole-body human examinations, a challenging area of state-of-the-art research at the limits of current PET technology is the development of dedicated tomographs for small animal studies (25). In such systems, spatial resolution plays a crucial role as they are applied in the investigation of new pharmaceuticals and the development of new PET probes, as well as in the field of modern molecular biology, a scientific area that is currently focusing its interest toward imaging of laboratory mice and rats. As both the resolution and the sensitivity of small animal PET scanners are still limited by detector technology, image reconstruction algorithms, and scanner geometry, significant improvements may be expected in the performance of small animal PET scanners, whether prototype or commercial systems. In addition, multimodality imaging systems that will provide biological and anatomical information in an integrated setting, according to the model of PET/CT (or even PET/MR, etc.) systems already commercially available for human studies, should soon become available. The role of small animal PET in modern biology and pharmaceutical discovery and evaluation is in the process of being established, and it is likely that in vivo information of great value will be obtained. In addition, it is probable that the demanding requirements that small animal studies place on PET will result in technical advances and new technologies, which will dramatically improve the spatial resolution and image quality of clinical PET scanners for humans.
People today expect quality medical care at a reasonable cost, with accurate diagnosis and treatment, without having to undergo multiple exams and painful surgical exploration, and with fast and reliable results. Molecular imaging techniques, such as PET, display the biological basis of function in the organ systems of the human body unobtainable through any other means (37). PET is changing the way doctors manage care of their patients for some of today’s most devastating medical conditions.
BIBLIOGRAPHY
1.Nutt R. The history of positron emission tomography. Mol Imag Biol 2002;4(1):11–26.
2.Brownell GL. A history of positron imaging. Online. 1999. Available at http://www.mit.edu/ glb/.
3.Phelps ME. PET Molecular Imaging and Its Biological Applications. New York: Springer; 2004.
4.Gambhir SS, Czernin J, Schwimmer J, Silverman DHS, Coleman E, Phelps ME. A tabulated summary of the FDG PET literature. J Nucl Med 2001;42:1S–93S. Online. Available at http://www.petscaninfo.com/zportal/portals/phys/clinical/ jnmpetlit.
5.Sorenson JA, Phelps ME. Physics in Nuclear Medicine, 2nd ed. Orlando, FL: Grune and Stratton Inc.; 1987.
6.Zaidi H, Hasegawa B. Determination of the attenuation map in emission tomography. J Nucl Med 2003;44(2):291–315.
POSITRON EMISSION TOMOGRAPHY |
417 |
7.Turkington TG. Introduction to PET instrumentation. J Nucl Med Tech 2001;29(1):4–11.
8.Melcher CL, Schweitzer JS. Cerium-doped lutetium oxyorthosilicate: A fast, efficient new scintillator. IEEE Trans Nucl Sci 1992;39:502–505.
9.Ishibashi H, Kurashige K, Kurata Y, Susa K, Kobayashi M, Tanaka M, Hara K, Ishii M. Scintillation performance of large Ce-doped Gd2SiO5 (GSO) single crystal. IEEE Trans Nucl Sci 1998;45(3):518–521.
10.Moses WW, Derenzo SE. Lead carbonate, a new fast, heavy scintillator. IEEE Trans Nucl Sci 1990;37(1):96–100.
11.Moses WW, Derenzo SE, Shlichta PJ. Scintillation properties of lead sulfate. IEEE Trans Nucl Sci 1992;39(5):1190–1194.
12.Moses WW, Derenzo SE. Cerium fluoride, a new fast, heavy scintillator. IEEE Trans Nucl Sci 1989;36(1):173–176.
13.Ziegler SI, Rogers JG, Selivanov V, Sinitzin I. Characteristics of the new YAlO3:Ce compared with BGO and GSO. IEEE Trans Nucl Sci 1993;40(2):194–197.
14.Moses WW, Derenzo SE, Fyodorov A, Korzhik M, Gektin A,
Minkov B, Aslanov V. LuAlO3:Ce-a high density, high speed scintillator for gamma detection. IEEE Trans Nucl Sci 1995; 42(4):275–279.
15.Gilardi MC. Tomografi PET: Attualita´ e prospettive (in italian). XI Nat. Course on Professional Continuing Education in Nuclear Medicine (Pisa, 29-31/10/2001) Online. Available at http://www.aimn.it/ecm/pisa_01/Gilardi.pdf.
16.Casey ME, Nutt R. A multislice two dimensional BGO detector system for PET. IEEE Trans Nucl Sci 1986;33:460–463.
17.Karp JS, Muehllehner G, Mankoff DA, Ordonez CE, Ollinger JM, Daube-Witherspoon ME, Haigh AT, Beerbohm DJ. Continuous-slice PENN-PET: A positron tomograph with volume imaging capability. J Nucl Med 1990;31:617–627.
18.Surti S, Karp JS, Freifelder R, Liu F. Optimizing the performance of a PET detector using discrete GSO crystals on a continuous lightguide. IEEE Trans Nucl Sci 2000;47:1030– 1036.
19.Jeavons A, Parkman C, Donath A, Frey P, Herlin G, Hood K, Magnanini R, Townsend D. The high-density avalanche chamber for Positron Emission Tomography. IEEE Trans Nucl Sci 1983;30:640–645.
20.Phelps ME, Cherry SR . The changing design of positron imaging systems. Clin Positron Imag 1998;1(1):31–45.
21.Tarantola G, Zito F, Gerundini P. PET instrumentation and reconstruction algorithms in whole-body applications. J Nucl Med 2003;44(5):756–768.
22.Let’s Play PET. 1995, May 1. Online. Available at http://laxmi. nuc.ucla.edu:8000/lpp/lpphome.html.
23.Health Technology Advisory Committee. 1999, March. Positron emission tomography (PET) for oncologic applications. Online. Available at http://www.health.state.mn.us/htac/pet. htm.
24.Phelps ME. Positron emission tomography provides molecular imaging of biological processes. Proc Nat Acad Sci 2000;97(16): 9226–9233.
25.Fowler JS, Volkow ND, Wang G, Ding Y-S, Dewey SL. PET and drug research and development. J Nucl Med 1999;40: 1154–1163.
26.Chatziioannou AF. Molecular imaging in small animals with dedicated PET tomographs. Eur J Nucl Med 2002; 29(1):98–114.
27.Kontaxakis G, Dimitrakopoulou-Strauss A. New approaches for position emission tomography (PET) in breast carcinoma. In: Limouris GS, Shukla SK, Biersack H-J, eds. Radionuclides for Mammary Gland–Current Status and Future Aspects. Athens, Greece: Mediterra Publishers; 1997. p 21–36.
28.Beyer T, Townsend DW, Brun T, Kinahan PE, Charron M, Roddy R, Jerin J, Young J, Byars L, Nutt R. A combined