

- •VOLUME 5
- •CONTRIBUTOR LIST
- •PREFACE
- •LIST OF ARTICLES
- •ABBREVIATIONS AND ACRONYMS
- •CONVERSION FACTORS AND UNIT SYMBOLS
- •NANOPARTICLES
- •NEONATAL MONITORING
- •NERVE CONDUCTION STUDIES.
- •NEUROLOGICAL MONITORS
- •NEUROMUSCULAR STIMULATION.
- •NEUTRON ACTIVATION ANALYSIS
- •NEUTRON BEAM THERAPY
- •NEUROSTIMULATION.
- •NONIONIZING RADIATION, BIOLOGICAL EFFECTS OF
- •NUCLEAR MAGNETIC RESONANCE SPECTROSCOPY
- •NUCLEAR MEDICINE INSTRUMENTATION
- •NUCLEAR MEDICINE, COMPUTERS IN
- •NUTRITION, PARENTERAL
- •NYSTAGMOGRAPHY.
- •OCULAR FUNDUS REFLECTOMETRY
- •OCULAR MOTILITY RECORDING AND NYSTAGMUS
- •OCULOGRAPHY.
- •OFFICE AUTOMATION SYSTEMS
- •OPTICAL FIBERS IN MEDICINE.
- •OPTICAL SENSORS
- •OPTICAL TWEEZERS
- •ORAL CONTRACEPTIVES.
- •ORTHOPEDIC DEVICES MATERIALS AND DESIGN OF
- •ORTHOPEDICS PROSTHESIS FIXATION FOR
- •ORTHOTICS.
- •OSTEOPOROSIS.
- •OVULATION, DETECTION OF.
- •OXYGEN ANALYZERS
- •OXYGEN SENSORS
- •OXYGEN TOXICITY.
- •PACEMAKERS
- •PAIN SYNDROMES.
- •PANCREAS, ARTIFICIAL
- •PARENTERAL NUTRITION.
- •PERINATAL MONITORING.
- •PERIPHERAL VASCULAR NONINVASIVE MEASUREMENTS
- •PET SCAN.
- •PHANTOM MATERIALS IN RADIOLOGY
- •PHARMACOKINETICS AND PHARMACODYNAMICS
- •PHONOCARDIOGRAPHY
- •PHOTOTHERAPY.
- •PHOTOGRAPHY, MEDICAL
- •PHYSIOLOGICAL SYSTEMS MODELING
- •PICTURE ARCHIVING AND COMMUNICATION SYSTEMS
- •PIEZOELECTRIC SENSORS
- •PLETHYSMOGRAPHY.
- •PNEUMATIC ANTISHOCK GARMENT.
- •PNEUMOTACHOMETERS
- •POLYMERASE CHAIN REACTION
- •POLYMERIC MATERIALS
- •POLYMERS.
- •PRODUCT LIABILITY.
- •PROSTHESES, VISUAL.
- •PROSTHESIS FIXATION, ORTHOPEDIC.
- •POROUS MATERIALS FOR BIOLOGICAL APPLICATIONS
- •POSITRON EMISSION TOMOGRAPHY
- •PROSTATE SEED IMPLANTS
- •PTCA.
- •PULMONARY MECHANICS.
- •PULMONARY PHYSIOLOGY
- •PUMPS, INFUSION.
- •QUALITY CONTROL, X-RAY.
- •QUALITY-OF-LIFE MEASURES, CLINICAL SIGNIFICANCE OF
- •RADIATION DETECTORS.
- •RADIATION DOSIMETRY FOR ONCOLOGY
- •RADIATION DOSIMETRY, THREE-DIMENSIONAL
- •RADIATION, EFFECTS OF.
- •RADIATION PROTECTION INSTRUMENTATION
- •RADIATION THERAPY, INTENSITY MODULATED
- •RADIATION THERAPY SIMULATOR
- •RADIATION THERAPY TREATMENT PLANNING, MONTE CARLO CALCULATIONS IN
- •RADIATION THERAPY, QUALITY ASSURANCE IN
- •RADIATION, ULTRAVIOLET.
- •RADIOACTIVE DECAY.
- •RADIOACTIVE SEED IMPLANTATION.
- •RADIOIMMUNODETECTION.
- •RADIOISOTOPE IMAGING EQUIPMENT.
- •RADIOLOGY INFORMATION SYSTEMS
- •RADIOLOGY, PHANTOM MATERIALS.
- •RADIOMETRY.
- •RADIONUCLIDE PRODUCTION AND RADIOACTIVE DECAY
- •RADIOPHARMACEUTICAL DOSIMETRY
- •RADIOSURGERY, STEREOTACTIC
- •RADIOTHERAPY ACCESSORIES
PHOTOTHERAPY. See ULTRAVIOLET RADIATION IN
MEDICINE.
PHOTOGRAPHY, MEDICAL
JACKIE K. CHAN
EDWARD K. FUNG
Columbia University
New York
INTRODUCTION
Photography is widely used in many areas of medicine for the documentation and treatment of diseases. Photography involves making pictures by capturing light reflected from objects onto a sensitive medium (e.g., film or the more recent technique of light-sensitive chips from a digital camera). In ophthalmology, the transparency of the living eye allows photographs to image diseases as far back as the retina. In dermatology, traditional methods of photography are used to document and track skin lesions. Every type of medical imaging comes with its own technical challenges. The medical photographer plays a vital part in promoting and supporting quality healthcare by providing services in photography. Furthermore, imaging has served as an important research tool. Photomicrography involves taking images in the laboratory of tissue or culture specimens in both the gross and cell level. The goals of photography, in general, may include characterizing the basic anatomy and physiology of the body, understanding changes caused by aging or disease, and discovering disease mechanisms.
OPHTHALMIC PHOTOGRAPHY
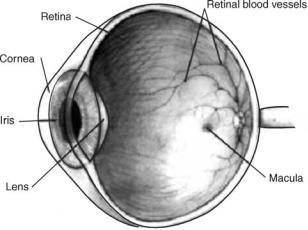
Photographing the living eye poses some challenging issues despite its transparency. The eye is sensitive to light and can easily be bleached after a certain number of flashes and intensity. The human retina is also designed for capturing light rather than reflecting it. Images may result in poor contrast and may affect the performance of diagnostic procedures. The main absorbing pigments in the eye are blood, hemoglobin, photo pigments, macular pigments, and water. Moreover, research has shown that many sight-threatening diseases are embedded deep in the retina, where conventional tools of photography cannot be used (1,2). Fortunately, specialized instruments and image enhancement processes have been developed to obtain better images (Fig. 1).
The Fundus Camera
The instrument widely used by ophthalmologists to view the posterior segment of the eye is the fundus camera. The fundus is photographed using a white light source to provide high resolution images at the micron range. Fundus photography can also create stereographics images that provide depth. These qualities make fundus photography the established standard for clinical studies of
PHOTOGRAPHY, MEDICAL |
291 |
macular diseases. Newer models now take digital images and can be directly stored to a computer database.
Many fundus camera models are currently available in the United States: the German Zeiss, the Topcon fundus camera, the Olympus fundus camera, and the Nikon fundus camera. In choosing an instrument, one should compare the engineering and more importantly, the photo quality. Some instruments will be more expensive than its competitors, but takes excellent photographs while others have a wider view and good quality images (3) (Fig. 2).
General Methodology
A full-time photographer is specialized to operate the equipment in a clinic. While gaining technical skills, the photographer is often familiar with the clinical pathology of the fundus. This is advantageous to the ophthalmologist in situations where photos need to be interpreted. In operating a fundus camera, there are some general guidelines to follow (3):
1.The pupil of the patient must be dilated. Dilation of the pupil may take 20–30 min. An 8 mm diameter pupil is ideal, but even a pupil much smaller may be acceptable.
2.The eyepiece must be carefully focused to avoid getting out-of-focus photographs. Young children will have accommodation problems and may pose extra attention. The settings should be checked before each set of photographs on the patient is taken.
3.Check the shutter speed for the proper electronic flash synchronization. Shutter speeds in the range of 1/30 to 1/60 of a second can be used.
4.Take an identification photograph of the patient’s name, date photographed, and other pertinent information. Properly labeling photos will avoid confusion later.
Figure 1. Cross-section of the eye. The transparency of the eye permits the ability to receive light from the external world. Light enters the cornea and goes through the iris and the lens until it reaches the retina. The macula contains many rods and cones and is the area of greatest visual acuity.
292 PHOTOGRAPHY, MEDICAL
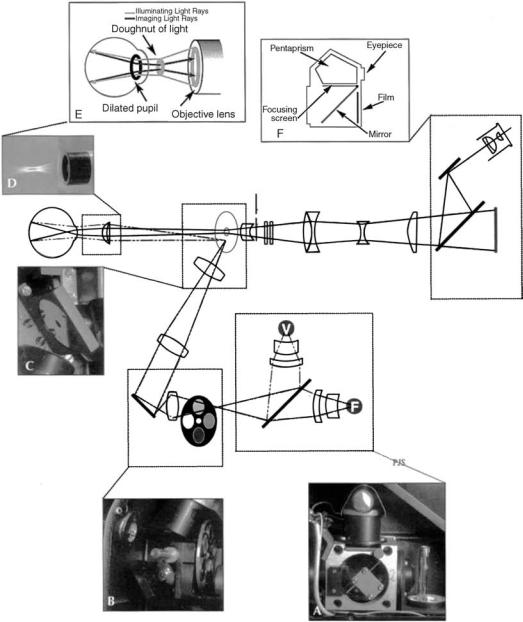
Figure 2. The optical pathway of the fundus camera. Light generated from either the viewing lamp
(V) or the electronic flash (F) (A) is projected through a set of filters and onto a round mirror (B). This mirror reflects the light up into a series of lenses that focus the light. A mask on the uppermost lens shapes the light into a doughnut. The doughnut shaped light is reflected onto a round mirror with a central aperture (C), exits the camera through the objective lens, and proceeds into the eye through the cornea. When the illuminating light is seen from the side, one can appreciate the complexity and precision of the optical scheme (D). Assuming that both the illumination system and the image are properly aligned and focused, the retinal image exits the cornea through the central, unilluminated portion of the doughnut (E). The light continues through the central aperture of the previously described mirror, through the astigmatic correction device and the diopter compensation lenses, and then back to the single lens reflex camera system. (From Saine PJ, Taylor ME, Ophthalmic Photography (2nd ed.), Butterworth-Heinemann, 2002 with permission.)
5.When the patient is comfortably seated at the instrument with their chin on the chin rest and their forehead against the headrest, instruct the patient to look at the fixation device.
6.After properly focusing the filament of the viewing lamp, look through the eyepiece and bring the retinal vessels into focus. Release the shutter.
Stereo Fundus Photos
Fundus photos in stereo pair give a perception of depth that greatly improves reading performance. For example, a stereo photo can document blurred disk margins, optic nervehead cupping, and the degree of retinal elevation from conditions (e.g., serous or solid detachments). When evaluating patients with age-related macular degeneration (AMD), graders can view the elevation of drusen under the retina much more effectively.
The most popular method of taking stereo photographs was the cornea-induced parallax method, advocated by Bedell (4). To take the stereo pair, the first photograph is taken through the temporal side of the pupil and the second through the nasal side. A lateral shift of 3.5 mm is recommended for optimum stereopsis, but any lateral shift will create a stereo photograph. The photographer aligns and focuses the camera through the center of the pupil, then uses the joystick to move the camera slightly to the right, takes an image, and then slightly to the left, and takes the second image. The translation of the camera sideways changes the angle of view. The amount of camera shift can vary from image pair to image pair, making apparent depth a variable. Attachments are available for some cameras that allow the photographer to shift the camera through a consistent distance. Specialized cameras are commercially available to take stereo-pair fundus photos simultaneously, though the resolution is reduced.
Digital Imaging
Until recently, fundus photos were developed in film and the photographer had to wait hours or even days to see the results. The resolution was limited by the grain size of the film. Today, fundus cameras take digital photos that can be evaluated instantaneously and stored digitally. A typical image is in 24-bit, red, green, and blue (RGB), true color with a resolution size of 2000 2000 pixels. A digital imaging system ensures that the original quality of the image is preserved and will produce flawless duplication.
Images can be stored in a number of different formats, but with digital files comes the requirement for an efficient digital storage system. Tagged image file format (TIFF) images are not compressed, and therefore require large storage spaces. Recent advances in computer engineering have provided large storage in affordable costs. Nevertheless, it has been shown by Lee (5) that joint photographic experts group (JPEG) formats allow for varying degrees of image compression without compromising the resolution of fundus photos necessary for image analysis. In image compression, images are applied to a lossy algorithm, which permit the image to be reconstructed based on partial data. The result is not an exact restoration of the image, but is sufficient for diagnostic purposes.
In the evaluation of clinical AMD, Lee reported that TIFF images and low compression (30:1) JPEG images were virtually indistinguishable (5). Digital images of AMD patients were analyzed in software for drusen identification and quantification. Drusen detection in the conventional stereo fundus slides using a manual protocol was highly comparable to the digital format (Figure 3).
PHOTOGRAPHY, MEDICAL |
293 |
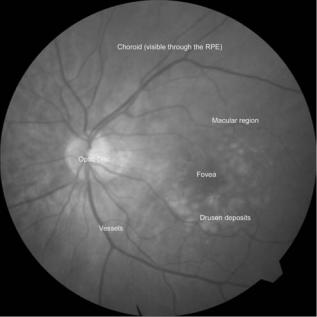
Figure 3. Fundus image of an AMD patient. The fundus camera is used to photograph the retina. The macula corresponds to an area of the retina 5–6 mm in diameter, centered on the fovea. Drusen are the white deposits surrounding the fovea that are characteristic of AMD, a sight-threatening disease. The retina has many layers, including the retinal pigment epithelium (RPE) and the choroid. Drusen are usually found embedded below the RPE layer.
Clinical Evaluation of AMD in Fundus Photos
The fundus camera has been routinely employed for diagnostic purposes (e.g., the clinical study of patients with AMD) (6,7), which is the leading cause of blindness in the developed world (8). The natural history of AMD is hallmarked by a subretinal pathology known as drusen (9– 17). The identification and measurement of drusen are central to clinical studies of early AMD. The current standard of grading AMD is through manual viewing of stereographic fundus slides on a light box. However, this method involves time-consuming analysis of drusen size, number, area, and morphology in several subcategories (18).
Despite the movement to digital fundus imaging, a digital and automated method of quantification of macular pathology in AMD has yet to gain widespread use. Computer-assisted image analysis offers the potential for greater accuracy, objectivity, and reproducibility, but designing algorithms for that purpose is nontrivial. Many methods have been attempted in the last two decades with unsatisfactory results (19–25).
One major obstacle stems from the clinical appearance of the normal macula, which is a composite of complex light reflections from and absorption by multiple layers of the retina and associated structures. The application of segmenting any pathology superimposed on the macula in an automated fashion is a difficult task by the nonuniform reflectance of the normal macular background. For example, absorption by luteal pigment in the central macula
294 PHOTOGRAPHY, MEDICAL
(fovea and parafovea) contributes to the darker central appearance. The nerve fiber layer, conversely, is highly reflectant. It is thickest in the arcuate bundles along the arcades and thinnest at the central fovea. This makes the arcade regions relatively brighter, hence also contributes to the macula appearing darker centrally (26). Therefore, simply choosing a global threshold would not be equally effective in segmenting or identifying drusen in the darker central regions as it would in the relatively brighter regions in the periphery, and vice versa.
Shin et al. (19) used adaptive thresholding techniques to handle the nonuniform macular background reflectance. They divided the image into separate windows of variable sizes. Within each window, a local histogram was applied to check for skewness, and to determine if drusen was present. However, the method was often misleading if either a large area of background or a large drusen dominated the region, which resulted in an incorrect threshold. Moreover, windows containing vessels would sometimes be incorrectly interpreted in the bimodal distribution. Thus, operator supervision and some postprocessing steps were added.
Shin’s method was improved by Rapantzikos et al. (20), which used morphological operators (e.g., kurtosis and skewness) to predict whether drusen was present in the local window. Their idea gave better results, but was not infallible as a completely automated system of drusen segmentation. For example, many different combinations of image features (drusen and background) can yield the same histogram.
An alternative method was presented by Smith et al. (27,28) that aims to level the macular background reflectance, which can change significantly over distances of 50–100 mm. In previous methods, inadequate segmentation centrally and overinclusive segmentation in the peripheral macula was an indication that the background variability of the macula had not been resolved.
Smith found that the background reflectance of a normal fundus image could be modeled geometrically (29–31). It has been shown that a partial normal background containing drusen provided enough information to model the entire background by a elliptical contour graph (27,32). After leveling the nonhomogeneity of the background reflectance, they overcame the challenges posed in purely histogram-based methods of other researchers. A combined automated histogram technique and the analytic model for macular background presented a completely automatic method of drusen measurement.
Their algorithm is briefly explained. First, an initial correction of the large-scale variation in brightness found in most fundus photographs was applied. This is achieved by calculating a Gaussian blur of the image and subtracting it from the original image in each of the three RGB color channels. Further processing was carried out in this preprocessed image. The main idea was to level the background such that the reflectance was uniform over the entire macula. They proposed a multizone math model to reconstruct the macula. Each zone divided the macula into different annular and grid-like regions. The pixel gray levels were used as input for fitting into the custom software employing least-squares methods. After the geo-
metric model of the macula was created, it was subtracted from the original image to obtain a leveled image. The process was automatically iterated until a sufficient leveling has been achieved. In other words, the range of gray levels in the image is minimized to an acceptable level.
The drusen, which is superimposed on the image, appears brighter than the regular intensity of the background. The final threshold was obtained by applying a histogram analysis approach to the final leveled image (33). An optimal threshold defined the separation of background areas from drusen areas.
Smith’s technique has been validated successfully with the current standard of fundus photo grading by stereo pair viewing in the central 1000 and middle 3000 mm diameter subfields (28). One advantage of automation is portability of the software to use at other institutions. The work to create an automated algorithm will provide a useful, costeffective tool in clinical trials of AMD.
Despite the advances in automated quantification of drusen, some obstacles still remain. Drusen identification may be confounded by other objects present in the image. A computer ultimately must be taught how to differentiate drusen from other lesions (e.g., as retinal pigment epithelial hypopigmentation, exudates, and scars). Implementation with neural networks or morphological criteria may prove effective in eliciting unique features in the lesions. For now, some cases may still require supervision in digital automated segmentation (Fig. 4).
SCANNING LASER OPHTHALMOSCOPE
Photography is often associated with taking a white light source to obtain an image. However, monochromatic sources of light at a specific wavelength are available with the scanning laser ophthalmoscope (SLO). Originally used as a research tool, it is increasingly favored with other clinical imaging standards now. Moreover, pupil dilation is unnecessary, and light levels are dim during acquisition (34). The reflectance and absorbance spectra of the structures of interest can be seen. For example, the SLO provides better penetration and give views of the choroids layer. By the same token, things of less interest on the retina (e.g., drusen) will not be seen (26).
In autofluorescence (AF) imaging, a 488 nm laser source with a 500 nm barrier filter is used (26). This light source reveals structures that intrinsically fluoresce, primarily due to lipofuscin and its main fluorophore, A2E (35,36). Focal changes in AF or the changes in their spatial distribution are means of studying the health of the RPE. Previous studies have been made on correlations of change in AF distribution with pathological features (35,37–41). Focally increased AF (FIAF) refers to increased fluorescence in an area with respect to the rest of the background. This is abnormally high in patients with Stargardt disease and may be a marker for RPE disease in ARMD. In actual RPE death, as in geographic atrophy, there is focally decreased AF (FDAF), seen as a blackened area in the AF image (26).
PHOTOGRAPHY, MEDICAL |
295 |
Figure 4. Automated digital photo grading. Color fundus photo with circular grading template overlaid on top (a). Green channel (grayscale) of fundus photo (b). Using an algorithm that finds the lower and upper thresholds, the macula is divided into three sections: vessels and darker perivasculature, normal background, and bright drusen. The normal background was used to calculate the mathematical model, displayed as a contour graph (c). The model was subtracted from the original image to yield a background leveled image of uniform intensity in (d). Contrastenhanced image of a to show the boundaries of drusen (e). The algorithm then uses the leveled image
(d) to calculate a threshold that determines the drusen areas (segmented in green) and overlaid on top of the contrast enhanced layer (f).
TELEMEDICINE
As the average age of populations in developed countries continue to rise, the number of elderly people needing an eye exam will boom. In less populated areas, an ophthalmologist may not be readily accessible. In the United States, less than one-half of the diabetic population received an annual eye examination (42). One of the goals of telemedicine is to bridge the gap between places where patients can be evaluated and where service is rendered. An examination usually involves taking the patient’s fundus photos. With the advent of telemedicine and digital photography, the patient and doctor do not even have to be in the same room. Data can be efficiently and securely transferred across different institutions.
Telemedicine Framework
The goal of telemedicine is to establish a screening system with the ability to reach out to millions of unexamined patients for primary prevention. The following guidelines can be used to set up a generalized framework for telemedicine. We will use an ophthalmology setting as an example:
First, a patient will come into a primary care office to have their retina imaged. The camera itself should be operator-friendly, one that is easy to use by either a doctor’s assistant or a technician. The disease to be screened should have identifiable pathology on the image. Examples would
be diabetic retinopathy or AMD. The fundus photograph is then sent electronically to a reading center, which can be established at a far away university or hospital. Photos should be in a compressed digital format (e.g., JPEG).
In a paper by Sivagnanavel et al. (43), it was suggested that custom software for detecting AMD could be used at two different institutions. A grader at each institution independently ran the software and performed drusen quantification successfully, thus demonstrating portability and potential for automated software examinations. The results of the grading with software are comparable to grading manually by stereo-viewing. The only drawback is that the software may not be suitable in 20% of the images taken. For the percentage of cases that need supervision, a trained reader can manually examine the images. Images that were disqualified had poorly identified areas or multiple types of lesions that were difficult to distinguish.
At the reading center, a patient report is generated and sent electronically back to the primary care physician (PCP). Finally, a good network referral base must be established such that the PCP can refer an ophthalmologist if the patient screening comes up positive.
Screening Instrument
Built differently from the classic fundus camera, a telemedicine instrument is meant for screening more than

296 PHOTOGRAPHY, MEDICAL
5
6
1
3
4
2
7
Figure 5. Layout of the DigiScope. The imaging head (1) is mounted on an XYZ motorized and computer-controlled stage. The X, Y, and Z components (2, 3, and 4, respectively) allow movements in the superior-inferior direction, to and from the eye, and in the nasal-temporal direction, respectively. The operator interfaces with the camera by a touch screen (5). The subject leans the head and places it against the nosepad (6) to view the imaging system inside. The electronics and computer (7) that control the system and store the images are embedded in the machine and hidden from view. (used with permission for R. Zeimer, IOVS 43:5,2002.)
careful clinical diagnosis. In a telemedicine fundus camera (e.g., the Digiscope) (44), the goal was to create a good model for providing ophthalmic screening to the primary care office.
Keeping the instrument at low cost for production greatly increased its attractiveness for the primary doctor’s office. Therefore, a video camera with a resolution of 50 pixels per degree provided enough detail comparable to a fundus photograph. Such cameras typically yield images with 930 pixels diagonally, or a field of 198.
Figure 5 shows a simplified diagram of the DigiScope. The eye to be imaged is oriented by an internal lightemitting diode. Fixation and imaging covers the entire posterior pole and takes about eight images. The illumination is generated by a halogen bulb. Infrared light is eliminated by the first filter and the visible spectrum is limited to green by the second filter, which passes light between 510 and 570 nm. The beam then expands and illuminates the fundus.
There are two modes of imaging with the DigiScope. The first mode takes four frames per shutter, with the shutter lasting 130 ms. The four frames differ by the fine focus, such that the sharpest image can be chosen out of each set. The second mode is meant for stereoscopic effect. Four frames are acquired while the optical head moves horizontally along the x axis. A pair of images can be selected to generate a stereo effect.
The operator interfaces with the machine by a simple touch-screen. The duties of the operator are limited to basic
tasks (e.g., explaining the procedure, encouraging the patient to fixate at the blinking light, and checking the quality of the image).
A non-mydriatic camera is in consideration to provide greater patient comfort. Poor imaging quality and lack of stereo may cause a tendency to include RPE atrophy as drusen. However, newer generation cameras taking higher resolution images, coupled with the ability for digital stereo, may eliminate such drawbacks in the future.
PHOTOMICROGRAPHY
Photomicrography in biomedicine is the creation of images of biomaterial at magnification. Tissue or culture samples can be photographically recorded at both the gross level and at the level of cells. Images can be used for archival purposes or for analysis. Photomicrography replaced earlier camera lucida apparatus that projected microscope images through a beam splitter onto a plane for manual tracing.
Still photographs of biological specimen have traditionally been captured on 35 mm film. The development and popularization of digital camera technology, however, has had a drastic impact on the field of photomicrography. The relative ease of use has spurred the application of photomicrography in many areas, especially pathology and basic research.
Digital Cameras
Digital cameras offer several advantages over their film variants for most uses. Most digital cameras include some type of LCD (liquid-crystal display) screen. This screen can be used to display a photograph right after it is taken, allowing the user to evaluate the result of different camera settings and adjust as needed. This is a great convenience given the unusual light conditions under which photomicrographs are generally taken and the fact that most scientific users will probably not have professional photography training. On consumer models, the LCD can also display a real-time image of the scene to be photographed. Furthermore, digital cameras store images in a digital format, usually on a removable memory card. Images can be directly transferred to a personal computer for analysis or processing without having to use a scanner to digitize as with 35 mm film. The formats come in JPEG or TIFF. Still others cameras have the option of outputting in the RAW format. This is the raw data from the CCD (charge-coupled device) array that forms the core of the camera. The CCD cameras have also proven particularly useful in extremely low light microscopy, such as in certain fluorescence microscopy situations. Quantum efficiency, a measure of light sensitivity, can reach 90% in a back illuminated electron multiplying CCD, compared to20% for a conventional video camera (45,46) (Fig. 6).
Photomicroscope Description
The attachment of the camera to the microscope is essentially the same for both digital and film cameras though different adapters may be used. A camera can simply be held with the lens pressed flush against the eyepiece of a microscope or mounted with a special adapter for the
PHOTOGRAPHY, MEDICAL |
297 |
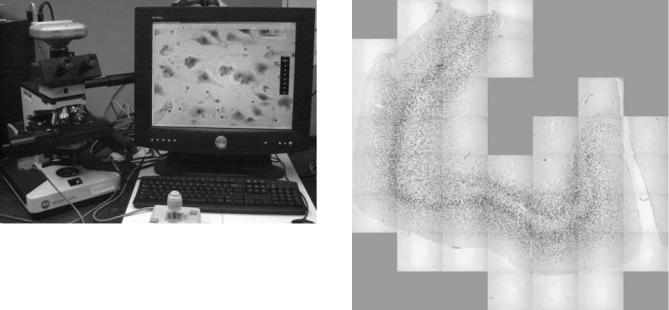
Figure 6. Retrofitted computerized microscope system with motorized stage and CCD digital imager directly connected to computer by Firewire cable. (used with permission from the laboratories of Victoria Arango, Ph.D., J. John Mann, M.D., and Mark Underwood, Ph.D. at NYSPI and Columbia University.)
eyepiece (46,47). This method can be used for many consumer digital cameras. Alternatively, a camera can be attached to the phototube or trinocular port of a microscope or through a special beam splitting adapter (47,48). Typically, SLRs (single lens reflex) and cameras specifically designed for photomicrography are attached in this way by their lens mounts. The tube thread standards commonly used in professional cameras to attach the lens are C-, T-, and F-mounts. Relay lens adapters may be necessary to correctly focus the image onto the film or CCD array in the camera as the normal lens is removed to use the C-, T-, or F-mount. Many of the major camera brands as well as third-party manufacturers produce these adapter kits. The primary concerns when attaching a camera are ensuring correct focus and avoiding vignetting. Vignetting refers to the darkening of the edges of an image (47). Proper Koehler’s illumination of the microscope, as well as focusing and zooming should correct this effect.
The CCD technology has also been applied successfully to real-time imaging through the microscope. Dedicated computer microscopy systems with CCD cameras have been made available by the major microscope manufacturers (e.g., Leica and Zeiss). The CCD video cameras can also be attached to existing microscope setups through the phototube as with still cameras. Traditional CCTV cameras can usually output in NTSC (National Television System Committee) or PAL (Phase Alternating Line), the common video standards in the United States and Europe, respectively. An image capture board is necessary to convert the TV signal for use with a computer. The CCD digital imagers specifically designed for scientific or microscopic use often can be connected by means of more conventional computer ports [e.g., Firewire (IEEE 1394) and USB (universal serial bus)]. These are preferred due to their resistance to radio frequency (RF) interference and higher resolutions (49). In both cases, specialized software is needed to manipulate and display the video image. Some of these imagers can be used to capture high resolution still images as well.
Figure 7. Montage of photomicrographs taken with 40 objective and stitched together with Neurolucida software (Microbrightfield, Inc., Williston, VT). Brodman area 24 of the prefrontal cortex is depicted. (used with permission from the laboratories of Victoria Arango, Ph.D., J. John Mann, M.D., and Mark Underwood, Ph.D. at NYSPI and Columbia University.)
For video applications, a more expensive three-chip, oneshot CCD system is preferred (46). These cameras use an array of photodetectors to record an image. One such array is referred to as a chip. Currently, cameras are available in one-chip and three-chip designs. A one-chip design produces color images by switching three colored filters over the array. This arrangement is referred to as one-chip, threeshot. Due to the switching of RGB (red, green, blue) filters, the framerate is necessarily reduced. A three-chip, one-shot camera splits the individual color channels and directs each to its own CCD array, imaging them simultaneously. Thus a higher framerate is maintained.
Camera computer systems integrated with a motorized microscope stage make possible more complicated photomicrograph sets. A computer controlled stage and camera can be programmed to take many overlapping digital images. With special software, these can be stitched together to form high magnification photomicrographs of large tissue sections (50). This represents an interesting alternative to low magnification macroscopic photography of tissue specimen. Systems have also been developed for 3D reconstruction using stacks of properly registered twodimensional (2D) photomicrographs (Fig. 7).
BIBLIOGRAPHY
1.Elsner AE. Reflectometry with a Scanning Laser Ophthalmoscope. Appl Opt 1992;31:3697–3710.
2.Figueroa MS, Regueras A, Bertrand J. Laser photocoagulation to treat macular soft drusen in age-related macular degeneration. Retina 1994;14(5):391–396.
298 PHOTOGRAPHY, MEDICAL
3.Yannuzzi LA, Gitter KA, Schatz H. The Macula: A Comprehensive Text and Atlas. Fundus Photography and Angiography. In: Justice JJ, editor. Baltimore: Williams & Wilkins; 1979.
4.Bedell AJ. Photographs of the Fundus Oculi. Philadelphia: F.A. Davis; 1929.
5.Lee MS, Shin DS, Berger JW. Grading, image analysis, and stereopsis of digitally compressed fundus images. Retina 2000;20(3):275–281.
6.Bird AC, et al. An international classification and grading system for age-related maculopathy and age-related macular degeneration. The International ARM Epidemiological Study Group. Survey Ophthal 1995;39(5):367–374.
7.Klein R, et al. The Wisconsin age-related maculopathy grading system. Ophthalmology 1991;98(7):1128–1134.
8.Klaver CC, et al. Age-specific prevalence and causes of blindness and visual impairment in an older population: the Rotterdam Study. Arch Ophthal 1998;116(5):653–658.
9.Smiddy WE, Fine SL. Prognosis of patients with bilateral macular drusen. Ophthalmology 1984;91(3):271–277.
10.Bressler SB, et al. Relationship of drusen and abnormalities of the retinal pigment epithelium to the prognosis of neovascular macular degeneration. The Macular Photocoagulation Study Group. Arch Ophthal 1990;108(10):1442–1447.
11.Bressler NM, et al. Drusen characteristics in patients with exudative versus non-exudative age-related macular degeneration. Retina 1998;8(2):109–114.
12.Holz FG, et al. Bilateral macular drusen in age-related macular degeneration. Prognosis and risk factors. Ophthalmology 1994;101(9):1522–1528.
13.Abdelsalam A, Del Priore L, Zarbin MA. Drusen in age-related macular degeneration: pathogenesis, natural course, and laser photocoagulation-induced regression. Survey Ophthalmol 1999;44(1):1–29.
14.Little HL, Showman JM, Brown BW. A pilot randomized controlled study on the effect of laser photocoagulation of confluent soft macular drusen [see comments]. Ophthalmology 1997;104(4):623–631.
15.Frennesson IC, Nilsson SE. Effects of argon (green) laser treatment of soft drusen in early age-related maculopathy: a 6 month prospective study. Br J Ophthalmol 1995;79(10):905–909.
16.Bressler NM, et al. Five-year incidence and disappearance of drusen and retinal pigment epithelial abnormalities. Waterman study. Arch Ophthalmol 1995;113(3):301–308.
17.Bressler SB, et al. Interobserver and intraobserver reliability in the clinical classification of drusen. Retina 1988;8(2): 102–108.
18.Age-Related Eye Disease Study Research Group, T. The AgeRelated Eye Disease Study System for Classifying Age-related Macular Degenration From Stereoscopic Color Fundus Photographs: The Age-Related Eye Disease Study Report Number 6. Am J Ophthalmol 2001;132(5):668–681.
19.Shin DS, Javornik NB, Berger JW. Computer-assisted, interactive fundus image processing for macular drusen quantitation [see comments]. Ophthalmology 1999;106(6):1119–1125.
20.Rapantzikos K, Zervakis M, Balas K. Detection and segmentation of drusen deposits on human retina: Potential in the diagnosis of age-related macular degeneration. Med Image Analysis 2003;7(1):95–108.
21.Sebag M, Peli E, Lahav M. Image analysis of changes in drusen area. Acta Ophthalmol 1991;69(5):603–610.
22.Morgan WH, et al. Automated extraction and quantification of macular drusen from fundal photographs. Aust New Zealand J Ophthalmol 1994;22(1):7–12.
23.Kirkpatrick JN, et al. Quantitative image analysis of macular drusen from fundus photographs and scanning laser ophthalmoscope images. Eye 1995;9(Pt 1):48–55.
24.Goldbaum MH, et al. The discrimination of similarly colored objects in computer images of the ocular fundus. Invest Ophthalmol Vis Sci 1990;31(4):617–623.
25.Peli E, Lahav M. Drusen measurement from fundus photographs using computer image analysis. Ophthalmology 1986;93(12):1575–1580.
26.Smith RT. Retinal Imaging and Angiography, Basic Science Course. New York: Eye Institute, Columbia University; 2005.
27.Smith RT, et al. A method of drusen measurement based on reconstruction of fundus reflectance. Br J Ophthalmol 2005;89(1):87–91.
28.Smith RT, et al. Automated detection of macular drusen using geometric background leveling and threshold selection. Arch Ophthalmol 2005;123:200–207.
29.Smith RT, et al. Patterns of reflectance in macular images: representation by a mathematical model. J Biomed Opt 2004;9(1):162–172.
30.Smith RT, et al. The fine structure of foveal images. Invest Ophthalmol Vis Sci 2001;42(Mar. Suppl.):153.
31.Smith RT, et al. A two-zone mathematical model of normal foveal reflectance in fundus photographs. Invest Ophthalmol Vis Sci 2003;44:E-365.
32.Chan JWK, et al. A Method of Drusen Measurement Based on Reconstruction of Fundus Background Reflectance. Invest Ophthalmol Vis Sci 2004;45(5):E-2415.
33.Otsu N. A threshold selection method from gray-level histograms. IEEE Trans Systems Man Cybernetics 1979;9(1):62– 66.
34.Elsner AE, Weiter JJ, Jalkh AE. New Devices for Retinal Imaging and Functional Evaluation. In: Freeman WR, ed. Practical Atlas of Retinal Disease and Therapy. New York: Raven Press; 1993. pp. 19–35.
35.Delori FC, et al. In vivo fluorescence of the ocular fundus exhibits retinal pigment epithelium lipofuscin characteristics. Invest Ophthalmol Vis Sci 1995;36(3):718–729.
36.von Ruckmann A, Fitzke FW, Bird AC. In vivo fundus autofluorescence in macular dystrophies. Arch Ophthalmol 1997;115(5):609–615.
37.Feeney-Burns L, Berman E, Rothman H. Lipofuscin of the human retinal pigment epithelium. Am J Ophthalmol 1980;90:783–791.
38.von Ruckmann A, Fitzke FW, Bird AC. Distribution of fundus autofluorescence with a scanning laser ophthalmoscope [comment]. Br J Ophthalmol 1995;79(5):407–412.
39.von Ruckmann A, Fitzke FW, Bird AC. Fundus autofluorescence in age-related macular disease imaged with a laser scanning ophthalmoscope. Invest Ophthal Vis Sci 1997;38(2):478–486.
40.Feeney-Burns L, Hildebrand E, Eldridge S. Aging human RPE: Morphometric analysis of macular, equatorial, and peripheral cells. Invest Ophthalmol Vis Sci 1984;25:195–200.
41.Wing G, Blanchard G, Weiter J. The topography and age relationship of lipofuscin concentrations in the RPE. Invest Ophthalmol Vis Sci 1978;17:600–607.
42.Mukamel D, et al. Barriers to compliance with screening guidelines for diabetic retinopathy. Ophthal Epidemiol 1999;6:61–72.
43.Sivagnanavel V, et al. An Interinstitutional Comparative Study and Validation of Computer-Aided Drusen Quantification. Br J Ophthalmol 2005;89:554–557.
44.Zeimer R, et al. A fundus camera dedicated to the screening of diabetic retinopathy in the primary-care physician’s office. Invest Ophthalmol Vis Sci 2002;43(5):1581–1587.
45.Coates CG, et al. Optimizing low-light microscopy with backilluminated electron multiplying charge-coupled device: enhanced sensitivity, speed, and resolution. J Biomed Opt 2004;9:1244–1252.