

- •VOLUME 5
- •CONTRIBUTOR LIST
- •PREFACE
- •LIST OF ARTICLES
- •ABBREVIATIONS AND ACRONYMS
- •CONVERSION FACTORS AND UNIT SYMBOLS
- •NANOPARTICLES
- •NEONATAL MONITORING
- •NERVE CONDUCTION STUDIES.
- •NEUROLOGICAL MONITORS
- •NEUROMUSCULAR STIMULATION.
- •NEUTRON ACTIVATION ANALYSIS
- •NEUTRON BEAM THERAPY
- •NEUROSTIMULATION.
- •NONIONIZING RADIATION, BIOLOGICAL EFFECTS OF
- •NUCLEAR MAGNETIC RESONANCE SPECTROSCOPY
- •NUCLEAR MEDICINE INSTRUMENTATION
- •NUCLEAR MEDICINE, COMPUTERS IN
- •NUTRITION, PARENTERAL
- •NYSTAGMOGRAPHY.
- •OCULAR FUNDUS REFLECTOMETRY
- •OCULAR MOTILITY RECORDING AND NYSTAGMUS
- •OCULOGRAPHY.
- •OFFICE AUTOMATION SYSTEMS
- •OPTICAL FIBERS IN MEDICINE.
- •OPTICAL SENSORS
- •OPTICAL TWEEZERS
- •ORAL CONTRACEPTIVES.
- •ORTHOPEDIC DEVICES MATERIALS AND DESIGN OF
- •ORTHOPEDICS PROSTHESIS FIXATION FOR
- •ORTHOTICS.
- •OSTEOPOROSIS.
- •OVULATION, DETECTION OF.
- •OXYGEN ANALYZERS
- •OXYGEN SENSORS
- •OXYGEN TOXICITY.
- •PACEMAKERS
- •PAIN SYNDROMES.
- •PANCREAS, ARTIFICIAL
- •PARENTERAL NUTRITION.
- •PERINATAL MONITORING.
- •PERIPHERAL VASCULAR NONINVASIVE MEASUREMENTS
- •PET SCAN.
- •PHANTOM MATERIALS IN RADIOLOGY
- •PHARMACOKINETICS AND PHARMACODYNAMICS
- •PHONOCARDIOGRAPHY
- •PHOTOTHERAPY.
- •PHOTOGRAPHY, MEDICAL
- •PHYSIOLOGICAL SYSTEMS MODELING
- •PICTURE ARCHIVING AND COMMUNICATION SYSTEMS
- •PIEZOELECTRIC SENSORS
- •PLETHYSMOGRAPHY.
- •PNEUMATIC ANTISHOCK GARMENT.
- •PNEUMOTACHOMETERS
- •POLYMERASE CHAIN REACTION
- •POLYMERIC MATERIALS
- •POLYMERS.
- •PRODUCT LIABILITY.
- •PROSTHESES, VISUAL.
- •PROSTHESIS FIXATION, ORTHOPEDIC.
- •POROUS MATERIALS FOR BIOLOGICAL APPLICATIONS
- •POSITRON EMISSION TOMOGRAPHY
- •PROSTATE SEED IMPLANTS
- •PTCA.
- •PULMONARY MECHANICS.
- •PULMONARY PHYSIOLOGY
- •PUMPS, INFUSION.
- •QUALITY CONTROL, X-RAY.
- •QUALITY-OF-LIFE MEASURES, CLINICAL SIGNIFICANCE OF
- •RADIATION DETECTORS.
- •RADIATION DOSIMETRY FOR ONCOLOGY
- •RADIATION DOSIMETRY, THREE-DIMENSIONAL
- •RADIATION, EFFECTS OF.
- •RADIATION PROTECTION INSTRUMENTATION
- •RADIATION THERAPY, INTENSITY MODULATED
- •RADIATION THERAPY SIMULATOR
- •RADIATION THERAPY TREATMENT PLANNING, MONTE CARLO CALCULATIONS IN
- •RADIATION THERAPY, QUALITY ASSURANCE IN
- •RADIATION, ULTRAVIOLET.
- •RADIOACTIVE DECAY.
- •RADIOACTIVE SEED IMPLANTATION.
- •RADIOIMMUNODETECTION.
- •RADIOISOTOPE IMAGING EQUIPMENT.
- •RADIOLOGY INFORMATION SYSTEMS
- •RADIOLOGY, PHANTOM MATERIALS.
- •RADIOMETRY.
- •RADIONUCLIDE PRODUCTION AND RADIOACTIVE DECAY
- •RADIOPHARMACEUTICAL DOSIMETRY
- •RADIOSURGERY, STEREOTACTIC
- •RADIOTHERAPY ACCESSORIES
25.Sonoda M, Takano M, Miyahara J, Kato H. Computed radiography utilizing scanning laser stimulated luminescence. Radiology 1983;148:833–838.
26.Agfa. The highest productivity in computed radiography. Agfa-Gevaert N.V. Report. Belgium: AGFA; 1994.
27.Ogawa E, Arakawa S, Ishida M, Kato H. Quantitative analysis of imaging performance for computed radiography systems. SPIE Phys Med Imag 1995;2432:421–431.
28.Kodak. Optimizing CR images with image processing: Segmentation, tone scaling, edge enhancement. Kodak Health Sciences Technical and Scientific Manuscript. New York: Eastman Kodak; March 1994.
29.Gringold EL, Tucker DM, Barnes GT. Computed radiography: User-programmable features and capabilities. Dig Imag 1994;7(3):113–122.
30.Ishida M. Fuji computed radiography technical review, No. 1. Tokyo: Fuji Photo Film Co., Ltd.; 1993.
31.Storto ML, Andriole KP, Kee ST, Webb WR, Gamsu G. Portable chest imaging: clinical evaluation of a new processing algorithm in digital radiography. 81st Scientific Assembly and Annual Meeting of the Radiological Society of North America. Chicago, IL: November 26 – December 1, 1995.
32.Vuylsteke P, Dewaele P, Schoeters E. Optimizing Radiography Imaging Performance. Proceedings of the 1997 AAPM Summer School; 1997; 107–151.
33.Solomon SL, Jost RG, Glazer HS, Sagel SS, Anderson DJ, Molina PL. Artifacts in Computed Radiography. AJR 1991;157: 181–185.
34.Volpe JP, Storto ML, Andriole KP, Gamsu G. Artifacts in chest radiography with a third-generation computed radiography system. AJR 1996;166:653–657.
35.Oestman JW, Prokop M, Schaefer CM, Galanski M. Hardware and software artifacts in storage phosphor radiography. RadioGraphics 1991;11:795–805.
36.Lee DL, Cheung LK, Jeromin LS. A new digital detector for projection radiography. Proc SPIE Phys Med Imag 1995;2432: 237–249.
37.Andriole KP. Productivity and cost assessment of CR, DR and screen-film for outpatient chest examinations. Dig Imag 2003;15(3):161–169.
38.Pratt HM, et al. Incremental cost of department-wide implementation of a PACS and computed radiography. Radiology 1998;206:245–252.
39.Chunn T. Tape storage for imaging. Imag World 1996;5(8): 1–3.
40.Horii S, et al. A Comparison of case-retrieval times: Film versus PACS. Dig Imag 1992;5(3):138–143. htpp://www. diagnosticimaging.com.
41.Eisenman, et al.. Diagnost Imag 1996;9:27.
42.Siegel E, Shannon R. Understanding Compression. Great Fall, VA: SCAR Publications; 1997; 11–15.
43.Erickson BJ, Manduca A, Palisson P, Persons KR, Earnest F 4th, Savcenko V, Hangiandreou NJ. Wavelet compression of medicl images. Radiology. 1998;206(3):599–607.
44.Avrin DE, et al. Hierarchical storage management scheme for cost-effective on-line archival using lossy compression. Dig Imag 2001;14(1):18–23.
45.Savcenko V, Erickson BJ, Palisson PM, Persons KR, Manduca A, Hartman TE, Harms GF, Brown LR. Detection of subtle abnormalities on chest radiographs after irreversible compression. Radiology 1998;206(3):609–616.
46.Huang HK. PACS and Imaging Informatics: Basic Principles and Applications. Hoboken, NJ: John Wiley & Sons, Inc.; 2004.
47.Badano A. Principles of cathode-ray tube and liquid crystal display devices. In: Samei E. Flynn MJ, editors. Advances in Digital Radiography: Categorical Course in Diagnostic Radiology Physics. Oak Brook, IL: Syllabus, RSNA; 2003. pp. 91–102.
PIEZOELECTRIC SENSORS |
359 |
48.Leachtenauer JC. Electronic Image Display: Equipment Selection and Operation. Bellingham, WA: SPIE Press; 2004.
49.Partan G, et al. Diagnostic performance of liquid crystal and cathode-ray-tube monitors in brain computed tomography. Eur Radiol 2003;13:2397–2401.
50.Langer S, et al. Comparing the efficacy of 5-MP CRT versus 3- MP LCD in the evaluation of interstitial lung disease. Dig Imag, Online publication date, June 29, 2004.
51.Iwano S, et al. Detection of subtle pulmonary disease on CR chest images: Monochromatic CRT monitor vs color CRT monitor. Eur Radiol 2001;11:59–64.
52.Krupinski E, Roehrig H. Pulmonary nodule detection and visual search: P45 and P104 monochrome versus color monitor displays. Academ Radiol 2002;9:638–645.
53.Andriole KP, et al. Addressing the coming radiology crisis: Transforming the radiological interpretation process. Dig Imag Online October 2004.
Further Reading
Andriole KP, Gould RG, Avrin DE, Bazzill TM, Yin L, Arenson RL. Continuing quality improvement procedures for a clinical PACS. Dig Imag 1998;11(31):111–114.
Honeyman JC, et al. PACS quality control and automatic problem notifier. SPIE Med Imag 1997: PACS Design and Evaluation
1997;3035:396–404.
Honeyman JC, Staab EV. Operational concerns with PACS implementations. Appl Radiol 1997; August: 13–16.
Seibert JA. Photostimulable phosphor system acceptance testing. In: Seibert JA, Barnes GT, Gould RG, editors. Specification, Acceptance Testing and Quality Control of Diagnostic X-ray Imaging Equipment. Medical Physics Monograph no. 20. Woodbury, NY: AAPM; 1994. 771–800.
Willis CE, Leckie RG, Carter J, Williamson MP, Scotti SD, Norton G. Objective measures of quality assurance in a computed radiography-based radiology department. Proc SPIE 1995; 2432:588–599.
See also PHOTOGRAPHY, MEDICAL; RADIOLOGY INFORMATION SYSTEMS;
ULTRASONIC IMAGING.
PIEZOELECTRIC SENSORS
YANBIN LI
Department of Biological and
Agricultural Engineering,
University of Arkansas
Fayetteville, AR
XIAO-LI SU
BioDetection Instruments LLC
Fayetteville, AR
INTRODUCTION
Piezoelectric sensors are generally referred to as analytical devices for detection of chemical or biological agents with piezoelectric quartz crystals (PQCs) as transducers. The origin of piezoelectric sensors can be traced back to 1880 when Jacques and Pierre Curie discovered normal and converse piezoelectric effects (1). In the former, the application of a mechanic stress to the surface of quartz and some other crystals induces an electric potential across the crystal; in the latter, conversely, the application of a voltage across the crystal results in an internal mechanical

360 PIEZOELECTRIC SENSORS
strain. The converse piezoelectric effect is the basis of all piezoelectric sensors.
PQCs have been widely used in oscillators and filter circuits for high-precision frequency control. The use of PQCs as a mass sensor is based on the work of Sauerbrey (2), which established a linear relationship between the decrease in resonant frequency and the increase in surface mass loading of a PQC. Because of its high sensitivity for mass detection, a piezoelectric sensor is usually called quartz crystal microbalance (QCM). QCM was originally and is still used to measure thickness of coatings in vacuum and air. The first example for application of QCM to analytical chemistry was reported by King in 1964 (3). He coated PQCs with various materials and used them as a sorption detector in gas chromatography to detect and measure the composition of vapors and gases. The applications of piezoelectric sensors were limited to the determination of environmental and other gas species for a long time. The liquid-phase measurements began in the 1980s when new oscillator technology emerged and advanced to make PQCs oscillate in solution as stably as in gas. Then, numerous piezoelectric chemical sensors and biosensor have been reported.
Piezoelectric sensors, characterized by their simplicity, low cost, high mass-detection sensitivity, and versatility, have found increasing applications in biomedical analyses. The objective of this article is to briefly present the theory, equipment, and applications of piezoelectric sensors in the biomedical area. Interested readers are referred to some key review articles (4–9) for more theoretical and technical details of piezoelectric sensors.
THEORY
Typically, a piezoelectric sensor is fabricated by modifying a PQC with a layer of sensing material, chemical or biological, that has specific affinity to a target analyte. The specific binding between the sensing material and the target analyte causes a change in the resonant frequency of PQC that is proportional to the amount of target analyte adsorbed or bound on the sensor surface, which can be correlated to the concentration of target analyte in the original sample.
A typical PQC consists of a quartz crystal wafer and two excitation electrodes plated on opposite sides of the crystal. The wafer is cut from a natural or synthetic crystal of quartz. The electromechanical coupling and stresses resulting from an applied electric field depend on the crystal symmetry, cut angle, and electrode configuration
(4). Different modes of electromechanical coupling lead to different types of acoustic waves, including thickness shear mode (TSM), surface acoustic wave (SAW), shear horizontal (SH) SAW, SH acoustic plate mode (APM), and flexural plate wave (FPW).
The TSM device, widely referred to as QCM, is the simplest and most popular piezoelectric sensor. Hence, we will focus on TSM piezoelectric sensors in this article. A TSM sensor typically uses AT-cut quartz as a piezoelectric substrate, which has a minimal temperature coefficient and is obtained by cutting quartz crystals at approximately 358 from the z-axis of the crystal. Figure 1
 AT-cut quartz crystal
 Excitation electrodes
 Leading wires
 Holder
Figure 1. Schematic of an AT-cut piezoelectric quartz crystal.
shows the schematic of an AT-cut PQC. When an alternating electric field is applied across an AT-cut quartz crystal through the excitation electrodes, the crystal produces a shear vibration in the x-axis direction parallel to the electric field and propagation of a transverse shear wave through the crystal in the thickness direction. The resonant frequency of the vibration is determined by the properties of the crystal and the contacting medium.
Mass Response
Most piezoelectric sensors are used as mass sensors that are based on the Sauerbrey equation (2):
2F2
DF ¼ p 0 DM (1)
A mqrq
where DF is the frequency change measured (Hz), F0 is the resonant frequency of the fundamental mode of the crystal (Hz), A is the area of the gold disk coated onto the crystal (cm2), rq is the density of the quartz crystal (2.648 g cm 3), mq is the shear modulus of quartz (2.947 1011 g cm 1 s 2), and DM is the mass change (g). The Sauerbrey equation is applicable only to a thin ( 1 mm) and elastic film coupled to the crystal surface, where the mass loading can be up to 0.05% of the crystal mass.
According to the Sauerbrey equation, the magnitude of frequency decrease corresponding to a mass increase is proportional to F02; i.e. the higher the fundamental resonant frequency, the higher the mass sensitivity. Typical AT-cut PQCs have F0 ¼ 5 30 MHz with a frequency resolution of0.1 Hz and a mass sensitivity of 0.056 2.04 Hz cm2 ng 1. Thinner crystal wafers have higher F0 and thus have higher mass sensitivity, but they are also more fragile and thus are more difficult to manufacture and handle. For one of the most commonly used AT-cut PQCs, F0 ¼ 9 MHz, A ¼ 0.2 cm2, and the detectable mass is 1.09 ng per Hz, which is approximately 100 times higher than that of an electronic fine-balance with a sensitivity of 0.1 mg. As AT-cut piezoelectric sensors can sensitively detect mass change at nanogram levels, they are frequently referred to as quartz crystal microbalances (QCMs) or nanobalances.
However, as a mass sensor, the QCM does not have selectivity. To make a selective QCM chemical sensor or biosensor, the QCM must be coated with a film of chemical or biological recognition material that is selective to a target analyte.
Viscosity-Density Effect
When a QCM is employed in liquid phase, in addition to the mass change, it also responds to other factors such as liquid density and viscosity, surface energy, viscoelasticity, roughness, and surface charge density. For a QCM with only one side in contact with a Newtonian liquid, DF is linearly proportional to the squared root of the product of viscosity (hL) and density (rL) of the liquid (10):
|
¼ |
0 |
q |
|
|||||
DF |
|
F3=2 |
r |
h |
L |
=pm |
r |
q |
(2) |
|
|
|
L |
|
q |
|
|
||
For a QCM with simultaneous mass and liquid loading, DF can be expressed as (11)
PIEZOELECTRIC SENSORS |
361 |
Lm
C0 Cm
Rm
Figure 2. Butterworth–Van Dyke model of a piezoelectric quartz crystal.
|
¼ pmqrq ð |
|
þ pÞ |
|
admittance equations: |
|
DF |
2F2 |
DM=A |
r h =4pF |
|
(3) |
The BVD model can be described by the following |
0 |
0 |
|
||||
|
|
|
L L |
|
|
|
|
|
|
|
|
||
In equation 3, the first term is equivalent to the Sauerbrey equation, and the second term is equivalent to Kanazawa equation. Equation 3 indicates the additive nature of mass and viscosity-density effects in changing the resonant frequency. It also shows that it is impossible to distinguish the mass effect from the viscosity-density effect when only the resonant frequency is monitored.
Some piezoelectric sensors are based on the densityviscosity change rather than on the elastic pure mass change. For example, a piezoelectric sensor was used to detect E. coli based on the gelation of Tachypleus amebocyte lysate (TAL) (12), and the detection range is 2.7 104 2.7 108 cells mL 1. Gee et al. (13) used a piezoelectric senor for measuring microbial polymer production and growth of an environmental isolate obtained from river sediment contaminated with petroleum hydrocarbons. The increasing amount of produced polymer corresponded to an increase in the viscosity of the liquid, which was directly measurable as the fluid contacts the surface of the quartz crystal in the sensor system. These methods, although they lack specificity, are advantageous in that coating on the PQC surface is unnecessary.
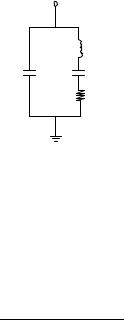
Equivalent Circuit Analysis
Equivalent circuit analysis can provide more detailed information about the surface/interface changes of a piezoelectric sensor (11,14–17). A PQC can be represented by a Butterworth–Van Dyke (BVD) model (Fig. 2), which is composed of a static capacitance (C0) in parallel with a motional branch containing a motional inductance (Lm), a motional capacitance (Cm), and a motional resistance (Rm) in series. Each parameter has its distinct physical meaning: C0 reflects the dielectric properties between the electrodes located on opposite sides of the insulating quartz crystal; Cm represents the energy stored during oscillation, which corresponds to the mechanical elasticity of the vibrating body; Lm is related to the displaced mass; and Rm is the energy dissipation during oscillation, which is closely related to viscoelasticity of the deposited films and viscositydensity of the adjacent liquid.
|
YðvÞ ¼ GðvÞ þ jBðvÞ |
|
|
|
(4) |
|
|
GðvÞ ¼ |
Rm |
|
|
|
(5) |
|
Rm2 þ ðvLm 1=vCmÞ2 |
|
|
|||
B v |
|
ðvLm 1=vCmÞ |
þ |
vC |
|
(6) |
Þ ¼ Rm2 þ ðvLm 1=vCmÞ2 |
|
|||||
ð |
|
0 |
|
|||
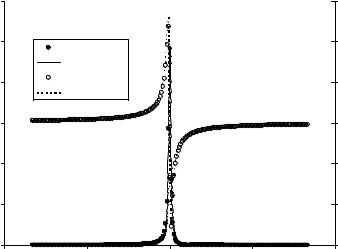
where Y is admittance, i.e., the reciprocal of impedance. Y is a complex quantity, its real part G is conductance, and its imaginary part B is susceptance. Both G and B are a function of the scanning frequency f (v ¼ 2pf) and the four equivalent circuit parameters. These parameters are determined by physical properties of the quartz crystal, perturbing mass layer and contacting liquid, and can be obtained by fitting the measured impedance/admittance data to the BVD model using the admittance equations. Figure 3 shows typical admittance spectra of an unperturbed 8 MHz AT-cut PQC in air. The fitted results of F0, Rm, Lm, Cm, and C0 were 7.99 MHz, 9.6 V, 17.9 mH, 22.2 fF, and 8.2 pF (including parasitic capacitance in the test fixture) for the quartz crystal (18).
High-frequency admittance/impedance analysis has been extensively used in surface/interface studies. A simpler way to provide insights into the viscoelastic properties of a bound surface mass is to simultaneously monitor F0 and Rm or F0 and the dissipation factor D using a quartz crystal analyzer that is much less expensive than the impedance analyzer. This method has been applied to study the behavior of adherent cells in response to chemical, biological, or physical changes in the environment.
For a QCM in contact with liquid, the change of motional resistance was first derived by Muramatsu et al. (14) as follows:
DR ¼ ð2pF0rLhLÞ1=2A=k2 |
(7) |
where k is the electromechanical coupling factor. Simultaneous measurements of DF and DR can differ-
entiate an elastic mass effect from the viscosity-induced effect. DR is a good measure of the viscoelastic change. For an elastic mass change, DR will be zero and DF will be linearly proportional to the mass change in accordance with the Sauerbrey equation. For a QCM with only one side in contact with a Newtonian liquid, both DF and DR are linearly proportional to the squared root of the product
362 PIEZOELECTRIC SENSORS
Conductance (S)
Figure 3. Typical conductance and susceptance spectra of an unperturbed 8 MHz AT-cut PQC in air.
0.12 |
|
|
|
0.06 |
0.1 |
G, measured |
|
|
0.04 |
|
|
|
|
|
|
G, fitted |
|
|
|
0.08 |
B, measured |
|
|
0.02 |
B, fitted |
|
|
||
|
|
|
|
|
0.06 |
|
|
|
0 |
0.04 |
|
|
|
–0.02 |
0.02 |
|
|
|
–0.04 |
0 |
|
|
|
–0.06 |
7.987E+06 |
7.990E+06 |
7.993E+06 |
7.996E+06 |
7.999E+06 |
Frequency (Hz)
Susceptance (S)
of viscosity and density of the liquid. Therefore, a pure viscosity-density change will result in a linear DF DR plot. In the presence of a viscoelastic change, the DR DF plot will lie between the pure viscosity-density effect line and the elastic mass effect line or even above the former (8,18).
EQUIPMENT AND EXPERIMENTS
Traditionally, a piezoelectric sensor (resonator) is driven by a homemade oscillator, and the oscillation frequency is measured by a frequency counter that is connected to a recorder or computer for data collection. The Pierce oscillator with a fundamental mode AT-cut resonator is the most popular oscillator design type and operates with the piezoelectric sensor as an inductive element. Now such oscillators are commercially available. One of the suppliers is International Crystal Manufacturing (Oklahoma City, OK), which produces a standard (clock) oscillator for gasphase QCMs and lever oscillator for liquid-phase QCMs.
Highly sophisticated, automatic, and microprocessorcontrolled piezoelectric detectors or QCM instruments are commercially available from several manufacturers (19). The main commercial systems include QCA-917- and 922 quartz crystal analyzers (Princeton Applied Research, Oak Ridge, TN), EQCM 400 series electrochemical quartz crystal microbalances (CH Instruments, Austin, TX), EQCN-700 and -900 electrochemical quartz crystal nanobalances (Elchema, Potsdam, NY), the PZ1000 immuno-biosensor system and PZ-105 gas phase piezoelectric detector (Universal Sensors, Metairie, LA), RQCM research QCM (Maxtek, Santa Fe Springs, CA), and Mark series cryogenic and thermally controlled QCMs (QCM Research, Lake Forest, CA). These systems are designed to reliably measure mass change up to 100 mg with a resolution of 1 ng cm 2. Most of them are programmed and controlled by easy-to-use Windows-based software (Microsoft Corporation, Redmond, WA). The QCA 922, designed for EQCM with a potentiostat or stand-alone
operation, can simultaneously measure resonant frequency and resistance of QCM. The RQCM can measure crystal frequency and crystal resistance for up to three crystals simultaneously. Moreover, high-frequency impedance/admittance analyzers such as E4991A (Agilent Technologies, Palo Alto, CA) can be used to obtain the impedance/admittance spectra of the quartz crystal and to acquire the equivalent circuit parameters by fitting the impedance/admittance data to the BVD model as described earlier.
Previously, for liquid-phase applications, the dip-and- dry approach is made in the measurement of piezoelectric sensors, in which the resonant frequency of the same sensor is measured in gas phase before and after the sample solution is dipped and dried. This approach does not need a special fixture to mount the crystal; however, it is unsuitable for automation and has poor reproducibility. By mounting the crystal to a dip or well cell, like those from Princeton Applied Research and International Quartz Manufacturing, and letting only one side of the crystal exposed to the test solution, it is possible to monitor the frequency change in solution in real time.
Flow-through QCM biosensors have drawn increasing attention due to its ease for automation. For example, Su and Li (20) developed a flow-through QCM immunosensor system for automatic detection of Salmonella typhimurium. The QCM immunosensor was fabricated by immobilizing anti-Salmonella antibodies on the surface of an 8 MHz AT-cut quartz crystal with Protein A method, and then installed into a 70 mL flow-through detection cell. The flow cell was composed of acrylic, with upper and lower pieces held together by two screws with O-rings. One face of the sensor was exposed to the 70 mL chamber that was connected to a peristaltic pump and multiposition switching valve. The flow cell was designed to reduce the potential of air bubbles remaining on the crystal after filling from the dry state and to allow air bubbles in the liquid phase to pass out without sticking to the crystal. The oscillation frequency of the QCM sensor was monitored in real time by a Model 400 EQCM system controlled by a laptop PC
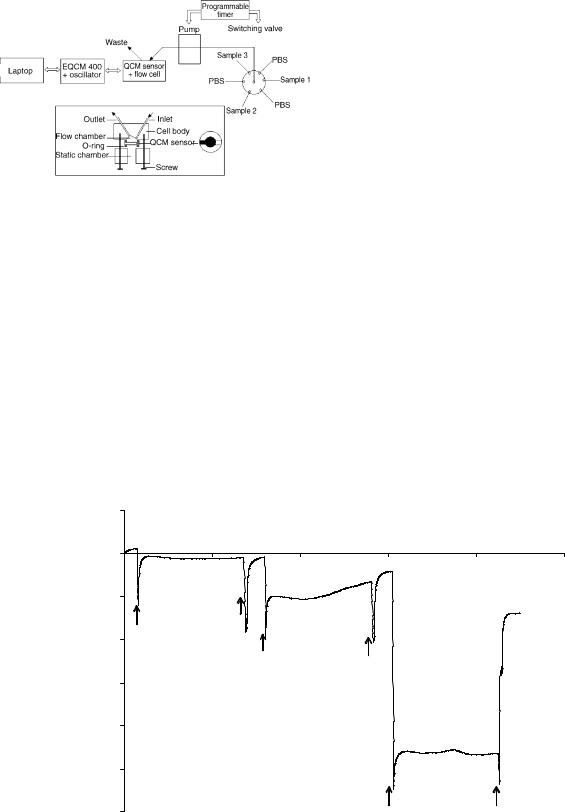
Figure 4. Components of an automatic QCM immunosensor system (top) and the flow cell (bottom).
under the Windows environment. Both the pump and the valve were controlled by a DVSP programmable timer. A schematic diagram of the whole QCM sensor system is illustrated in Fig. 4. The operation of this QCM sensor system was totally automated. As shown in Fig. 5, negative frequency shifts exist between every two neighboring phosphate buffered saline solution (PBS) baselines, which were attributed to the specific adsorption of target bacteria onto the biosensor surface.
APPLICATIONS
Piezoelectric sensors, as simple yet powerful tools, have been extensively employed in detection of chemical and biological agents as well as in the study of chemical, electrochemical, and biological interfacial processes. An online
PIEZOELECTRIC SENSORS |
363 |
search from SciFinder Scholar (Chemical Abstracts) with the keyword ‘‘quartz crystal microbalance’’ resulted in 4722 references, and 2203 of them are journal articles published during 2000–2005. These studies were conducted to develop
(1) antibody/antigen-based biosensors (immunosensors) for detecting biomacromolecules, viruses, cells, as well as small molecules; (2) DNA/RNA probe-based biosensors (genosensors) for in situ detection of nucleic acid hybridization; (3) biosensors based on immobilized enzymes, proteins, receptors, lipids, or whole cells; and (4) chemical sensors based on inorganic or organic films for measurements of organic vapors, metal ions, and drugs. Also piezoelectric sensors reported in these studies were used for (1) studies of adsorption of biomolecules and living cells by bare QCM or QCM with functionalized surfaces; and (2) QCM/EQCM investigation/analyses of interfacial phenomena and processes, including self-assembles monolayers (SAMs), films formed using the layer-by-layer assembly technique, molecularly imprinted polymers, biopolymer films, micellar systems, ion transfer at and ion exchange in thin polymer films, doping reactions of conducting polymers, electrodedeposition of metals, and dissolution of metal films.
In the following sections, immunosensors and genosensors, which are most relevant and important to biomedicine, are chosen to discuss the applications of piezoelectric sensors. Some review articles (4–8,21,22) are available for more comprehensive information about applications of piezoelectric sensors.
Immunosensors
One important feature of piezoelectric sensors is that they can be designed as label-free immunosensors. The
|
20 |
|
|
|
|
|
|
|
PBS |
|
Time (min) |
|
|
|
0 |
|
|
|
|
|
|
|
|
|
|
|
|
|
0 |
50 |
100 |
150 |
200 |
250 |
|
-20 |
|
|
|
|
|
(Hz) |
|
5.6 x10⁶ |
PBS |
|
|
|
|
|
|
|
|
||
shift |
-40 |
|
|
|
|
|
|
|
|
|
|
||
|
|
5. 6 x 10⁷ |
|
|
|
|
Frequency |
|
|
PBS |
|
|
|
|
|
|
|
|
||
-60 |
|
|
|
|
|
|
|
|
|
|
|
|
|
|
-80 |
|
|
|
|
|
|
-100 |
|
|
|
|
|
|
-120 |
|
|
5. 6 x 10⁸ CFU/mL |
PBS |
|
|
|
|
|
|
|
Figure 5. Typical output of an automatic QCM immunosensor system for detection of S. typhimurium.

364 PIEZOELECTRIC SENSORS
immunosensors taking advantage of antibody-antigen affinity reaction are among the most promising biosensors due to their high specificity and versatility. Conventional immunosensors generally involve the formation of a sandwich immuno-complex consisting of an immobilized primary antibody, captured target analyte, and labeled secondary antibody followed by an optical or electrochemical measurement to detect the label directly or indirectly. Piezoelectric immunosensors do not need a labeled antibody and are thus much simpler and easier in operation than the sandwich immunosensors.
The first piezoelectric immunosensors is reported by Shons et al. (23), who modified a quartz crystal with bovine serum albumin (BSA) and used it to detect anti-BSA antibodies. Since then, numerous piezoelectric immunosensors have been reported for the detection of various analytes from small molecules to biological macromolecules, whole viruses, and cells. In brief, a piezoelectric immunosensor is fabricated by immobilizing a specific antibody/antigen on the surface of an AT-cut PQC. When the immunosensing surface is exposed to a sample solution, a binding reaction occurs between the immobilized antibody/antigen and its complementary part (target analyte). The binding event can be monitored in situ by QCM based on the change of surface mass loading and/or other properties such as viscoelasiticity, and thus, the target species is quantitatively detected. Figure 6 illustrates the stepwise assembly and the principle of piezoelectric immunosensor for direct detection of the binding of target analyte and immobilized antibody.
Microbial detection is probably the most common area in which piezoelectric immunosensors are applied. Current practice for effective treatment of infectious diseases without abuse of antibiotics relies on rapid identification of specific pathogens in clinical diagnostics. Nevertheless, conventional methods for microbial detection are inadequate due to being tedious and laborious. Although traditional culture methods hypothetically allow the detection of a single cell, they are extremely time-consuming, typically requiring at least 24
hours and multistep tests to confirm the analysis. Even current rapid methods such as enzyme-linked immunosorbent assay (ELISA) and polymerase chain reaction (PCR) still take several hours to generate only tentative results and require skilled personnel.
Numerous piezoelectric immunosensors have been reported for rapid and specific detection of pathogenic bacteria as alternatives to the conventional methods since the pioneer work of Muramatsu et al. (24), which involved the determination of Candida albicans with an AT-cut PQC coated with a specific antibody. Piezoelectric immunosensors have been developed for detection of different bacteria including S. typhimurium, S. paratyphi, E. coli, E. coli K12, Chlamydia trachomatis, Yersisinia pestis, Candida albicans, and Shigella dysenteriae (25–27). The lower limits of detection typically ranged between 105 and 107 cells mL 1 along with a detection time of tens of minutes to several hours.
QCM has been used to detect various infectious viruses. In the study by Ko¨nig and Gratzel (28), Herpes simplex types 1 and 2, Varicella-zoster virus, Cytomegalovirus, and Epstein–Barr virus were detected using a reusable QCM immunosensor with a detection range from 104 to 109 cells. They reported that a similar QCM immunosensor could detect Rotavirus and Adenovirus with a linear detection range from 106 to 1010 cells (25) as well as hepatitis A and B viruses (29). Kosslinger et al. (30) demonstrated the feasibility of detecting HIV viruses using a QCM sensor. Antibodies specific to the HIV were absorbed on the crystal surface, and a serum sample could be detected in 10 min in a flow QCM system.
A piezoelectric immunosensor was developed for the detection of cortisol in a range of 36–3628 ppb (31). Cortisol antibodies were covalently bound onto the Au electrode of a 10 MHz crystal with a water-insoluble polymer and thyroxine antibodies.
Piezoelectric immunosensors have also been frequently reported for determination of biological macromolecules. For example, Kurosawa et al. (32) constructed a high-affinity
Figure 6. Mechanism of a piezoelectric immunosensor for direct detection of the binding of target analyte and immobilized antibody.
Au electrode |
|
|
· Silanized layer |
||||||||
|
|
· polymer membrane |
|||||||||
|
|
|
|
Surface |
|
|
|
|
|
|
|
|
|
|
|
|
|
|
|
|
|
· Langmuir-Blodgett film |
|
|
|
|
|
modification |
|
|
|
|
|
|
|
|
|
|
|
|
|
|
|
|
|
· Protein A |
|
Quartz crystal |
|
|
· Self-assembled monolayer |
||||||||
|
|
|
|
Antibody |
|
|
|
||||
|
|
|
|
immobilization |
|
|
|
||||
|
|
|
|
|
|
|
|
|
|
|
Immobilized Antibody |
|
|
|
|
|
|
|
|
|
|
|
|
|
|
|
|
|
|
|
|
|
|
|
|
|
|
|
|
|
|
|
|
|
|
|
|
|
|
|
|
Sample analysis |
|
|
|
Target analyte |
|||
|
|
|
|
|
|
|
|||||
Surface mass /
viscoelasticity change
Time
piezoelectric immunosensor using anti-C-reactive protein (CRP) antibody and its fragments for CRP detection. When anti-CRP F(ab’)2-IgG antibody was immobilized on the PQC, the detection limit and the linearity of CRP calibration curve were achieved at concentrations from 0.001 to 100 mg dL 1 even in serum samples.
Antibody immobilization is vital in successful development of a piezoelectric immunosensor. The current immobilization methods are mainly based on a silanized layer, polymer membrane, Langmuir–Blodgett film, Protein A, and SAM. Protein A, due to its natural affinity toward the Fc region of IgG molecules, has been commonly used to orient antibodies for immunoassays. The orient immobilization has the advantage that it does not block the active sites of the antibodies for binding of target antigens. The procedure for antibody immobilization based on Protein A is simple. Briefly, the Au surface of PQC is coated first with Protein A, and then the antibody is bound to the immobilized Protein A directly. The SAM technique offers one of the simplest ways to provide a reproducible, ultra-thin, and well-ordered layer suitable for further modification with antibodies, which has the potential of improving detection sensitivity, speed, and reproducibility.
Analytical applications of piezoelectric immunosensors based on the direct binding between immobilized antibodies/antigens and target analytes are attractive, owing to the versatility and simplicity of the method. However, the sensitivity of theses approaches is relatively low due to the relatively small numbers of analyte entities that can specifically bind to the limited number of antibody/antigen sites on the surface. Some amplification techniques have been investigated for the sensitivity of piezoelectric immunosensors. Ebersole and Ward (33) reported an amplified mass immunosorbent assay with a QCM for the detection of adenosine 5’-phosphosulfate (APS). The enzymatic amplification led to significant enhancement of the detection sensitivity; levels of approximately 5 ng mL 1 (10 14 M) APS reductase could be detected, whereas the direct binding of APS reductase at even more elevated concentrations could not be measured. A sensitive QCM immunosensor was developed by incorporating the Au nanoparticleamplified sandwiched immunoassay and silver enhancement reaction (34). Au nanoparticle-promoted silver (I) reduction and silver metal deposition resulted in about a two-orders-of-magnitude improvement in human IgG quantification. Su and Li (18) described a piezoelectric immunosensor for the detection of S. typhimurium with simultaneous measurements of the changes in resonant frequency and motional resistance (DF and DR). In the direct detection of S. typhimurium, DF and DR were proportional to the cell concentration in the range of 105 to 108 and 106 to 108 cells mL 1, respectively. Using anti-Salmo- nella magnetic microbeads as a separator/concentrator for sample pretreatment as well as a marker for signal amplification, the detection limit was lowered to 102 cells mL 1 based on the DR measurements.
Genosensors
Piezoelectric genosensors are fabricated by immobilizing a single-stranded (ss) DNA/RNA probe on the PQC surface.
PIEZOELECTRIC SENSORS |
365 |
|||
|
|
|
|
|
|
|
|
|
|
Au electrode |
S |
S |
S |
S |
|
HS |
|||||
|
|
|
|
||
thiolated DNA probe |
|
|
target DNA |
|
|
Quartz crystal |
|
|
|
|
Figure 7. Illustration of piezoelectric genosensor for in situ detection of DNA hybridization.
Specific hybridization between the immobilized DNA/RNA probe and its complementary strand in sample causes a change in the resonant frequency of the QCM. Various methods have been used for the immobilization of DNA probes onto the QCM surface. Among these, the SAM method is most commonly used because it offers an ordered, stable, and convenient immobilization. Thiolated oligonucleotides can directly form a SAM on the gold surface of the QCM electrode via the Au-thiolate bond. Figure 7 is an illustration of the piezoelectric genosensor for DNA hybridization detection.
DNA/RNA probes have been applied to detect pathogenic microorganisms in clinical samples. Bacterial and viral pathogens are detectable because of their unique nucleic acid sequences. The DNA/RNA probing process is usually preceded by PCR amplification as target nucleic acid may be present in a sample in very small quantities. Most PCR formats are followed by the detection of amplicons using gel electrophoresis or the membrane-based hybridization method. The former lacks of sensitivity; the latter is more specific, but it requires multistep processing and is thus time-consuming.
Over the past decade, many attempts have been made to develop biosensors for sensitive and reliable detection of DNA hybridization. Fawcett et al. (35) were the first to develop a piezoelectric DNA sensor. Piezoelectric genosensors, due to their simplicity and cost effectiveness, have been recently applied to detect gene mutation, genetically modified organisms, and bacterial pathogens. Su et al. (36) described a piezoelectric DNA sensor for detection of point mutation and insertion mutations in DNA. The method involved the immobilization of ssDNA probes on QCM, the hybridization of target DNA to form homoduplex or heteroduplex DNA, and finally the application of MutS for the mutation recognition. By measuring the MutS binding signal, DNA containing a T:G mismatch or unpaired base was discriminated against perfectly matched DNA at a target concentration ranging from 1 nM to 5 mM.
The sensitivity of piezoelectric genosensors may be improved through optimizations of probe immobilization or by means of signal amplification using anti-dsDNA antibodies, liposomes, enzymes, or nanoparticles. A nanoparticle is an effective marker for mass amplification as it has relatively greater mass in comparison with a DNA molecule. Amplified with nanoparticles, the limit of DNA detection by QCM can be lowered for several orders to as low as 10 16 M (37). Mao et al. (38) developed a piezoelectric genosensor for the detection of E. coli O157:H7 with nanoparticle amplification, in which thiolated ssDNA probes specific to E. coli O157:H7 eaeA gene were
366 PIEZOELECTRIC SENSORS
immobilized onto the QCM surface through self-assembly and streptavidin conjugated Fe3O4 nanoparticles were used as ‘‘mass enhancers’’ to amplify the detection signal. As low as 10 12 M synthesized oligonucleotides and 2.67 102 cells mL 1 of E. coli O157:H7 could be detected by the piezoelectric genosensor.
CONCLUSIONS
Piezoelectric sensors, as sensitive mass sensors or QCMs, have been applied to detect and measure a broad variety of biomedical analytes in both gas and liquid phases based on the adsorption/desorption of target analyte(s) on/from the sensor surface, in which the selectivity is controlled by the sensing material. Piezoelectric sensors are more than pure mass sensors as they are also capable of detecting subtle changes in the solution–surface interface that can be due to density-viscosity changes in the solution, viscoelastic changes in the bound interfacial material, and changes in the surface free energy. The most attractive advantage of QCMs is that they are suitable for label-free detection and flow-through, in real-time detection. However, using the direct detection approach, the sensitivity of QCM is inadequate for some applications in biomedical analysis such as detection of low levels of pathogens and other biological agents in clinical samples. The lack of sensitivity may be addressed by employing amplification techniques as introduced earlier, by using piezoelectric films and bulk silicon micromaching techniques to manufacture highfrequency QCMs (21), or by designing devices of other acoustic wave modes such as SAW, APM, and FPW.
BIBLIOGRAPHY
1.Curie J, Curie P. An oscillating quartz crystal mass detector. Comp Rend 1880;91:294–297.
2.Sauerbrey GZ. Use of quartz vibration for weighing thin films on a microbalance. J Phys 1959;155:206–212.
3.King WH Jr. Piezoelectric sorption detector. Anal Chem 1964;36:1735–1739.
4.Guilbault GG, Jordan JM. Analytical uses of piezoelectric crystals: A review. CRC Crit Rev Anal Chem 1988;19:1–28.
5.Ward MD, Buttry DA. In situ interfacial mass detection with piezoelectric transducers. Science 1990;249:1000–1007.
6.Buttry DA, Ward MD. Measurement of interfacial process at electrode surfaces with the electrochemical quartz crystal microbalance. Chem Rev 1992;92:1355–1379.
7.Janshoff A, Galla H-J, Steinem C. Piezoelectric mass-sensing devices as biosensors—An alternative to optical biosensors? Angew Chem Int Ed 2000;39:4004–4032.
8.Marx KA. Quartz crystal microbalance: a useful tool for studying thin polymer films and complex biomolecular systems at the solution-surface interface. Biomacromolecules 2003;4: 1099–1120.
9.Buck RP, Lindner E, Kutner W, Inzelt AG. Piezoelectric chemical sensors. Pure Appl Chem 2004;76:1139–1160.
10.Kanazawa KK, Gordon JG. The oscillation frequency of a quartz resonator in contact with a liquid. Anal Chim Acta 1985;175:99–105.
11.Martin SJ, Granstaff VE, Frye GC. Characterization of a quartz crystal microbalance with simultaneous mass and liquid loading. Anal Chem 1991;63:2272–2281.
12.Qu X, Bao LL, Su X-L, Wei W. Rapid detection of Escherichia coli form with a bulk acoustic wave sensor based on the gelation of Tachypleus amebocyte Lyste. Talanta 1998;47: 285–290.
13.Gee WA, Ritalahti KM, Hunt WD, Loffler FE. QCM viscometer for bioremediation and microbial activity monitoring. IEEE Sens J 2003;3:304–309.
14.Muramatsu H, Tamiya E, Karbue I. Computation of equivalent circuit parameters of quartz crystals in contact with liquids and study of liquid properties. Anal Chem 1988;60: 2142–2146.
15.Zhou T, Nie L, Yao S. On equivalent circuits of piezoelectric quartz crystals in a liquid and liquid properties, Part I, Theoretical derivation of the equivalent circuit and effects of density and viscosity of liquids. J Electroanal Chem Interf Electrochem 1990;293:1–18.
16.No¨el MAM, Topart PA. High-frequency impedance analysis of quartz crystal microbalance, 1. General considerations. Anal Chem 1994;66:484–491.
17.Xie Q, Wang J, Zhou A, Zhang Y, Liu H, Xu Z, Yuan Y, Deng M, Yao S. A study of depletion layer effects on equivalent circuit parameters using an electrochemical quartz crystal impedance system. Anal Chem 1999;71:4649–4656.
18.Su X-L, Li Y. A QCM immunosensor for Salmonella detection with simultaneous measurements of resonant frequency and motional resistance. Biosens Bioelectron. In press.
19.O’Sullivan CK, Guilbault GG. Commercial quartz crystal micobalances theory and applications. Biosens Bioelectron 1999;14:663–670.
20.Su X-L, Li Y. An automatic quartz crystal microbalance immunosensor system for Salmonella detection. ASAE Paper No. 047043. St. Joseph, MI: The American Society of Agricultural Engineers; 2004.
21.Martin SJ, Frye GC, Spates JJ, Butler MA. Gas sensing with acoustic devices. Proc-IEEE Ultrasonics Symp 1996;1:423– 434.
22.Vaughan RD, Geary E, Pravda M, Guilbault GG. Piezoelectric immunosensors for environmental monitoring. Int J Environ Anal Chem 2003;83:555–571.
23.Shons A, Dorman F, Najarian J. The piezoelectric quartz immunosensor. J Biomed Mater Res 1972;6:565–570.
24.Muramatsu H, Kajiwara K, Tamiya E, Karube I. Piezoelectric immunosensor for detection of Candida albicans microbes. Anal Chim Acta 1986;188:257–261.
25.Konig B, Gratzel M. Detection of viruses and bacteria with piezoelectric immunosensor. Anal Lett 1993;26:1567– 1575.
26.Ivnitski D, Abel-Hamid I, Atanasov P, Wilkins E. Biosensors for detection of pathogenic bacteria. Biosens Bioelectron 1999;14:599–624.
27.Deisingh AK, Thompson M. Detection of infectious and toxigenic bacteria. Analyst 2002;127:567–581.
28.Ko¨nig B, Gratzel M. A novel immunosensor for Herpes virus. Anal Chem 1994;66:341–348.
29.Ko¨nig B, Gratzel M. Long term stability and improved reusability of piezoelectric immunosensor for human erythrocytes. Anal Chim Acta 1993;280:37–42.
30.Ko¨sslinger C, Crost S, Aberl F. A quartz crystal microbalance for measurements in liquids. Biosens Bioelectron 1992;7: 397–410.
31.Attili BS, Suleiman AA. Peizoelectric immunosensor for detection of cortisol. Anal Lett 1995;28:2149–2159.
32.Kurosawa S, Nakamura M, Park JW, Aizawa H, Yamada K, Hirata M. Evaluation of a high-affinity QCM immunosensor using antibody fragmentation and 2-methacryloyloxyethyl phosphorylcholine (MPC) polymer. Biosens Bioelectron 2004;20:1134–1139.