

- •VOLUME 5
- •CONTRIBUTOR LIST
- •PREFACE
- •LIST OF ARTICLES
- •ABBREVIATIONS AND ACRONYMS
- •CONVERSION FACTORS AND UNIT SYMBOLS
- •NANOPARTICLES
- •NEONATAL MONITORING
- •NERVE CONDUCTION STUDIES.
- •NEUROLOGICAL MONITORS
- •NEUROMUSCULAR STIMULATION.
- •NEUTRON ACTIVATION ANALYSIS
- •NEUTRON BEAM THERAPY
- •NEUROSTIMULATION.
- •NONIONIZING RADIATION, BIOLOGICAL EFFECTS OF
- •NUCLEAR MAGNETIC RESONANCE SPECTROSCOPY
- •NUCLEAR MEDICINE INSTRUMENTATION
- •NUCLEAR MEDICINE, COMPUTERS IN
- •NUTRITION, PARENTERAL
- •NYSTAGMOGRAPHY.
- •OCULAR FUNDUS REFLECTOMETRY
- •OCULAR MOTILITY RECORDING AND NYSTAGMUS
- •OCULOGRAPHY.
- •OFFICE AUTOMATION SYSTEMS
- •OPTICAL FIBERS IN MEDICINE.
- •OPTICAL SENSORS
- •OPTICAL TWEEZERS
- •ORAL CONTRACEPTIVES.
- •ORTHOPEDIC DEVICES MATERIALS AND DESIGN OF
- •ORTHOPEDICS PROSTHESIS FIXATION FOR
- •ORTHOTICS.
- •OSTEOPOROSIS.
- •OVULATION, DETECTION OF.
- •OXYGEN ANALYZERS
- •OXYGEN SENSORS
- •OXYGEN TOXICITY.
- •PACEMAKERS
- •PAIN SYNDROMES.
- •PANCREAS, ARTIFICIAL
- •PARENTERAL NUTRITION.
- •PERINATAL MONITORING.
- •PERIPHERAL VASCULAR NONINVASIVE MEASUREMENTS
- •PET SCAN.
- •PHANTOM MATERIALS IN RADIOLOGY
- •PHARMACOKINETICS AND PHARMACODYNAMICS
- •PHONOCARDIOGRAPHY
- •PHOTOTHERAPY.
- •PHOTOGRAPHY, MEDICAL
- •PHYSIOLOGICAL SYSTEMS MODELING
- •PICTURE ARCHIVING AND COMMUNICATION SYSTEMS
- •PIEZOELECTRIC SENSORS
- •PLETHYSMOGRAPHY.
- •PNEUMATIC ANTISHOCK GARMENT.
- •PNEUMOTACHOMETERS
- •POLYMERASE CHAIN REACTION
- •POLYMERIC MATERIALS
- •POLYMERS.
- •PRODUCT LIABILITY.
- •PROSTHESES, VISUAL.
- •PROSTHESIS FIXATION, ORTHOPEDIC.
- •POROUS MATERIALS FOR BIOLOGICAL APPLICATIONS
- •POSITRON EMISSION TOMOGRAPHY
- •PROSTATE SEED IMPLANTS
- •PTCA.
- •PULMONARY MECHANICS.
- •PULMONARY PHYSIOLOGY
- •PUMPS, INFUSION.
- •QUALITY CONTROL, X-RAY.
- •QUALITY-OF-LIFE MEASURES, CLINICAL SIGNIFICANCE OF
- •RADIATION DETECTORS.
- •RADIATION DOSIMETRY FOR ONCOLOGY
- •RADIATION DOSIMETRY, THREE-DIMENSIONAL
- •RADIATION, EFFECTS OF.
- •RADIATION PROTECTION INSTRUMENTATION
- •RADIATION THERAPY, INTENSITY MODULATED
- •RADIATION THERAPY SIMULATOR
- •RADIATION THERAPY TREATMENT PLANNING, MONTE CARLO CALCULATIONS IN
- •RADIATION THERAPY, QUALITY ASSURANCE IN
- •RADIATION, ULTRAVIOLET.
- •RADIOACTIVE DECAY.
- •RADIOACTIVE SEED IMPLANTATION.
- •RADIOIMMUNODETECTION.
- •RADIOISOTOPE IMAGING EQUIPMENT.
- •RADIOLOGY INFORMATION SYSTEMS
- •RADIOLOGY, PHANTOM MATERIALS.
- •RADIOMETRY.
- •RADIONUCLIDE PRODUCTION AND RADIOACTIVE DECAY
- •RADIOPHARMACEUTICAL DOSIMETRY
- •RADIOSURGERY, STEREOTACTIC
- •RADIOTHERAPY ACCESSORIES
R
RADIATION DETECTORS. See RADIATION PROTECTION
INSTRUMENTATION.
RADIATION DOSE PLANNING,
COMPUTER-AIDED
JONATHAN G. LI
University of Florida
Gainesville, Florida
LEI XING
Stanford University
Stanford, California
INTRODUCTION
The term radiation dose planning in radiation therapy refers to the process of designing treatment strategies for optimally delivering a desired radiation dose to the intended volume while minimizing the dose to healthy tissues as much as possible, and estimating the radiation dose throughout the irradiated volume. In pursuit of better energy deposition characteristics, higher and higher energy photon and electron sources have been developed and used throughout the history of radiation therapy. Ionizing radiation dose can be delivered externally using electron accelerators or radioactive sources, or internally by implanting radioactive sources in the tumor volume. Heavy particles (e.g., protons, neutrons, and carbons) have also been used in radiation therapy, although the high cost of these machines have limited their widespread application. Our discussion will be restrected to radiation dose planning with external photon beams generated with medical megavoltage electron linear accelerators (linacs), which is by far the most widely used method of radiation cancer treatment.
Most medical linacs are isocentrically mounted, that is, they can rotate around a horizontal axis in 3608. Combined with the rotation of the treatment couch, radiation can be directed toward the patient from all possible directions. Two pairs of collimators or jaws moving in the orthogonal direction are usually built in the linac head to collimate the beam into a square or rectangular shape with continuously variable field sizes. Figure 1 shows a typical medical linac. A treatment usually involves several beams from different directions with different beam weights and beam-modify- ing devices in order to deliver a uniform dose to the target and to limit dose to surrounding normal tissues. Commonly used beam-modifying devices include custom-made blocks, which further collimate the radiation beam into any arbitrary shape, and wedge filters, which are wedge-shaped metal absorbers placed in the path of the beam to cause a tilt of the resulting isodose curves in the patient. To achieve optimal results, computer-aided radiation dose planning has played an increasing role in radiation therapy.
Many steps are involved in planning a radiation treatment. One of the first steps in the process is to establish a three-dimensional (3D) patient anatomy model based on the patient’s image information. Toward this goal, one needs to delineate the areas to be treated (targets) and any dose-limiting normal structures. Developments in 3D imaging, digital imaging processing, and multimodality imaging have greatly aided this process. Treatment strategies are then developed where radiation beams are chosen for optimal target coverage without delivering excessive dose to critical structures. Radiation dose throughout the irradiated volume is calculated, and the plan evaluated. Several trial and error efforts are usually required before a clinically acceptable plan is generated. Most of the treatment planning is now performed using computers with dedicated software called a treatment planning system (TPS). With the availability of fast processors and large random access memory (RAM), voluminous patient data depicting accurate 3D geometry and anatomy from a computed tomography (CT) scanner can be manipulated in a TPS, giving radiation oncologists and treatment planners better visualization of the internal structures and greater ability to tailor the treatment to the particular circumstances. Dose display and plan evaluation tools have made it easier to compare different treatment plans. This article concentrates on new developments in radiation dose planning since the first edition of this encyclopedia (1). The widespread clinical implementation of 3D planning techniques (e.g., virtual simulation, image registration, model-based dose calculation algorithms, and treatment plan optimization) have made a major impact on the current practice of radiation therapy. All of the new developments are computationally intensive and require large RAM for image processing. Their increasing role in radiation dose planning has tied closely to the development and availability of fast computers and large RAM.
VIRTUAL SIMULATION
Virtual simulation is a process of delineating target and normal organs and designing treatment field arrangements and portals on a computer, based on a detailed 3D model of a patient built from a sequence of closely spaced transverse images from a CT scanner. Virtual simulation is now widely used and has replaced conventional simulation for most of the treatment planning except in some simple or emergency cases. Conventionally, the patient simulation is done using a simulator with the patient in the treatment position. A conventional simulator duplicates a linac geometry, but uses a diagnostic kilovoltage X-ray tube to enhance image contrast. Two-dimensional (2D) projection radiographs are taken from various gantry positions that have been chosen for treatment. Target volume and normal structures are drawn on the 2D simulation films and correct positioning of the fields and shielding blocks can be obtained in relation to
455

456 RADIATION DOSE PLANNING, COMPUTER-AIDED
Figure 1. Photograph of an isocentric medical electron linear accelerator (Elekta Precise, Elekta Inc.).
anatomical and external landmarks. These geometries are transferred to the linac for patient treatment. In contrast to conventional simulation, where the treatment fields are designed on 2D radiographs while the patient stays on the simulation table, virtual simulation relies on the 3D CT data acquired with the patient in the treatment position and using the same immobilization device as will be used for treatment. The volumetric CT data represent the ‘‘virtual’’ or digital patient. Target delineation and field design are then done off-line without the patient’s presence using dedicated virtual simulation workstations or treatment planning systems. Figure 2 shows a screen capture of a commercial virtual simulation package with different views that aid in visualizing the patient’s internal structures and in the selection of beams and beam portals for treatment.
A typical patient CT data set has > 100 axial slices, each of which contains 512 512 picture elements (pixels). With 16 bits per pixel, a CT data set can easily run over 50 MB. Manipulating, displaying, and storing such voluminous data sets require enormous computer resources and have only been made possible in the past two decades due to the dramatic advancements in computer hardware. Historically, the evolution of radiation therapy has been strongly dependent on the available computer and imaging technologies and this trend is expected to continue in the years to come as radiation therapy proceeds into an era of computer-controlled delivery and real time image guidance and feedback.
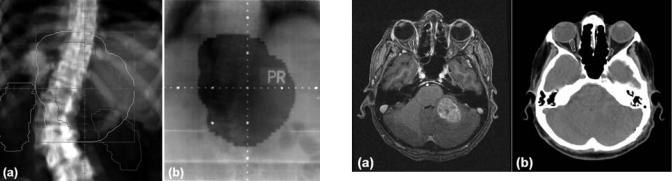
Figure 2. A screen capture of a commercial virtual simulation software (AcQsim 4.9.1, Philips Medical Systems) depicting the various tools available for treatment planning. (a) Axial view through the isocenter of a right posterior oblique (RPO) beam.
(b) Digitally reconstructed radiograph of the RPO beam with the beam shape (yellow) and various structures projected onto it. (c) A 3D rendering of the patient’s external contour. (d) Sagittal view through the middle of the patient.
An important step in virtual simulation is the generation of digitally reconstructed radiographs (DRR) for treatment planning and verification (2). A DRR is a com- puter-generated beam’s-eye-view image that simulates the X-ray attenuation property and projection geometry of a conventional simulator. It is obtained by tracing the divergent path of X rays from the radiation source through the 3D patient CT data set onto a plane beyond the data set and orthogonal to the central ray. Fast raytracing algorithms have been developed to calculate the radiological path through a CT data set (3,4). Compared with radiographs from a conventional simulator, DRRs offer several distinct advantages. Whereas tumors and normal anatomic structures are sometimes difficult to visualize on a conventional radiograph because of the overlapping effect, they can usually be discerned much better on an axial CT image. The contours of the tumor and normal structures drawn on the CT images can be projected onto the DRR. This greatly helps the treatment planner in selecting beam geometries that will irradiate the target while avoiding critical anatomic structures. The DRRs can be generated quickly for any angular projection through the body, whereas using a simulator and film requires many minutes of patient setup and film developing for each projection. The brightness and contrast of a DRR can be digitally manipulated to bring out certain anatomic features. This can be used for patient setup verification by comparing the DRR with a radiographic image of the treatment field (portal image) obtained on the treatment machine. Figure 3 illustrates a DRR with several structures and the treatment field shape projected onto it and the corresponding portal image of the same
RADIATION DOSE PLANNING, COMPUTER-AIDED |
457 |
Figure 3. Comparison of a digitally reconstructed radiograph
(a) and the corresponding portal film (b). The beam shape (yellow) was projected onto the DRR for treatment verification.
field. Such comparison verifies both the positioning of the patient and the treatment field shape.
IMAGE REGISTRATION
Radiotherapy treatment planning has been based mostly on CT images. Advantages of CT images include high spatial integrity, high spatial resolution, excellent bony structure depiction, and the ability to provide relative electron density information used for radiation dose calculation. However, CT images do not provide good soft tissue contrast. Moreover, CT images are anatomic in nature, that is, they provide snapshots of the patient’s anatomy without any functional information of various organs or structures. Other imaging modalities, especially the magnetic resonance imaging (MRI) and positron emission tomography (PET), have been used increasingly in radiation therapy planning in conjunction with CT images. Magnetic resonance imaging provides better soft tissue contrast than CT images, and is the modality of choice when delineating treatment target of brain tumors. Positron emission tomography provides functional information about tumor metabolism and is a useful tool in tumor diagnosis, staging, target volume delineation and assessment of therapeutic response. However, current MRI and PET devices suffer from several drawbacks that make them unsuitable for radiotherapy planning as the sole modality. Imaging artifacts and geometric distortions exist in MR images. PET has a lower resolution than CT and contains no anatomy information of the normal structures. Information derived from MRI or PET needs to be fused or registered with the corresponding CT images for treatment planning.
Three-dimensional image registration aims at finding a geometric transformation that maps the volume elements (voxels) of one tomographic data set onto another tomographic data set of the same or different modality. Since different scans are done at different times and possibly with different patient immobilization devices, image registration is difficult to perform manually, and sophisticated computer algorithms have been developed for various registration applications (5). Some algorithms make use of common geometric features, such as points, lines, or
Figure 4. Registered MR (a) and CT (b) images of a brain tumor. The tumor (red contour) is readily seen on the MR image.
surfaces identified on both image sets to determine the transformation. These features can be extracted either manually or automatically, and the accuracy in the identification of the common features directly affects the registration accuracy. Other image registration algorithms are based on information contained in the whole image sets (e.g., the image intensity values) and seek to maximize the amount of shared information in the two data sets. Image registration between images of different modalities based on shared information methods is especially challenging as different image modalities involve entirely different physical processes, and therefore voxels of the same tissues can appear very differently on different images. For example, high voxel intensity areas on a CT image (e.g., the bone) may correspond to dark areas on a MRI image. Figure 4 shows an axial CT image of a brain with the registered MR image. The registered secondary image (MR image in this case) is interpolated and resampled to give the axial view at the same axial position as the primary CT image. Contours of the tumor and normal structures drawn on one image are transferred and displayed automatically onto the other image.
Various degrees of simplification have been assumed in the medical image registration. The simplest and widely used registration assumes that the transformation is rigid body, where only image translation and rotation is allowed with six degrees of freedom. Rigid body transformation preserves all distances in an image. The most important and successful application of rigid body registration is in the head, and particularly the brain. Image registration between MRI and CT has been the standard practice for the treatment planning of brain tumors in most cancer centers in the United States. In more general situations, where other parts of the body are involved and images are acquired under different conditions or using different modalities with the patient in different positions, more degrees of freedom are often needed. The simplest of the nonrigid body transformations, the affine transformation, introduces an additional six degrees of freedom with anisotropic scaling and skews. An affine transformation preserves collinearity (i.e., all points lying on a line initially still lie on a line after the transformation), parallelism (parallel lines stay parallel after the transformation), and ratios of distances in an image, but not necessarily angles or distances. Image registration with more degrees of freedom
458 RADIATION DOSE PLANNING, COMPUTER-AIDED
than the affine transformation is an active area of research and its application in radiation therapy has so far been limited (6–8). This most general type of image registration technique is refereed to as deformable image registration. Commonly used deformable models can be categorized into two categories: free form B-spline and biomechanical finite element methods. Clinically, the need for a robust deformable registration technique is ever increasing because of the recent development in image-guided radiation therapy and much research is being carried out in this area. In four-dimensional (4D) radiation therapy of breast cancer, for example, where time-resolved CT images were used to monitor anatomic changes due to breathing, reconstruction of dose to different organs relied on the registration between the voxels at different phases of the breathing cycle (9). However, a detailed discussion of the subject is clearly beyond the scope of this article and the readers are referred to the references cited above.
The drive for more accurate registration between PET and CT images has led to the development of PET–CT, a new imaging technology that combines high quality PET and CT scanners in a single device (10,11). With PET–CT, patients undergo CT and PET scans sequentially under the same immobilization with a table translation, therefore providing simultaneous anatomic and metabolic information under almost identical conditions. Image registration becomes a simple process of correcting for the known table translation. An added advantage of PET–CT over PET only is the faster scan time, where the CT scans, which only take a few minutes, are used for attenuation correction. With PET only, the attenuation correction is obtained from a transmission scan, which takes on the order of 30 min. Although incorporating functional imaging in radiotherapy treatment planning is relatively new, the interest is increasing steadily and many studies have shown that new functional information would change patient management decisions in many disease sites (12–14).
RADIATION DOSE CALCULATION
Dose calculation plays a pivotal role in radiation therapy treatment planning. To achieve the expected therapeutic results, radiation dose distribution throughout the irradiated volume should be known to a desired degree of accuracy. Generally speaking, there are two major types of dose calculation algorithms: correction and model based. Correction-based methods compute the dose distributions in patients by correcting the dose distributions of similar geometries in a homogeneous water phantom for the beam modifiers, patient contours, tissue heterogeneities, and volume scattering effect. There are several algorithms for heterogeneity corrections. Two simple one-dimensional (1D) methods are the ratio of TPR, in which only densities along primary photon path are considered, and the powerlaw (or Batho) method, which takes the depth of the heterogeneity with respect to the depth of the point of measurement into account. Sontag and Cunningham (15) implemented the first algorithm, often referred to as the equivalent tissue/air ratio method, to estimate scatter
dose in three dimensions and took advantage of the detailed anatomical information derived from CT images. Wong and Purdy (16) examined eight methods of photon inhomogeneity correction for their photon transport approximations and improved correction-based algorithms by introducing more realistic transport models into the calculations. The volume scattering effects (scatter dose as a function of field size and shape) are often computed by using the equivalent square field method and/or Clarkson integration (17). Some pencil beam methods, like the finitesize pencil beam algorithm (18), are also classified as the correction-based methods. Model-based algorithms simulate the treatment situation from first principle and can directly calculate the dose distributions in a patient for a given beam energy, geometry, beam modifiers, patient contour, and tissue heterogeneities. The kernel-based convolution–superposition and Monte Carlo method are representatives of the kind. These commonly used algorithms are briefly summarized below.
Correction-Based Methods
Calculation of radiation dose is conventionally done by interpolating from measured data in a water phantom and correcting for any nonstandard situations. To serve this purpose, large amounts of beam data need to be collected that would allow for data interpolation with reasonable degree of accuracy. Measurement is usually done with a computer-controlled automatic scanning system. Dose as a function of depth along the central axis of the beam and off-axis distance along the transverse directions is measured for a large number of field sizes at a fixed source-to-water surface distance (SSD). These measurements need to be repeated for both open and wedged fields. Dose as a function of depth along the central axis, when normalized to a given depth (usually the depth of maximum dose for a reference field size), is called the percentage depth dose (PDD) and was an important quantity in the early days of radiation therapy when most of the treatment setups were at a fixed SSD. Figure 5a illustrates the definition of PDD and can be measured readily with a scanning system. Modern radiotherapy with isocentricmounted gantries typically uses fixed SAD setups. As the gantry rotates around the patient with the isocenter near the center of the tumor, the SSD (and the tumor depth) changes. The quantity most useful for dose calculation in these cases is the tissue/phantom ratio (TPR), which is defined as the ratio of dose on the central axis at depth d in a phantom to dose at the same point and field size at a
reference depth dref and is shown in Fig. 5b and c. When the depth of dose maximum is chosen as dref, TPR is sometimes
called the tissue-maximum ratio (TMR). Whereas PDD for the same field size varies significantly with SSD, TPR is essentially independent of SSD. Therefore, a single TPR table can be used for all SSDs. Dose calculations based on TPR or other TPR derivatives have been discussed extensively (1), especially in the textbooks of Johns and Cunningham (19) and Khan (20).
The limitations of correction-based methods are numerous. Patient geometry and internal structures can deviate significantly from a flat and homogeneous water phantom.

|
|
SSD |
SSD |
|
|
dref |
|
dmax |
|
|
d |
|
|
R |
S |
P |
d |
|
|
|
r |
|
|
|
|
|
|
Q |
|
|
|
(a) |
|
(b) |
(c) |
Figure 5. Schematic diagram illustrating the definition of the PDD and the phantom ratio (TPR). The PDD at a depth d is defined as the dose at the point, D(Q), to the dose at point P, at the same SSD. It depends both on the SSD and the field size r. The TPR at depth d is defined as the ratio of dose at point S to dose at point R, at the same source-to-axis distance (SAD).
Although corrections can be made to account for the deviation, they are approximate and do not fully take into account the effect of secondary electron transport. This effect arises because secondary electrons ejected by megavoltage photons deposit a significant fraction of their energy far away from their point of origin. In regions where there is an imbalance between secondary electrons coming in and going out, such as near the interface between tissue– bone or tissue–air or in the beam penumbra, a condition known as charged particle disequilibrium exists. Correctionbased methods are likely to produce erroneous results in these regions. Nowadays, correction-based dose calculation algorithms have mostly been replaced by model-based methods in commercial TPSs, where data measured in a water phantom under standard conditions are used to fit a few machine-specific model parameters, which in turn are used to calculate dose under the existing patient geometry. These include the convolution–superposition method and the Monte Carlo method. Nevertheless, correction-based methods are intuitive and have often been used as a quality assurance procedure to double-check the results of com- puter-generated treatment plans at one or a few calculation points for both conventional and intensity-modulated radiation therapy (21,22).
Convolution–Superposition Method
In the convolution–superposition techniques (23–27), the dose deposition is viewed as a superposition of appropriately weighted kernels of point irradiations and the superposition can be efficiently evaluated by means of convolution if the kernels are considered as spatially invariant. The kernels, representing the energy transport and dose deposition of secondary particles stemming from a point irradiation, can be calculated by Monte Carlo simulation (28). The Monte Carlo method computes dose distributions by simulating particle transport in a patient and will be described in the next section. Model-based
RADIATION DOSE PLANNING, COMPUTER-AIDED |
459 |
algorithms are capable of accounting for electronic disequilibrium, and therefore are more accurate in dealing with tissue inhomogeneity and calculating dose in the electronic disequilibrium regions.
A thorough review of dose calculations in radiation therapy has been given by Ahnesjo and Aspradakis (27). There are a few different convolution–superposition methods, which can be divided into point kernel models and pencil kernel models. Mathematically, the dose at a spatial point, D(r), comprises contributions from the shower of secondary particles resulting from primary interaction sites at r0. Assuming that the direction of all incident particles is parallel to the central axis throughout the beam, the total dose deposited by a monoenergetic beam irradiating a homogeneous medium can be expressed as a convolution operation:
Z
DðrÞ ¼ Tðr0ÞAðr r0Þdr0
where A(r r0) is the dose spread kernel that describes the mean fraction of energy deposited per unit volume at r per photon interaction at r0, and T(r0) is the total energy released by primary X-ray interactions per unit mass, or TERMA. The above formula forms the basis for point kernel-based modes. Although the formulation of the point kernel model is simple and appealing, the demand on computer time is enormous due to the need for modeling various second-order beam characteristics. As emphasized by Ahnesjo and Aspradakis (27), there are three major issues that must be addressed for accurate dose calculation: broad primary beam spectral, beam divergence, and tissue density inhomogeneity. After all these factors are considered, the convolution–superposition dose calculation becomes a computationally intensive task. Therefore, their clinical implementation is tied closely to the availability of fast computers. The use of fast transform convolution techniques, such as the fast Fourier transform (FFT) method, to carry out the discrete convolution greatly facilitate the calculation process. Another widely accepted approach is the so-called collapsed cone convolution (26) based on an angular discretization of the kernel.
The pencil beam method is essentially a hybrid algorithm that fully accounts for beam modulations and field shapes, but relies on broad beam scaling/correction methods to handle heterogeneities and patient contour changes (18,27). The poly-energetic pencil beams are generally compiled from a linear combination of monoenergetic pencil beams within the constraints of a spectrum model to reproduce a set of depth-doses. The pencil beam kernels can also be determined by direct Monte Carlo calculation, or derived experimentally based on scatter factor differentiation.
Monte Carlo Method
Monte Carlo is a statistical simulation method that simulates the tracks of individual particles and all subsequently generated particles as they traverse the medium (28–30). The method takes into account all the relevant interactions and physical processes that take place in the medium. For each particle, the probability and types of interaction at a
460 RADIATION DOSE PLANNING, COMPUTER-AIDED
point, its path length, and its direction are sampled from probability distributions governing the individual physical processes using machine-generated pseudo-random numbers. These particles and all the daughter products are followed until they either are fully absorbed or escape from the region of interest. Dose distribution and other macroscopic quantities can be calculated by simulating a large number of particle histories. Provided that the physical models used in the simulation are accurate, Monte Carlo simulation can accurately predict radiation dose distribution as it simulates particle transport and energy deposition from first principles. In particular, Monte Carlo simulation can calculate dose in regions of charged particle disequilibrium more accurately than any other existing dose calculation algorithms. For a detailed discussion on the Monte Carlo method in radiotherapy dose calculation, see the chapter on ‘‘Radiation therapy treatment planning, Monte Carlo calculations’’.
An intrinsic limitation of the Monte Carlo method is that
the results contain statistical noise. The statistical error of p
Monte Carlo calculation is proportional to 1= N, where N is the number of simulated particle histories. To obtain dose distributions with acceptably small statistical uncertainty, a large number of particle histories need to be simulated, which makes the Monte Carlo method computationally intensive. The prohibitively long computation time has been the main obstacle for its routine clinical application. However, the computer speed has been increasing exponentially (Moore’s law) since the initial application of the Monte Carlo method in medical physics in the 1970s and this trend is expected to continue. With the rapid increase in computer speed and the development of innovative variance reduction techniques (31), Monte Carlo simulation is fast becoming the next generation dose calculation engine for radiation treatment planning of photon and electron beams. The first commercial TPS that employs Monte Carlo dose calculation engine has already been released (PEREGRINE, North American Scientific) with dose calculation time on the order of minutes on two 2.4 GHz Pentium Xeon processors with a grid size of 0.5 0.5 0.5 cm3. The clinical impact of using Monte Carlo dose calculations is a subject of considerable interest and needs to be evaluated carefully (32).
TREATMENT PLAN OPTIMIZATION
Many treatment-planning parameters affect the quality of a treatment plan. In conventional 3D conformal radiotherapy (3DCRT), the treatment parameters that are at the treatment planner’s disposal include the beam modality and energy, number of beams, beam and treatment couch angles, wedge angles and orientations, radiation-defining blocks, and the weights of each beam. Since the number of beams used in 3DCRT is usually small (3 5), clinically satisfactory plans can be produced manually in a trial-and- error fashion. Diseaseand site-specific treatment techniques developed over the decades help to reduce the number of adjustable parameters significantly. With the development and clinical implementation of intensity-modulated
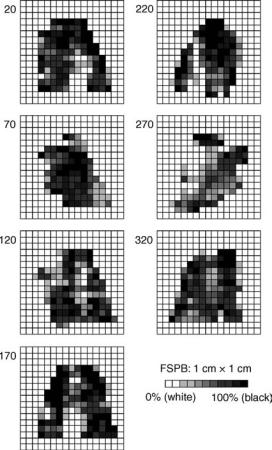
Figure 6. Fluence patterns of a seven-beam IMRT treatment plan of a head-and-neck case from a commercial inverse planning system (CORVUS 5.0, North American Scientific).
radiation therapy (IMRT), where the fluence of each radiation beam can be modulated arbitrarily in order to achieve a highly conformal radiation dose distribution, manual planning is not practical, and computer optimization algorithms have to be used to design complicated beam fluences (33). Figure 6 shows the fluence maps of a seven-beam IMRT plan from a commercial inverse planning system used for the treatment of a head and neck tumor. Each beam is divided into a grid of 1 1 cm beamlets, and each beamlet can take a fixed number of fluence levels. Such fluence modulation can be achieved with a computer-controlled multileaf collimator (MLC). The treatment planning process where the desired goals (the output) (e.g., the desired dose distribution and dose and/or dose–volume constraints, are specified first, and computer optimization is used to determine the needed beam fluences (the input) is sometimes termed inverse planning.
As with any mathematical optimization problems, inverse planning starts with the construction of an objective function. The objective function, with its value the sole measure of the quality of a plan, guides the optimization algorithm. Additional constraints can also be imposed which limit the solution space. The compromise between

delivering a high dose to the target while limiting the dose to critical structures is implicitly built into the objective function. One of the simplest forms of the objective function that has been used often is the weighted least-squares function, which can be expressed as
Fobj ¼ N1 XN rs½dðnÞ d0ðnÞ&2
n¼1
where d0(n) and d(n) are the prescribed and calculated dose distributions, respectively, n is the voxel index, N is the total number of voxels, and rs is the relative importance factor of structure s, which controls the tradeoffs between different structures. The calculated dose to voxel n can be obtained from the weighted sum of all the beamlets as
XI XJðiÞ
dðnÞ ¼ wi jDi jðnÞ
i¼1 j¼1
where I is the total number of beams, J(i) is the total number of beamlets of the ith beam, Dij(n) is the relative dose contribution from the jth beamlet of the ith beam to voxel n, and wij is the weight of the beamlet (i, j). The parameter Dij(n) can be precalculated, so minimization of Fobj with respect to wij produces an optimal plan in the least-squares sense. The choice of the size of the dose calculation grid is an important consideration in IMRT plan optimization. While larger grid sizes reduce the model size and can speed up the computation considerably, too large a grid size will introduce aliasing artifacts. An information theory-based Fourier analysis of a 1 1 cm 6 MV photon beamlet from a medical linac predicted that an isotropic dose grid with < 2.5 mm spacing is sufficient to prevent dose errors larger than a percent (34). The tradeoffs between target coverage and critical structure sparing, which is controlled by the weighting factors rs, are usually not known a priori, and iterative adjustments are required to tailor the treatment plan to each particular circumstance. Algorithms aiming to automate the selection of the weighting factors have been proposed, which promises to significantly reduce the labor-intensive effort of the trial-and-error determination of the factors. In addition, the concept of intravoxel tradeoff has been introduced and an effective approach to model the tradeoff based on voxel specific weighting factors has been proposed (35,36). To obtain an adequate set of local weighting factors with a manageable amount of computing time, algorithms based on a priori dosimetric capability information and a posteriori adaptive algorithms were developed. With the introduction of intravoxel tradeoff, the IMRT dose distribution has been remarkably improved in comparison with the conventional plan obtained with structurally uniform weighting factors.
Clinical implementations of IMRT are dominated by doseand/or dose–volume-based objective functions. Other forms of objective functions, particularly those employing biological indexes, such as the tumor control probability (TCP), normal tissue complication probability (NTCP), and equivalent uniform dose (EUD) (37,38), have also been
RADIATION DOSE PLANNING, COMPUTER-AIDED |
461 |
applied to IMRT plan optimization. The use of biological indexes is especially appealing, as these are the ultimate measures of treatment outcomes. However, there is a lack of clinical and biological data to support these models, and their clinical use at present is not warranted. For example, current TCP models do not contain spatial information, and a cold spot would have the same adverse effect on the TCP irrespective of its location. In reality, the treatment outcome very much depends on the location of the cold spot, that is, whether it is in the periphery or in the middle of the target. Moreover, the TCP-, NTCP-, and EUD-based biological models as they are currently implemented are equivalent to voxel dose-based physical models in a multicriteria framework (39). It is expected that as radiation biology research leads to more robust models, biological based models will become more widely adopted in radiation therapy treatment plan optimization.
A practical approach to bridge the gap between biologically insensible physics-based formalism and a clinically impractical biology-based model is to establish a clinical outcome driven objective function by seamlessly incorporating a clinical endpoint to guide the treatment plan optimization process. Indeed, currently available dose-based objective functions do not truly reflect the nonlinear relationship between the dose and the response of tumors and tissues. On the other hand, biologically based inverse planning involves the use of a number of model parameters whose values are not accurately known and entails a prescription in terms of biological indexes. Recently, Yang and Xing proposed an effective method for formalizing the existing clinical knowledge and integrating clinical endpoint data into inverse planning (40). In their approach, the dose–volume status of a structure was characterized by using the effective volume in the voxel domain. A new objective function was constructed with incorporation of the volumetric information of the system so that the figure of merit of a given IMRT plan depends not only on the dose deviation from the desired dose distribution, but also the dose–volume status of the involved organs. The incorporation of clinical knowledge allows us to obtain better IMRT plans that would otherwise be unattainable.
The considerable interest in developing faster and more robust IMRT optimization algorithms has led to research collaboration between the radiation oncology community and the operations research (OR) community (41). The OR community has long investigated various optimization technologies and has the expertise in addressing large scale, complex optimization problems [see, e.g., the excellent textbooks of Winston (42) and Chong and Zak (43)]. Such collaboration is expected to enhance the IMRT model and algorithm development tremendously due to the large sizes of the problems in IMRT optimization combined with the clinical need to quickly solve each optimization for interactive plan review. For example, to avoid the nonconvex nature of conventional dose–volume constraints (44), Romeijn et al. introduced novel, convex dose–volume constraints that allowed them to formulate the IMRT fluence map optimization as a linear programming (LP) model (45). Using an industrial LP solver (CPLEX 8, ILOG

462 RADIATION DOSE PLANNING, COMPUTER-AIDED
Inc.), a seven-field head-and-neck case with 190,000 constraints, 221,000 variables, and 1,100,000 nonzero elements in the constraint matrix has been solved to global optimality in 2 min of computation time on a 2.5 GHz Pentium 4 personal computer with 1 GB of RAM. While fluence map optimization has been studied extensively and clinically implemented, other challenging problems, such as finding the optimal number of beams and their angles, and fluence map optimization in the presence of organ motion, have not been solved satisfactorily. The problem of beam angle optimization has an enormous search space (46). The goodness of a chosen set of beam angles is not known until the fluence map optimization is performed. Current computer technology is not fast enough to solve such a nested optimization problem for routine clinical use. It is hoped that the collaboration with the OR community would help to develop novel and efficient algorithms in radiotherapy plan optimization.
DOSE DISPLAY AND PLAN EVALUATION
Treatment plans are evaluated based on the dose coverage and dose uniformity of the target, dose- to-sensitive normal structures, and magnitudes and locations of any hot and cold spots. This is best served by displaying the dose as isodose lines and superimposing them on the corresponding 2D image. Images can be displayed in the axial, sagittal, or coronal planes with the targets and normal structures delineated and dose distribution can be evaluated by going through the entire irradiated volume slice by slice. Figure 7 shows the isodose distribution of a head-and- neck IMRT plan in the three orthogonal planes overlaid on the corresponding CT images. Other graphic visualization tools, such as displaying the isodose in 3D as an iso-surface (47), have also been developed.
For quantitative plan evaluation, dose statistics can be calculated from the 3D dose distribution. Mean, maximum and minimum doses to the targets and mean and maximum doses to the critical structures can aid in plan selection. Dose uniformity throughout the target volume can be assessed from the standard deviations of the target dose
Figure 7. Overlay of isodose lines on an axial, coronal, and sagittal planes of a head-and-neck cancer. The IMRT plan was generated using a commercial inverse treatment planning system (CORVUS 5.0, North American Scientific). The isodose lines are, from inside out, at dose levels of 76, 72, 49.5, 40, 30, 20, and 10 Gy. The gross tumor volume (red) and the subclinical target volume (yellow) are shown as color washes to help evaluate the quality of the plan.
distribution. A conformity index, defined as the quotient of the treated volume and the planning target volume (PTV) when the treated volume totally encompasses the PTV, has been introduced (48) to quantitatively evaluate the amount of normal tissue treated. Biological model-based TCP and NTCP are now available on some commercial TPS. However, the large uncertainty in the biological models combined with the lack of clinical experience limit their application in current clinical practice.
A very useful tool in 3D plan evaluation is the calculation of cumulative dose–volume histograms (DVHs) (49). The DVHs summarize 3D dose-distribution data into 2D histograms and are helpful in rapid screening of rival plans. An example of the DVHs of various structures of a head-and-neck IMRT plan is shown in Fig. 8. The DVH of a structure is calculated as
P
vðdÞ
%VðDÞ ¼
d D
V0
where v(d) is the volume of a voxel in the structure receiving dose d and V0 is the total volume of the structure. Therefore, each point %V(D) on a DVH curve represents the percent volume of the structure receiving doses D. From the DVH, dose coverage and dose uniformity of the target(s) can easily be appreciated. The relevant dosimetric parameter to some critical structures that display serial nature such as the spinal cord and the brain stem is the maximum dose (48) and it can be read directly from the DVH. The functionality of many normal structures displays a dose–volume effect (50). For example, in trying to preserve salivary function for head-and-neck patients using IMRT, planning criteria of at least 50% volume of either parotid gland receiving doses < 30 Gy have been established (51,52). The development of Grade 2 pneumonitis in patients after radiation treatment for non-small cell lung cancer was found to be significantly correlated
|
100 |
|
|
|
|
|
|
|
|
|
|
SMGs |
|
PTV 54+18 |
|
||
|
80 |
|
|
|
|
|
||
(%) |
|
|
|
|
|
|
|
|
|
|
|
|
|
PTV 49.5 |
|
||
Volume |
60 |
|
|
|
|
|
|
|
|
|
Spinal Cord |
|
|
|
|||
|
|
|
|
|
|
|||
|
40 |
|
|
|
|
|
|
|
|
Parotids |
|
|
|
|
|
|
|
|
20 |
|
|
|
|
|
|
|
|
10 |
20 |
30 |
40 |
50 |
60 |
70 |
80 |
|
|
|
|
Dose(GY) |
|
|
|
|
Figure 8. Cumulative DVH of different structures of a head-and- neck IMRT treatment plan. The prescribed doses to the targets are 72 Gy for the gross tumor volume (labeled ‘‘PTV 54 þ 18’’) and 49.5 Gy for the subclinical target volume (labeled ‘‘PTV 49.5’’). Also shown are the DVHs of the left and right parotids, the left and right submandibular glands (SMGs), and the spinal cord.
with the percent volume of the total lung exceeding 20 Gy (53). These dose–volume relations can be obtained directly from the DVH. Dose–volume histograms from two or more competing plans can also be overlaid on top of each other to facilitate plan comparison. The increasing use of DVHs in routine clinical treatment planning over the past decade is a direct result of increased computer power and fast and more accurate dose calculation algorithms which make dose calculation in the entire irradiated volume possible.
The DVH should be used with caution. Since a DVH is a 2D histogram of a 3D dose distribution, it does not provide any spatial information. For example, Fig. 8 indicates that2% of the volume of the target labeled ‘‘PTV 49.5’’ did not receive the prescribed dose of 49.5 Gy. However, the locations of the underdosed volume is unknown. While underdosed areas near the periphery of the PTV may be acceptable, they are clearly unacceptable in the middle of the PTV where the gross tumor volume is located. Thus, DVHs must replace isodose distributions. Rather, it is a tool to enhance our ability to choose between different plans. This is especially true when evaluating IMRT plans, as the dose distributions of IMRT plans are spatially independent (54,55). A good DVH is therefore a necessary but not sufficient condition for a clinically acceptable treatment plan.
SUMMARY
In the first edition of this Encyclopedia > 17 years ago (1), Dr. Radhe Mohan envisioned that rapid developments in computer technology would make CT-based 3D treatment planning, including visualization of the anatomic structures and target region in 3D, fast and accurate radiation dose calculation in the entire irradiated volume, and sophisticated graphic and analytic tools for treatment plan display and evaluation, clinically routine. Radiation therapy has certainly gone through a series of revolutionary changes over the past 17 years. Three-dimensional treatment planning is now a standard practice and has mostly replaced 2D treatment planning. Monte Carlo dose calculation, which used to be considered as a luxury research tool, is now being incorporated into treatment planning systems. The fast development and widespread clinical implementation of IMRT over the past decade have provided the radiation oncology discipline a powerful tool to deliver highly conformal doses to the tumor volume while improving sensitive structure sparing. We are just entering an era of image-guided radiation therapy with exciting new developments. Recently, these have spurred efforts toward implementation of time-resolved or 4D imaging techniques, such as 4D CT (56–58) and 4D PET (59), into radiation oncology treatment planning and delivery. Currently, 4D imaging information is mainly being used as a tool for better definition of patient specific margins in the treatment of tumors in the thorax and upper abdomen. The ultimate goal is to establish a new scheme of 4D radiation therapy, where the 4D patient model is used to guide 4D planning and treatment. While there is still a long way to go toward this goal, much
RADIATION DOSE PLANNING, COMPUTER-AIDED |
463 |
progress has been made, especially in the area of 4D inverse planning. Another important area that is under intense investigation is biologically conformal radiation therapy (BCRT) (60–62). Different from the current radiation therapy, which is aimed at producing a homogeneous target dose under the assumption of uniform biology within the target volume, BCRT takes the inhomogeneous biological information into account and produces customized non-uniform dose distributions on a patient specific basis. There are a number of challenges to accomplish the new radiation treatment paradigm, such as the determination of the distribution of biological properties of the tumor and critical structures, the prescription of the desired dose distribution for inverse planning, and the technique for inverse planning to generate most faithfully the prescribed nonuniform dose distribution. The most fundamental issue is, perhaps, how to extract the fundamental biological distribution for a given patient with biological imaging techniques and how to link the imaging information to the radiation dose distribution to maximize tumor cell killing. Hopefully, with the multidisciplinary efforts, the issues related to molecular imaging, image quantitation, planning, and clinical decision making would be resolved in the next decade. This will lead to truly individualized radiation therapy, and eventually individualized medicine when combined with the efforts in molecular medicine.
ACKNOWLEDGMENTS
JGL would like to thank Debbie Louis, CMD, for useful discussions and LX wishes to acknowledge support from the Department of Defense (PC040282) and the National Cancer Institute (5R01 CA98523-01).
BIBLIOGRAPHY
1.Mohan R. Radiation dose planning, computer-aided. In: Webster JG, editor. Encyclopedia of Medical Devices and Instrumentation. New York: John Wiley & Sons, Inc.; 1988. p 2397– 2407.
2.Sherouse GW, Novins K, Chaney EL. Computation of digitally reconstructed radiographs for use in radiotherapy treatment design. Int J Radiat Oncol Biol Phys 1990;18:651–658.
3.Siddon RL. Prism representation: a 3D ray-tracing algorithm for radiotherapy applications. Phys Med Biol 1985;30:817– 824.
4.Siddon RL. Fast calculation of the exact radiological path for a three-dimensional CT array. Med Phys 1985;12:252–255.
5.Hill DLG, et al. Medical image registration. Phys Med Biol 2001;46:R1–R45.
6.Wang H, et al. Implementation and validation of a three-dimen- sional deformable registration algorithm for targeted prostate cancer radiotherapy. Int J Radiat Oncol Biol Phys 2005;61:725– 735.
7.Wu X, Dibiase SJ, Gullapalli R, Yu CX. Deformable image registration for the use of magnetic resonance spectroscopy in prostate treatment planning. Int J Radiat Oncol Biol Phys 2004;58:1577–1583.
8.Lu W, et al. Fast free-form deformable registration via calculus of variations. Phys Med Biol 2004;49:3067–3087.
464 RADIATION DOSE PLANNING, COMPUTER-AIDED
9.Ding M, et al. Dose correlation for thoracic motion in radiation therapy of breast cancer. Med Phys 2003;30:2520–2529.
10.Beyer T, et al. A combined PET/CT scanner for clinical oncology. J Nucl Med 2000;41:1369–1379.
11.Schoder H, et al. PET/CT: a new imaging technology in nuclear medicine. Eur J Nucl Med Mol Imaging 2003;30:1419–1437.
12.Esthappan J, et al. Treatment planning guidelines regarding the use of CT/PET-guided IMRT for cervical carcinoma with positive paraaortic lymph nodes. Int J Radiat Oncol Biol Phys 2004;58:1289–1297.
13.van Der Wel A, et al. Increased therapeutic ratio by 18FDGPET CT planning in patients with clinical CT stage N2-N3M0 non-small-cell lung cancer: a modeling study. Int J Radiat Oncol Biol Phys 2005;61:649–655.
14.MacManus MP, et al. F-18fluorodeoxyglucosepositron emission tomography staging in radical radiotherapy candidates with nonsmallcelllungcarcinoma:powerfulcorrelation with survival and high impact on treatment. Cancer 2001;92:886–895.
15.Sontag MR, Cunningham JR. The equivalent tissue-air ratio method for making absorbed dose calculations in a heterogeneous medium. Radiology 1978;129:787–794.
16.Wong JW, Purdy JA. On methods of inhomogeneity corrections for photon transport. Med Phys 1990;17:807–814.
17.Clarkson JR. A note on depth doses in fields of irregular shape. Br J Radiol 1941;14:265–268.
18.Bourland JD, Chaney EL. A finite-size pencil beam model for photon dose calculations in three dimensions. Med Phys 1992;19:1401–1412.
19.Johns HE, Cunningham JR. The physics of radiology, 4th ed. Springfield (IL): Charles C. Thomas; 1983.
20.Khan FM. The physics of radiation therapy, 3rd ed. Philadelphia: Lippincott Williams & Wilkins; 2003.
21.Kung JH, Chen GT, Kuchnir FK. A monitor unit verification calculation in intensity modulated radiotherapy as a dosimetry quality assurance. Med Phys 2000;27:2226–2230.
22.Xing L, et al. Monitor unit calculation for an intensity modulated photon field by a simple scatter-summation algorithm. Phys Med Biol 2000;45:N1–N7.
23.Mackie TR, Scrimger JW, Battista JJ. A convolution method of calculating dose for 15 MV X-rays. Med Phys 1985;12:188–196.
24.Boyer AL, Mok EC. A photon dose distribution employing convolution calculations. Med Phys 1985;12:169–177.
25.Mackie TR, et al. Generation of photon energy deposition kernels using the EGS Monte Carlo code. Phys Med Biol 1988;33:1–20.
26.Ahnesjo A. Collapsed cone convolution of radiant energy for photon dose calculation in heterogeneous media. Med Phys 1989;16:577–592.
27.Ahnesjo A, Aspradakis MM. Dose calculations for external photon beamsin radiotherapy.Phys MedBiol1999;44:R99–R155.
28.Nelson WR, Hirayama H, Rogers DWO. The EGS4 code system. Stanford Linear Accelerator Center Report 1985; SLAC-265.
29.Ma C-M, Jiang SB. Monte Carlo modeling of electron beams from medical accelerators. Phys Med Biol 1999;44:R157–R189.
30.Verhaegen F, Seuntjens J. Monte Carlo modeling of external radiotherapy photon beams. Phys Med Biol 2003;48:R107– R164.
31.Bielajew AF, Rogers DWO. Variance Reduction Techniques. In: Jenkins TM, Nelson WR, Rindi A, editors. Monte Carlo Transport of Electrons and Photons. New York: Plenum; 1988. p 407–419.
32.Boudreau C, et al. IMRT head and neck treatment planning with a commercially available Monte Carlo based planning system. Phys Med Biol 2005;50:879–890.
33.Shepard DM, Ferris MC, Olivera GH, Mackie TR. Optimizing the delivery of radiation therapy to cancer patients. SIAM Rev 1999;41:721–744.
34.Dempsey JF, et al. A Fourier analysis of the dose grid resolution required for accurate IMRT fluence map optimization. Med Phys 2005;32:380–388.
35.Yang Y, Xing L. Inverse treatment planning with adaptively evolving voxel-dependent penalty scheme. Med Phys 2004;31: 2839–2844.
36.Shou Z, et al. Quantitation of the a priori dosimetric capabilities of spatial points in inverse planning and its significant implication in defining IMRT solution space. Phys Med Biol 2005;50:1469–1482.
37.Wu QW, Mohan R, Niemierko A, Schmidt-Ullrich R. Optimization of intensity-modulated radiotherapy plans based on the equivalent uniform dose. Int J Radiat Oncol Biol Phys 2002;52:224–235.
38.Thieke C, Bortfeld T, Niemierko A, Nill S. From physical dose constraints to equivalent uniform dose constraints in inverse radiotherapy planning. Med Phys 2002;30:2332–2339.
39.Romeijn HE, Dempsey JF, Li JG. A unifying framework for multi-criteria fluence map optimization models. Phys Med Biol 2004;49:1991–2013.
40.Yang Y, Xing L. Clinical knowledge-based inverse treatment planning. Phys Med Biol 2004;49:5101–5117.
41.Langer M, et al. Operations research applied to radiotherapy, an NCI-NSF-sponsored workshop—February 7–9, 2002. Int J Radiat Oncol Biol Phys 2003;57:762–768.
42.Winston WL. Operations Research: Applications and Algorithms, 4th ed. Belmont: Thomson Learning; 2004.
43.Chong EKP, Zak SH. An Introduction to Optimization, 2nd ed. New York: John Wiley & Sons, Inc.; 2001.
44.Deasy JO. Multiple local minima in radiotherapy optimization problems with dose-volume constraints. Med Phys 1997;24: 1157–1161.
45.Romeijn HE, et al. A novel linear programming approach to fluence map optimization for intensity modulated radiation therapy treatment planning. Phys Med Biol 2003;48:3521– 3542.
46.Stein J, et al. Number and orientations of beams in intensitymodulated radiation treatments. Med Phys 1997;24:149–160.
47.Schreibmann E, Theodorou K, Kappas C, Xing L. A software package for dose visualization in IMRT. XIVth Int Conf Comp Radiat Thera 2004; 700–703.
48.International Commission on Radiation Units and Measurements, Prescribing, recording and reporting photon beam therapy (Supplement to ICRU report 50), ICRU report 62, Bethesda (MD); 1999.
49.Drzymala RE, et al. Dose-volume histograms. Int J Radiat Oncol Biol Phys 1991;21:71–78.
50.Emami B, et al. Tolerance of normal tissue to therapeutic irradiation. Int J Radiat Oncol Biol Phys 1991;21:109–122.
51.Eisbruch A, Chao KSC, Garden A. Phase I/II study of conformal and intensity modulated irradiation for oropharyngeal cancer. Radiation Therapy Oncology Group protocol 0022, 2001.
52.Lee N, Garden A, Kramer A, Xia P. A phase II study of intensity modulated radiation therapy (IMRT) þ/ chemotherapy for nasopharyngeal cancer. Radiation Therapy Oncology Group protocol 0225, 2003.
53.Graham MV, et al. Clinical dose-volume histogram analysis for pneumonitis after 3D treatment for non-small cell lung cancer (NSCLC). Int J Radiat Oncol Biol Phys 1999;45:323–329.
54.Xing L, Li JG. Computer verification of fluence map for intensity modulated radiation therapy. Med Phys 2000;27: 2084–2092.
55.Chao KSC, Blanco AI, Dempsey JF. A conceptual model integrating spatial information to assess target volume coverage for IMRT treatment planning. Int J Radiat Oncol Biol Phys 2003;56:1438–1449.