

- •VOLUME 5
- •CONTRIBUTOR LIST
- •PREFACE
- •LIST OF ARTICLES
- •ABBREVIATIONS AND ACRONYMS
- •CONVERSION FACTORS AND UNIT SYMBOLS
- •NANOPARTICLES
- •NEONATAL MONITORING
- •NERVE CONDUCTION STUDIES.
- •NEUROLOGICAL MONITORS
- •NEUROMUSCULAR STIMULATION.
- •NEUTRON ACTIVATION ANALYSIS
- •NEUTRON BEAM THERAPY
- •NEUROSTIMULATION.
- •NONIONIZING RADIATION, BIOLOGICAL EFFECTS OF
- •NUCLEAR MAGNETIC RESONANCE SPECTROSCOPY
- •NUCLEAR MEDICINE INSTRUMENTATION
- •NUCLEAR MEDICINE, COMPUTERS IN
- •NUTRITION, PARENTERAL
- •NYSTAGMOGRAPHY.
- •OCULAR FUNDUS REFLECTOMETRY
- •OCULAR MOTILITY RECORDING AND NYSTAGMUS
- •OCULOGRAPHY.
- •OFFICE AUTOMATION SYSTEMS
- •OPTICAL FIBERS IN MEDICINE.
- •OPTICAL SENSORS
- •OPTICAL TWEEZERS
- •ORAL CONTRACEPTIVES.
- •ORTHOPEDIC DEVICES MATERIALS AND DESIGN OF
- •ORTHOPEDICS PROSTHESIS FIXATION FOR
- •ORTHOTICS.
- •OSTEOPOROSIS.
- •OVULATION, DETECTION OF.
- •OXYGEN ANALYZERS
- •OXYGEN SENSORS
- •OXYGEN TOXICITY.
- •PACEMAKERS
- •PAIN SYNDROMES.
- •PANCREAS, ARTIFICIAL
- •PARENTERAL NUTRITION.
- •PERINATAL MONITORING.
- •PERIPHERAL VASCULAR NONINVASIVE MEASUREMENTS
- •PET SCAN.
- •PHANTOM MATERIALS IN RADIOLOGY
- •PHARMACOKINETICS AND PHARMACODYNAMICS
- •PHONOCARDIOGRAPHY
- •PHOTOTHERAPY.
- •PHOTOGRAPHY, MEDICAL
- •PHYSIOLOGICAL SYSTEMS MODELING
- •PICTURE ARCHIVING AND COMMUNICATION SYSTEMS
- •PIEZOELECTRIC SENSORS
- •PLETHYSMOGRAPHY.
- •PNEUMATIC ANTISHOCK GARMENT.
- •PNEUMOTACHOMETERS
- •POLYMERASE CHAIN REACTION
- •POLYMERIC MATERIALS
- •POLYMERS.
- •PRODUCT LIABILITY.
- •PROSTHESES, VISUAL.
- •PROSTHESIS FIXATION, ORTHOPEDIC.
- •POROUS MATERIALS FOR BIOLOGICAL APPLICATIONS
- •POSITRON EMISSION TOMOGRAPHY
- •PROSTATE SEED IMPLANTS
- •PTCA.
- •PULMONARY MECHANICS.
- •PULMONARY PHYSIOLOGY
- •PUMPS, INFUSION.
- •QUALITY CONTROL, X-RAY.
- •QUALITY-OF-LIFE MEASURES, CLINICAL SIGNIFICANCE OF
- •RADIATION DETECTORS.
- •RADIATION DOSIMETRY FOR ONCOLOGY
- •RADIATION DOSIMETRY, THREE-DIMENSIONAL
- •RADIATION, EFFECTS OF.
- •RADIATION PROTECTION INSTRUMENTATION
- •RADIATION THERAPY, INTENSITY MODULATED
- •RADIATION THERAPY SIMULATOR
- •RADIATION THERAPY TREATMENT PLANNING, MONTE CARLO CALCULATIONS IN
- •RADIATION THERAPY, QUALITY ASSURANCE IN
- •RADIATION, ULTRAVIOLET.
- •RADIOACTIVE DECAY.
- •RADIOACTIVE SEED IMPLANTATION.
- •RADIOIMMUNODETECTION.
- •RADIOISOTOPE IMAGING EQUIPMENT.
- •RADIOLOGY INFORMATION SYSTEMS
- •RADIOLOGY, PHANTOM MATERIALS.
- •RADIOMETRY.
- •RADIONUCLIDE PRODUCTION AND RADIOACTIVE DECAY
- •RADIOPHARMACEUTICAL DOSIMETRY
- •RADIOSURGERY, STEREOTACTIC
- •RADIOTHERAPY ACCESSORIES
182.Cuellar A, et al. CellML specification. Available at http:// www.cellml.org/public/specification/index.html. 2005.
183.Kuznetz LH. A two-dimensional transient mathematical model of human thermoregulation. Am J Physiol 1979;237(6):266–277.
184.Downey D, Seagrave RC. Mathematical modeling of the human body during water replacement and dehydration: Body water changes. Ann Biomed Eng 2000;28:278–290.
185.Fiala D, Lomas KJ, Stohrer M. A computer model of human thermoregulation for a wide range of environmental conditions: The passive system. J Appl Physiol 1999;87:1957–1972.
186.Fiala D, Lomas KJ, Stohrer M. Computer prediction of human thermoregulatory and temperature responses to a wide range of environmental conditions. Int J Biometeorol 2001;45:143–159.
187.Boregowda SC. Thermodynamic modeling and analysis of human stress responses Mechanical Engineering. Old Dominion University; 1998. p 175.
188.Gardner GG, Martin CJ. The mathematical modelling of thermal responses of normal subjects and burned patients. Physiol Meas 1994;15:381–400.
189.Quinn ML, et al. The case for designer animals: (use of simulation to reduce animal studies). Anesthesiology 1987;67(3):A215.
190.Martin JF, et al. A new cardiovascular model for real-time applications. Trans-Soc Computer Simulation 1986;3:31–65.
191.Slate JB. Model-based design of a controller for infusing sodium nitroprusside during postsurgical hypertension. Electrical Engineering. Madison (WI): University of Wisconsin; 1980.
192.Wesseling KH, A baroreflex paradox solution. Utrecht: TNO; 1982. pp. 152–164.
193.Kjaergaard S, et al. Non-invasive estimation of shunt and ventilation-perfusion mismatch. Intensive Care Med 2003;29:727–734.
194.Mesic S, et al. Computer-controlled mechanical simulation of the artificially ventilated human respiratory system. IEEE Trans Biomed Eng 2003;50(6):731–743.
195.Smith NT, Wesseling KH, De Wit B. Evaluation of two prototype devices producing noninvasive, pulsatile calibrated blood pressure from a finger. J Clin Monit 1985;1(1):17–29.
196.Wesseling KH, et al. A simple device for the continuous measurement of cardiac output. Adv Cardiovasc Phys 1983;5:16–52.
197.Wesseling KH, et al. Continuous monitoring of cardiac output. Medicamundi 1976;21:78–90.
198.Jansen J, et al. Continuous cardiac output computed from arterial pressure in the operating room. Br J Anaesth 2001;87(2):212–222.
199.Hirschl MM, et al. Noninvasive assessment of cardiac output in critically ill patients by analysis of the finger blood pressure waveform. Crit Care Med 1997;25(11).
200.Wesseling KH, et al. Computation of aortic flow from pressure in humans using a nonlinear, three-element model. J Appl Physiol 1993;74(5):2566–2573.
201.Jansen J, et al. A comparison of cardiac output derived from the arterial pressure wave against thermodilution in cardiac surgery patients. Br J Anaesth 2001;87(3):212–222.
202.Gizdulich P, Prentza A, Wesseling KH. Models of brachial to finger pulse wave distortion and pressure decrement. Cardiovasc Res 1997;33:698–705.
203.Thoman W, et al. A computer model of intracranial dynamics integrated to a full-scale patient simulator. Computers Biomed Res 1998;31:32–46.
204.Thoman W, et al. Autoregulation in a simulator-based educational model of intracranial physiology. J Clin Monit 1999;15:481–491.
PICTURE ARCHIVING AND COMMUNICATION SYSTEMS |
331 |
205.Van Meurs W, Nikkelen E, Good M. Pharmacokineticpharmacodynamic model for educational simulations. IEEE Trans Biomed Eng 1998;45(5):582–590.
206.Euliano T, et al. Modeling obstetric cardiovascular physiology on a full-scale patient simulator. J Clin Monit 1997;13: 293–297.
207.Garfield J, Paskin S, Philip J. An evaluation of the effectiveness of a computer simulation of anaesthetic uptake and distribution as a teaching tool. Medi Educ 1989;23:457–462.
208.Bassingthwaighte JB. Strategies for the physiome project. Ann Biomed Eng 2000;28:1043–1058.
209.Anon., The physiome project. http://nsr.bioeng.washington/ PLN. 2005.
210.Anon., The heart of the matter, in The Economist. Available at http://www.economist.com/science/tq/PrinterFriendly. cfm?Story_ID=885127. 2005. p 6.
211.Sideman S. Preface: Cardiac engineering—deciphering the cardiome, in Cardiac engineering: From genes and cells to structure and function. In: Sideman S, Beyar R, editors. New York: New York Academy of Sciences; 2004.
212.Popel AS, et al. The microcirculation physiome project. Ann Biomed Eng 1998;26:911–913.
213.Tawhai MH, Burrowes KS. Developing integrative computational models of pulmonary structure. The Anatom Rec (P B: New A) 2003;275B:207–218.
214.Tawhai MH, Ben-Tal A. Multiscale modeling for the lung physiome. Cardiovas Eng 2004;4(1).
215.Lonie A. The kidney simulation project. 2005.
216.Crampin EJ, et al. Computational physiology and the physiome project. Exp Physiol 2004;89(1):1–26.
217.Hunter P, Robbins P, Noble D. The IUPS human physiome project. Pflugers Arch - Eur J Physiol 2002;445:1–9.
218.Crampin EJ, et al. Computational physiology and the physiome project. Exp Physiol 2003;89(1):1–26.
219.Hunter PJ, Borg TK. Integration from proteins to organs-the physiome project. Nat Rev: Mol Cell Biol 2003;4:237–243.
220.Anon., The IUPS physiome project. Available at http:// www.physiome.org.nz/anatml/pages/specification.html. 2005.
221.Turing A. The chemical basis of morphogenesis. Philos Trans R Soc (London), Ser A 1952;237:37–72.
222.Weiss JN, Qu Z, Garfinkel X. Understanding biological complexity: Lessons from the past. FASEB J 2003;17.
See also ELECTROCARDIOGRAPHY, COMPUTERS IN; ELECTROPHYSIOLOGY;
PULMONARY PHYSIOLOGY; RADIOTHERAPY TREATMENT PLANNING, OPTIMIZATION OF.
PICTURE ARCHIVING AND COMMUNICATION SYSTEMS
KATHERINE ANDRIOLE P.
Harvard Medical School
Boston, Massachusetts
INTRODUCTION AND HISTORICAL OVERVIEW
A picture archiving and communication system (PACS) is a medical image management system, or a collection of electronic technologies that enable the digital or filmless imaging department. In a PACS, images are acquired, stored, and transmitted or distributed digitally, as well as interpreted digitally using what is known as soft copy display.
332 PICTURE ARCHIVING AND COMMUNICATION SYSTEMS
In the analog world, even images that were created by inherently digital modalities are printed to film for display on a light box or alternator, and for image archival as the legal record where films are stored in large rooms of filed film jackets. Imaging examinations on film must be transported from one location to another by foot for viewing by radiologists and referring clinicians. Films are retrieved and re-archived manually by film library personnel. Using a PACS, images are acquired as digital computer files, stored on computer disks or other digital media, transmitted across computer networks, and viewed and manipulated on computer workstations.
The benefits of PACS are numerous and include rapid and remote data distribution within and between healthcare enterprises. Digital archival is more permanent than film with regard to media degradation as well as the problem of lost films. A PACS gives multiple users in distinct locations simultaneous access to the same imaging examinations. Also, the digital nature of the data allows for image manipulation and processing, which may lead to enhanced visualization of radiological features and improved interpretation of imaging studies. The potential impact of using a PACS can be more expedient care, more efficient workflow, and more cost-effective and higher quality care.
PACS and filmless radiology are a better way to practice imaging in medicine today. The number of images per study has grown beyond what is feasible for viewing on film. Still, today, only about 20% of health-care enterprises have implemented PACS.
Picture archiving and communication systems have come about via a convergence of technological and economic factors. The facilitating technologies responsible include a dramatic improvement in computing power, the advancement of network capabilities and storage devices, the development of imaging standards, and systems integration. In the 1990s, PACS applications challenged computer hardware. Today, PACS applications are only a subset of what computers can do.
Early PACS
In 1979, the earliest paper proposing the concept of a PACS was published by Heinz U. Lemke, Ph.D., entitled ‘‘Applications of Picture Processing, Image Analysis and Computer Graphics Techniques to Cranial CT Scans’’ (1). In the early 1970s, M. Paul Capp, M.D., Sol Nudelman, Ph.D., and colleagues at the University of Arizona Health Sciences Center organized a digital imaging group that developed the first digital subtraction angiography (DSA) device that was the precursor to clinical digital imaging. They introduced the notion of a ‘‘photoelectronic radiology department’’ and depicted a system block diagram of the demonstration facility they had built (2).
Samuel J. Dwyer, III, Ph.D. predicted the cost of managing digital diagnostic images in a radiology department
(3) and, along with Andre Duerinckx, M.D., Ph.D., organized a landmark conference at which the acronym PACS was coined (4). This meeting, sponsored by the International Society for Photo-Optical Engineering (SPIE), titled ‘‘The First International Conference and Workshop on
Picture Archiving and Communications Systems (PACS) for Medical Applications,’’ was held in Newport Beach, CA, January 18–21, 1982, and continues today as the Annual SPIE International Symposium on Medical Imaging. Two panel discussions ‘‘Equipment Manufacturers’ View on PACS’’ and ‘‘The Medical Community’s View on PACS’’ that took place at the first PACS conference were captured in the proceedings (4). Talk occurred of linking imaging modalities into a single digital imaging network and the recognition that, in order for this linking to be practical, standards would be required. Steven C. Horii, M.D., participated in those beginning discussions and has been instrumental in bringing about the creation and implementation of a standard for digital medical imaging, now known as the Digital Imaging and Communications in Medicine or DICOM Standard.
A number of PACS pioneers have contributed to the advancement of digital medical imaging to its current status through efforts in research and development, design, implementation, testing, analysis, standards creation, and education of the technical and medical communities. In 1982–1983, Dwyer oversaw the building of what is often considered the first PACS. In 1983, the first of numerous papers was presented by H. K. Bernie Huang, D.Sc., FRCR, detailing the PACS efforts at the University of California at Los Angeles, which culminated years later in a clinically operational filmless radiology department
(5). G. James Blaine, D.SC., and R. Gilbert Jost, M.D., at the Washington University School of Medicine, focused their efforts on the development of utilities enabling PACS research and development (6). In the midto late-1980s, several researchers described their prototype PACS hardware and software efforts (7–10).
Similar activities were taking place in Europe and Asia. Hruby opened a completely digital radiology department in the Danube Hospital in Vienna in 1990, setting the tone for the future (11). Several academic radiology departments in the United States began working with major vendor partners to further the technology and its clinical implementation. Such academic–industry collaborations continue the advancement of PACS today.
Standards
The development of standards in medical imaging is one of the facilitating factors that has enabled PACS to mature and become more widely used. DICOM (Digital Imaging and Communications in Medicine) (12) along with several other integration standards, has been one of the most important accomplishments for PACS. DICOM is a standard that was created to promote an open architecture for imaging systems, allowing interoperability between systems for the transfer of medical images and associated information. As an exchange protocol, it was designed to bridge differing hardware devices and software applications.
With the increasing use of computers in clinical applications, and with the introduction of digital subtraction angiography and computed tomography (CT) in the 1970s, followed by other digital diagnostic imaging modalities, the American College of Radiology (ACR) and the
National Electrical Manufacturers Association (NEMA) recognized the emerging need for a standard method for transferring images and associated information between devices manufactured by the various vendors (12). These devices produced a variety of digital image formats. The push by the radiological community for a standard format across imaging devices of different models and makes began in 1982. ACR and NEMA formed a joint committee in 1983 to develop a standard to promote communication of digital image information, regardless of device manufacturer. It was felt that this committee would facilitate the development and expansion of picture archiving and communication systems that could also interface with other hospital information systems and allow the creation of diagnostic information databases that could be interrogated by a wide variety of geographically distributed devices.
The ACR-NEMA Standard version 1.0 was published in 1985. Two revisions followed, one in October 1986 and the second in January 1988 as version 2.0. It included version 1.0, the published revisions, and additional revisions. ACRNEMA 2.0 consisted of a file header followed by the image data. The file header contained information relevant to the image, such as matrix size or number of rows and columns, pixel size, gray-scale bit depth, and so on, as well as information about the imaging device and technique (i.e., Brand X CT scanner, acquired with contrast). Patient demographic data, such as name and date of birth, were also included in the image header. The ACR-NEMA 2.0 standard specified exactly where in the header each bit of information was to be stored, such that the standard required image information could be read by any device, simply by going to the designated location in the header. Version 2.0 also included new material to provide command support for display devices, to introduce a new hierarchy scheme to identify an image, and to add data elements for increased specificity when describing an image. These standards publications specified a hardware interface, a minimum set of software commands, and a consistent set of data formats. Data included patient demographic information as well as imaging parameters. This standard unified the format of imaging data but functioned only as a point-to-point procedure, not including a networking communications protocol until later versions.
In 1994, at the Radiological Society of North America (RSNA) Meeting, a variety of imaging vendors participated in an impressive demonstration of the new and evolving imaging standard (ACR-NEMA 3.0). Participants attached their devices to a common network and transmitted their images to one another. In addition to the standard image format of ACR-NEMA 2.0, the DICOM standard included a network communications protocol or a common language for sending and receiving images and relevant data over a network.
Today, this standard, which is currently designated Digital Imaging and Communications in Medicine (DICOM), embodies a number of major enhancements to previous versions of the ACR-NEMA Standard, the first that is applicable to a networked environment. The original ACR-NEMA Standard included a well-defined format for the image data but worked only in point-to-point config-
PICTURE ARCHIVING AND COMMUNICATION SYSTEMS |
333 |
urations. In order to function in a networked environment, a Network Interface Unit (NIU) was required. Operation in a networked environment is supported today using the industry standard networking protocol TCP-IP (transfer communication protocol - Internet protocol). Thus, in addition to the format of the data being exchanged between medical imaging devices, the DICOM Standard also specifies how the devices themselves should communicate using simple commands such as Find, Get, Move, Send, and Store. These commands operate on objects such as images and text, which are formatted in terms of groups and elements. The hierarchy of data is of the form patient, study, series or sequence, and image.
DICOM specifies, through the concept of service classes, the semantics of commands and associated data, and it also specifies levels of conformance. The DICOM standard language structure is built on information objects (IO), application entities (AE), and service class users (SCU) and providers (SCP). Information objects include, for example, the image types, such as CT, MRI, and CR. The application entities include the devices, such as a scanner, workstation, or printer. The service classes (SC*) define an operation on the information object via service object pairs (SOP) of IO and SCU and SCP. The types of operations performed by an SCU-SCP on an IO include storage, query-retrieve, verification, print, study content notification, study content notification and patient, and study and results management. An example DICOM-formatted message is written in terms of a tag (consisting of a group and an element) followed by the length of the tag, followed by the value: 0008,0020-8-20050402 represents group 8, element 20, which corresponds to the study date given as an 8 character field. DICOM is a continuously evolving standard with significant updates yearly.
The information technologies most familiar to radiology departments are PACS and Radiology Information Systems (RIS). PACS or image management systems typically perform the functions of image acquisition, distribution, display, and archival. Often, separate systems exist for primary interpretation in the radiology department and for use enterprise-wide by nonradiologist clinicians. The RIS typically maintains radiology-specific data, such as imaging examination orders, reports, and billing information.
Although implementation of either one or both of these systems can improve workflow and reduce operating costs, the elimination of film and paper from the practice of radiology is not easily realized without integrating the functions performed by several other information technologies. These systems include hospital information systems (HIS), Computerized Physician Order-Entry (CPOE) Systems, Report Generation Systems, Decision Support Systems, and Case-Based Teaching Files. Together, these systems make up the electronic medical record (EMR).
Several of these systems are more widely known to the health-care enterprise outside of diagnostic imaging departments. They, none-the-less, contain data essential to high quality low cost radiological practice. The value these systems can bring to medical imaging in the clinical enterprise is high, but they must be seamlessly integrated. Including several features, such as single sign-on, electronic
334 PICTURE ARCHIVING AND COMMUNICATION SYSTEMS
master patient index, and context sensitivity, can help make these information systems tools and technologies most useful to radiology.
An effort known as Integrating the Healthcare Enterprise (IHE) provides a framework using existing standards, such as DICOM and Health Level 7 (HL7), to facilitate intercommunications among these disparate systems and to optimize information efficiency. The IHE is a joint effort of the Radiological Society of North America (RSNA) and the Healthcare Information and Management Systems Society (HIMSS) begun in 1998 to more clearly define how existing standards should be used to resolve common information system communication tasks in radiology.
The IHE technical framework defines a common information model and a common vocabulary for systems to use in communicating medical information. It specifies exactly how the DICOM and HL7 standards are to be used by the various information systems to perform a set of welldefined transactions that accomplish a particular task. The original seven tasks facilitated by the IHE include scheduled workflow, patient information reconciliation, consistent presentation of images, presentation of grouped procedures, access to radiology information, key image notes, and simple image and numeric reports. Profiles continue to be added yearly to the framework, enhancing its value in integrating information systems in a healthcare environment.
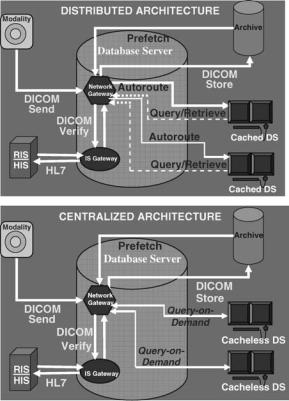
Architectures
Two basic architectures are used in PACS today, distributed or cached and centralized or cacheless depicted in Figs. 1a and 1b, respectively. Data is acquired into the PACS in the same manner for both architectures, from the imaging modality via a DICOM sent to a network gateway. Demographic data is verified by interfacing to the radiology or hospital information system (RIS-HIS) through an IS gateway. Studies are permanently archived by a DICOM store to an electronic archive device.
In a distributed system, images and other relevant data are automatically routed to the workstation(s) where the studies are expected to be viewed and cached or stored on the local display station disk. The best-distributed PACS also prefetch relevant prior examinations from the longterm archive and automatically route them to the pertinent display for immediate access to comparison images. Studies not automatically routed to a workstation can be queried for and retrieved on request.
In a centralized system, images remain on a large central server and are only sent to the workstation when they are called up for display. In this query-on-demand architecture, data is retrieved instantaneously into memory for viewing and manipulation. Images are never stored on the local display station disk, thus centralized systems are also known as cacheless.
A centralized architecture is easier to implement and maintain and uses a simple on-demand data access model, but also has a single point-of-failure in the central server component. A cacheless system is also bandwith-limited, requiring a fast network connection from display stations
Figure 1. (a) Distributed versus (b) centralized PACS architectures.
to the central server. The distributed architecture requires more complex workflow logic such as autorouting and prefetching of data to implement. However, distributed PACS may have more functionality and may be more easily scalable than centralized systems. Early PACS were predominately distributed systems. With the increasing availability of high bandwidth networks and large amounts of inexpensive storage media, most PACS today follow the centralized architecture. Web-based PACS typical of today’s systems are a specialized subset of centralized architectures. Future PACS may evolve to be a combination of both distributed architectures and centralized architectures, encompassing the best of each design.
If a PACS operates with a cached architecture in which data is automatically distributed to and stored at the display station, then the online storage capabilities should include space for maintaining all the pertinent examinations for a given episode of current care, (i.e., three days for outpatients and six days for inpatients). Space for prefetched relevant historical examinations should also be included in the anticipated storage requirements.
If the PACS operates as a cacheless centralized system, then it is important to have adequate capacity to store a patient’s clinical encounter on the server. In this case, it is important to have large amounts of online RAID (redundant array of independent disks—see section on RAID below) at the central server instead of large amounts of local storage at each display station. RAID capacity should also encompass relevant prior examinations prefetched to the server.
KEY COMPONENTS AND ESSENTIAL FEATURES
Image Acquisition
Digital acquisition of data from the various imaging modalities for input to a PACS is the first step to eliminating film in medical imaging. Essential features for successful clinical implementation include conformance with the DICOM standard, radiology information system – hospital information system (RIS-HIS) interfacing, and workflow integration Quality assurance (QA) and quality control (QC) and troubleshooting problems occurring specifically at image acquisition are also critical as these problems affect the integrity of data in the archive.
Integration with PACS. Image acquisition is the first point of data entry into a PACS,system and, as such, errors generated here can propagate throughout the system, adversely affecting clinical operations. General predictors for successful incorporation of image acquisition devices into a digital imaging department include the following: ease of device integration into the established daily workflow routine of the clinical environment, high reliability and fault-tolerance of the device, simplicity and intuitiveness of the user interface, and device speed (13). The integration of modalities with PACS and information systems using the DICOM modality worklist feature (see below) can reduce the number of patient demographic errors and the number of cases that are inappropriately or unspecified and therefore not archiveable, which also ensures the correctness of permanently archived information.
DICOM. Imaging modality conformance with the DICOM standard is critical. DICOM consists of a standard image format as well as a network communications protocol. Compliance with this standard enables an open architecture for imaging systems, bridging hardware and software entities, allowing interoperability for the transfer of medical images and associated information between disparate systems.
The DICOM standard is used, for example, to negotiate a transaction between a compliant imaging modality and a compliant PACS workstation. The scanner notifies the workstation, in a language both understand, that it has an image study to send to it. The workstation replies to the modality when it is ready to receive the data. The data is sent in a format known to all, the workstation acknowledges receipt of the image, and then the devices end their negotiation. Data is formatted in terms of groups and elements. Group 8, for example, pertains to image identification parameters (such as study, series, and image number) and Group 10 includes patient demographics (such as patient name, medical record number, and date of birth).
Prior to DICOM, the acquisition of digital image data and relevant information was extremely difficult, often requiring separate hardware devices and software programs for different vendors’ products, and even for different models of devices made by the same manufacturer because each vendor used their own proprietary data for-
PICTURE ARCHIVING AND COMMUNICATION SYSTEMS |
335 |
mat and communication’s protocol. Most of the major manufacturers of imaging devices currently comply with the DICOM standard, thus greatly facilitating an open systems architecture consisting of multivendor systems. For many legacy devices purchased prior to the establishment of DICOM, an upgrade path to compliance can be performed. For those few devices that do not yet meet the standard, interface boxes consisting of hardware equipment and software programs that convert the image data from the manufacturer’s proprietary format to the standard form are available.
RIS-HIS Interfacing for Data Verification. Equally essential, particularly at acquisition, is integrating the radiology information system (RIS) or hospital information system (HIS) with the PACS, which greatly facilitates input of patient demographics (name, date, time, medical record number (MRN) to uniquely identify a patient, accession number (AccNum) to uniquely identify an imaging examination, exam type, imaging parameters, etc.) and enables automatic PACS data verification, correlation, and error correction with the data recorded in the RIS-HIS. Most imaging modalities are now tightly coupled with the RIS, providing automatic downloading of demographic information from the RIS via barcode readers or directly to the scanner console (via modality worklist capability) and, hence, to the DICOM header. This copling eliminates the highly error-prone manual entry of data at acquisition.
HL7 is the RIS-HIS standard, and compliance with HL7 is desirable. RIS-HIS databases are typically patient-cen- tric, enabling query and retrieval of information by the patient and study, series, or image data hierarchy. Integration of RIS-HIS data with the PACS adds intelligence to the system, helping to move data around the system based on ‘‘how, what data should be delivered where and when’’, automating the functions performed traditionally by the film librarian.
Modality Worklist. Many vendors now provide the capability to download RIS-HIS schedules and worklists directly to the imaging modality, such as most computed tomography (CT), magnetic resonance imaging (MRI), digital fluoroscopy (DF), and ultrasound (US) scanners. In these circumstances, the imaging technologist need only choose the appropriate patient’s name from a list on the scanner console monitor (i.e., by pointing to it on a touchscreen pad), and the information contained within the RISHIS database will be downloaded into the PACS header and associated with the image data for that patient examination.
The general DICOM model for acquisition of image and relevant data from the imaging modality involves the modality device acting as a SCU, which provides the data, and storing it to a SCP, which provides the service: devices such as a PACS acquisition gateway or an image display workstation. In the modality worklist function, however, the image device receives the pertinent patient demographics and image study information from a worklist server, such as a PACSRIS- or RIS-HIS-interfaced device.
Two modes exist for accomplishing the RIS-HIS data transfer to the imaging modality. The first involves data,

336 PICTURE ARCHIVING AND COMMUNICATION SYSTEMS
being transferred automatically to the modality based on the occurrence of an event trigger, such as an examination being scheduled or a patient having arrived. The second method involves a query from the modality to the RIS-HIS or some other information system that holds relevant data, such as an electronic order-entry system or even some PACS databases, which may be initiated by entry of some identifier at the modality, such as bar coding of the study accession number or the patient medical record number from the scheduling card. This method then initiates a request for the associated RIS-HIS information (patient name, date of birth) to be sent from the worklist server on demand.
The benefits of the DICOM modality worklist cannot be overstated. Incorrectly (manually) entered patient demographic data, such as all the permutations of patient name (i.e., James Jones, J Jones, Jones J) can result in mislabeled image files and incomplete study information and, as such, is crucial to maintaining the integrity of the PACS database. Furthermore, the improvements in departmental workflow efficiency and device usability are greatly facilitated by modality worklist capabilities. For those few vendors not offering DICOM modality worklist for their imaging devices, several interface or broker boxes are available that interconnect PACS to RIS-HIS databases translating DICOM to HL7 and vice versa. Figure 2 diagrams an example of how RIS, HIS, and PACS systems might interact upon scheduling an examination for image acquisition into a PACS (14).
Acquisition of the Native Digital Cross-Sectional Modalities. Image acquisition from the inherently digital modalities, such as CT, MRI, and US, should be a direct digital DICOM capture. Direct digital interfaces allow capture and transmission of image data from the modality at the full spatial resolution and full bit depth of gray scale inherent to the modality, whereas the currently outdated analog (video) frame grabbers digitize the video signal voltage output going to an image display, such as a scanner console monitor. In the frame-grabbing method, as in printing an image to film, the image quality is limited
Patient |
Hospital |
|
Schedule |
|
Scanner |
|
Registration |
Exam |
|
DICOM |
|
|
|
|
|
||
|
|
|
DICOM |
|
Gateway |
|
HL7 |
HL7 |
|
|
|
|
Worklist |
SQL |
DICOM |
||
|
|
|
|||
|
|
|
|
||
|
Demographics |
|
MRN |
DataBase |
|
|
MRN # |
|
SQL |
||
|
|
AccNum |
|||
|
|
|
|
||
|
Location |
|
Exam Type |
PACS |
|
HIS |
HL7 |
RIS |
HL7 |
|
|
|
Archive |
||||
|
Results |
|
|
|
|
|
|
|
|
|
|
|
Reporting |
|
HL7 Report |
DICOM |
|
|
|
|
|||
|
|
|
Reporting |
Workstation |
|
|
|
|
System |
||
|
|
|
|
|
|
Figure 2. Diagram of how RIS, HIS, and PACS systems might interact on scheduling an examination for image acquisition into a PACS.
Table 1. The Commonly PACS-Interfaced Cross-Sectional Modalities and their Inherent File Sizes
|
|
|
Grayscale Bit |
Modality |
Image Matrix Size |
Depth |
|
|
|
|
|
Computed |
512 |
512 pixels |
12 – 16 bits |
Tomography (CT) |
|
512 pixels or |
|
Digital Angiography |
512 |
8 – 12 bits |
|
& (RA) |
1024 1024 pixels |
|
|
Digital Fluoroscopy |
|
||
(DF) |
or 2048 2048 |
|
|
|
pixels |
|
|
Magnetic Resonance |
256 |
256 pixels |
12 – 16 bits |
Imaging (MRI) |
64 64 pixels or |
|
|
Nuclear Medicine |
8 – 32 bits |
||
Images (NUC) |
|
128 pixels or |
|
|
128 |
|
|
|
256 |
256 pixels |
|
Ultrasound (US) |
64 64 pixels or |
16 – 32 bits |
|
|
128 |
128 pixels |
|
by the process to just 8 bits (or 256 gray values), whereas most modalities have the capability to acquire in 12, 16, or even 32 bits for color data. Capture of only 8 bits may not allow viewing in all the appropriate clinical windows and levels or contrast and brightness settings and is, therefore, not optimal.
For example, when viewing a CT of the chest, one may wish to view in lung window and level settings and in mediastinal and bone windows and levels. Direct capture of the digital data will allow the viewer to dynamically window and level through each of these settings on-the-fly (in real time) at the softcopy display station. However, to view all appropriate window and level settings on film, several copies of the study would have to be printed, one at each window and level setting. If one performs the analog acquisition or frame grabbing of the digital data, the viewer can only window and level through the 8 bits captured, which may not be sufficient. Thus, direct capture of digital data from the inherently digital modalities is the preferred method of acquisition. Table 1 lists the cross-sectional modalities commonly interfaced to PACS along with their inherent file sizes and bit depths.
Acquisition of Projection Radiography. Methods for digital image acquisition of the conventional projection X ray include computed radiography (CR) scanners or imaging with photostimulable or storage phosphors, digitization of existing analog film, and digital radiography (DR) devices. Digital acquisition of images already on film can be accomplished using a variety of image digitization devices or film scanners, including the no longer used analog video cameras with analog-to-digital converters (ADC), digital cameras, charge-coupled devices (CCD), and laser scanners. Both CR and DR are replacement methods for capturing conventional screen-film projection radiography.
Film Digitizers. Film digitizers will still be necessary even in the all digital or filmless imaging department, so that film images from outside referrals lacking digital capabilities can be acquired into the system and viewed digitally. Film digitizers convert the continuous optical
density values on film into a digital image by sampling at discrete evenly spaced locations and quantizing the transmitted light from a scan of the film into digital numbers. Several types of film digitizers exist today, with some used more frequently than others in PACS and teleradiology applications.
The analog video camera with ADC, or camera on a stick, was used in low cost, entry-level teleradiology applications but is no longer used in PACS applications today because of its manual operation. The analog video camera requires an illumination source and careful attention to lens settings, focus, f-stop, and so on. In addition, it has a maximum resolution of 1024 by 1024 by 8 bits (256 grays), thus limiting the range of window and level, or contrast and brightness values, the resulting digital image can be displayed in. Digital cameras produce a digital signal output directly from the camera at a maximum resolution of 2048 by 2048 by 12 bits (4096 grays) but are still infrequently used in PACS due to their high cost.
More commonly used are film scanners such as the CCD and laser scanners sometimes called flat-bed scanners. CCD scanners use a row of photocells and uniform bright light illumination to capture the image. A lens focuses the transmitted light from the collimated, diffuse light source onto a linear CCD detector, and the signal is collected and converted to a digital electronic signal via an ADC. CCD scanners have a maximum resolution of 4096 by 4096 by 8–12 bits, but they have a narrow film optical density range to which they can respond. CCD scanners have been used in high-end teleradiology or entry-level in-house film distribution systems, such as image transmission to the intensive care units (ICUs).
The laser scanner or laser film digitizer uses either a helium-neon (HeNe) gas laser or a solid-state diode laser source. The laser beam is focused by lenses and directed by mirror deflection components, and the light transmitted through the film is collected by a light guide, its intensity detected by a photomultiplier tube, converted to a proportional electronic signal, and digitized in an ADC. Laser scanners use a fine laser beam of generally variable or adjustable spot sizes down to 50 mm (producing an image sharpness of approximately 10 line pairs per millimeter). They have a maximum spatial resolution of 4096 by 5120 and a grayscale resolution of 12 bits, and can accommodate the full optical density range of film. They are semior fully-automatic in operation and are currently the scanner of choice for PACS applications even though they are often more expensive than CCD scanners.
Computed Radiography (CR). Computed Radiography (CR) refers to projection X-ray imaging using photostimulable or storage phosphors as the detector. In this modality, X rays incident upon a photostimulable phosphor-based image sensor or imaging plate produce a latent image that is stored in the imaging plate until stimulated to luminesce by laser light. This released light energy can be captured and converted to a digital electronic signal for transmission of images to display and archival devices. Unlike conventional screen-film radiography in which the film functions as the imaging sensor, or recording medium, as well as the display device and storage media, CR eliminates film from
PICTURE ARCHIVING AND COMMUNICATION SYSTEMS |
337 |
the image recording step, resulting in a separation of image capture from image display and image storage. This separation of functions potentiates optimization of each of these steps individually. In addition, CR can capitalize on features common to all digital images, namely, electronic transmission, manipulation, display, and storage of radiographs (15).
Technological advances in CR over time have made this modality widely accepted in digital departments. Hardware and software improvements have occurred in the photostimulable phosphor plate, in image readingscanning devices, and in image processing algorithms. Overall reduced cost of CR devices, as well as a reduction in the cost and increased utility of image display devices, have contributed to the increased acceptance of CR as a viable digital counterpart to conventional screen-film projection radiography.
Review of the Fundamentals
Process Description. ACR system consists of a screen or plate of a stimulable phosphor material that is usually contained in a cassette and is exposed in a manner similar to the traditional screen-film cassette. The photostimulable phosphor in the imaging plate (IP) absorbs X rays that have passed through the patient, ‘‘recording’’ the X-ray image. Like the conventional intensifying screen, CR plates produce light in response to an X ray, at the time of exposure. However, storage phosphor plates have the additional property of being capable of storing some of the absorbed X-ray energy as a latent image. Plates are typically made of an europium-doped barium-fluoro-halide-halide crystallized matrix. Electrons from the dopant ion become trapped just below the conduction band when exposed to X rays. Irradiating the imaging plate at some time after the X ray exposure with red or near-infrared laser light liberates the electrons into the conduction band, stimulating the phosphor to release some of its stored energy in the form of green, blue, or ultraviolet light—the phenomenon of photostimulable luminescence. The intensity of light emitted is proportional to the amount of X ray absorbed by the storage phosphor (16).
The readout process uses a precision laser spotscanning mechanism in which the laser beam traverses the imaging plate surface in a raster pattern. The stimulated light emitted from the IP is collected and converted into an electrical signal, with optics coupled to a photomultiplier tube (PMT). The PMT converts the collected light from the IP into an electrical signal, which is then amplified, sampled to produce discrete pixels of the digital image, and sent through an ADC to quantize the value of each pixel (i.e., a value between 0 and 1023 for a 10 bit ADC or between 0 and 4095 for a 12 bit ADC).
Not all of the stored energy in the IP is released during the readout process. Thus, to prepare the imaging plate for a new exposure, the IP is briefly flooded with high intensity (typically fluorescent) light. This erasure step ensures removal of any residual latent image.
A diagram of the process steps involved in a CR system is shown in Fig. 3. In principle, CR inserts a digital computer between the imaging plate receptor (photostimulable phosphor screen) and the output film. This digital

338PICTURE ARCHIVING AND COMMUNICATION SYSTEMS
Patient
X-ray tube
1 Ready for use
2 |
Exposure |
|
Latent image
3 Image readout |
|
|
Laser |
|
Scanning optics |
||
|
|
||
|
|
mechanism |
|
* * |
* |
Light |
|
** * |
PMT |
||
** ** |
guide |
||
* |
* |
|
|
* ** |
|
|
|
* * |
* |
|
|
* * |
|
|
|
* ** |
|
|
|
Amplifier |
ADC |
||
|
|
4 |
|
|
|
|
|
5 Erasure Output conversion
Film
Unexposed imaging plate Fluorescent lamp |
Display |
Figure 3. The image production steps involved in CR. The imaging plate is exposed to X rays, read out by a laser scanning mechanism, and erased for reuse. A light guide collects the photostimulated luminescence and feeds it to a photomultiplier tube (PMT) that converts the light signal to an electrical signal. Amplification, logarithmic conversion, and analog-to-digital conversion produce the final digital signal that can be displayed on a cathode ray tube monitor or sent to a laser printer for image reproduction on film.
processor can perform a number of image processing tasks including compensating for exposure errors, applying appropriate contrast characteristics, enhancing image detail, and storing and distributing image information in digital form.
System Characteristics. One of the most important differences between CR and screen-film systems is in exposure latitude. The response of a digital imaging system relates the incident X ray exposure to the resulting pixel value output. System sensitivity is the lowest exposure that will produce a useful pixel value, and the dynamic range is the ratio of the exposures of the highest and lowest useful pixel values (17). Storage phosphor systems have extremely wide exposure latitude. The wide latitude of storage phosphor systems, and the effectively linear detector characteristic curve, allows for a wider range of exposure information to be captured in a single image than is possible with any screen-film system. In addition, the wide dynamic range of CR allows it to be used under a broad range of exposure conditions without the need for changing the basic detector, also making CR an ideal choice for applications in which exposures are highly variable or difficult to control, as in portable or bedside radiography. Through image processing, CR systems can usually create a diagnostic image out of underor over-exposures via appropriate look-up table correction. In the screen-film environment, such underor overexposures might have necessitated retakes and additional exposure to the patient.
Dose requirements of a medical imaging system depend on the system’s ability to detect and convert the incoming signal into a usable output signal. It is important to stress that CR systems are not inherently lower dose systems than screen-film. In fact, several studies have demonstrated a higher required exposure for CR to achieve equivalent optical density on screen-film (18,19). However, the wider latitude of storage phosphor systems makes
them much more forgiving of underor over-exposure. As in any digital radiography system, when dose is decreased, the noise due to quantum mottle increases (20). Reader tolerance of this noise tends to be the limiting factor on the lowest acceptable dose.
In some clinical situations, the radiologist may feel comfortable in lowering the exposure technique factor to reduce dose to the patient, such as in pediatric extremity X-ray exams. In others, such as imaging the chest of the newborn, one may wish to increase exposure to reduce the more visible mottle (at lower doses) to avoid mistaking the noise over the lungs as an indication of pulmonary interstitial emphysema, for example. CR systems are signal-to-noise-limited (SNR-limited), whereas screen-film systems are contrast-limited.
Image Quality. DQE: Objective descriptors of digital image quality include detective quantum efficiency (DQE), which is a measure of the fidelity with which a resultant digital image represents the transmitted X-ray fluence pattern (i.e., how efficiently a system converts the X-ray input signal into a useful output image), and includes a measure of the noise added (17). Also taken into account are the input/output characteristics of the system and the resolution response of unsharpness or blur added during the image capture process. The linear, wide-latitude input/ output characteristic of CR systems relative to screen-film leads to a wider DQE latitude for CR, which implies that CR has the ability to convert incoming X-ray quanta into ‘‘useful’’ output over a much wider range of exposures than can be accommodated with screen-film systems (20).
Spatial Resolution: The spatial resolution response or sharpness of an image capture process can be expressed in terms of its modulation transfer function (MTF), which, in practice, is determined by taking the Fourier Transform of the line spread function (LSF) and relates input subject contrast to imaged subject contrast as a function of spatial frequency (17). The ideal image receptor adds no blur or broadening to the input LSF, resulting in an MTF response of one at all spatial frequencies. A real image receptor adds blur, typically resulting in a loss of MTF at higher spatial frequencies.
The main factors limiting the spatial resolution in CR, similar to screen-film systems, is X-ray scattering within the phosphor layer. However, it is the scattering of the stimulating beam in CR, rather than the emitted light as in screen-film, that determines system sharpness (20,21). Broadening of the laser light spot within the IP phosphor layer spreads with the depth of the plate. Thus, the spatial resolution response of CR is largely dependent on the initial laser beam diameter and on the thickness of the IP detector. The reproducible spatial frequency of CR is also limited by the sampling used in the digital readout process. The spatial resolution of CR is less than that of screen-film, with CR ranging from 2.5 to 5 line pairs per millimeter (lp/mm) using a 200 mm laser spot size and a digital matrix size of approximately 2,000 by 2,500 pixels versus the 5–10 lp/mm or higher spatial resolution of screen-film.
Finer spatial resolution can technically be achieved today with the ability to tune laser spot sizes down to
50 mm or less. However, the image must be sampled more finely (approximately 4,000 by 5,000 pixels) to achieve 10 lp/mm. Thus, a tradeoff exists between the spatial resolution that can technically be achieved and the file size to practically transmit and store. Most general CR examinations are acquired using a 200 mm laser spot size and a sampling of 2 k by 2.5 k pixels. For examinations requiring very fine detail resolution, such as in mammography, images are acquired with a 50 mm laser spot size and sampled at 4 k by 5 k pixels.
Contrast Resolution: The contrast or gray-scale resolution for CR is much greater than that for screen-film. Note that because overall image quality resolution is a combination of spatial and gray-scale resolution, the superior contrast resolution of CR can often compensate for its lack of inherent spatial resolution. By manipulating the image contrast and brightness, or window and level values, respectively, small features often become more readily apparent in the image, which is analogous to ‘‘brightlighting’’ or ‘‘hot-lighting’’ a bone film, for example, when looking for a small fracture. The overall impression is that the spatial resolution of the image has been improved when, in fact, it has not changed—only the contrast resolution has been manipulated. More work needs to be done to determine the most appropriate window and level settings with which to initially display a CR image. Lacking the optimum default settings, it is often useful to ‘‘dynamically’’ view CR softcopy images with a variety of window and level settings.
Noise: The types of noise affecting CR images include X-ray dose-dependent noise and fixed noise (independent of X-ray dose). The dose-dependent noise components can be classified into X-ray quantum noise, or mottle, and light photon noise (21). The quantum mottle inherent in the input X-ray beam is the limiting noise factor, and it develops in the process of absorption by the imaging plate, with noise being inversely proportional to the detector X-ray dose absorption. Light photon noise occurs in the process of photoelectric transmission of the photostimulable luminescence light at the surface of the PMT.
Fixed-noise sources in CR systems include IP structural noise (the predominant factor), noise in the electronics chain, laser power fluctuations, quantization noise in the analog-to-digital conversion process, and so on (20,21). IP structural noise develops from the nonuniformity of phosphor particle distribution, with finer particles providing noise improvement. Note that for CR systems, it is the noise sources that limit the DQE system latitude, whereas in conventional X-ray systems, the DQE latitude is limited by the narrower exposure response of screenfilm.
Comparison with Screen-Film: The extremely large latitude of CR systems makes CR more forgiving in difficult imaging situations, such as portable examinations, and enables decreased retake rates for improper exposure technique, as compared with screen-film. The superior contrast resolution of CR can compensate in many cases for its lesser spatial resolution. Cost savings and improved radiology departmental workflow can be realized with CR and the elimination of film for projection radiographs.
PICTURE ARCHIVING AND COMMUNICATION SYSTEMS |
339 |
Available CR Systems.
Historical Perspective. Most of the progress in storage phosphor imaging has been made since World War II (22). In 1975, Eastman Kodak Company (Rochester, NY) patented an apparatus using infrared-stimulable phosphors or thermoluminescent materials to store an image (23). In 1980, Fuji Photo Film (Tokyo, Japan) patented a process in which photostimulable phosphors were used to record and reproduce an image by absorbing radiation and then releasing the stored energy as light when stimulated by a helium-neon laser (24). The emitted phosphor luminescence was detected by a PMT, and the electronic signal produced reconstructed the image.
Fuji was the first to commercialize a storage phosphorbased CR system in 1983 (as the FCR 101) and published the first technical paper (in Radiology) describing CR for acquiring clinical digital X-ray images (25). The central processing type second-generation scanners (FCR 201) were marketed in 1985 (21). Third-generation Fuji systems marketed in 1989 included distributed processing (FCR 7000) and stand-alone (AC-1) types (21). Fuji systems in the FCR 9000 series are improved, higher speed, higher performance third-generation scanners. Current Fuji systems include upright chest units, CR detectors in wall and table buckeyes, multiplate autoloaders, and more compact stand-alone units.
In 1992, Kodak installed its first commercial storage phosphor reader (Model 3110) (16). Later models include autoloader devices. In 1994, Agfa-Gevaert N.V. (Belgium) debuted its own CR system design (the ADC 70) (26). In 1997, Agfa showed its ADC Compact with greatly reduced footprint. Agfa also introduced a low cost, entry-level single-plate reader (the ADC Solo) in 1998, appropriate for distributed CR environments such as clinics, trauma centers, and ICUs. In 1998, Lumisys presented its low cost, desktop CR unit (the ACR 2000) with manual-feed, singleplate reading. Numerous desktop units have been introduced including the Orex CR. Konica Corp. debuted its own device (XPress) in 2002 and, later, the Regius upright unit, both of which have relatively fast scan times (at 40 and 16 s cycle times, respectively).
Many companies have been involved in CR research and development, including N.A. Philips Corp.; E.I. DuPont de Nemours & Co.; 3M Co.; Hitachi, Ltd.; Siemens AG; Toshiba Corp.; General Electric Corp.; Kasei Optonix, Ltd.; Mitsubishi Chemical Industries, Ltd.; Nichia Corp.; GTE Products Co.; and DigiRad Corp. (20).
Technological Advances. Major improvements in the overall CR system design and performance characteristics include a reduction in the physical size of the reading/ scanning units, increased plate-reading capacity per unit time, and better image quality. These advances have been achieved through a combination of changes in the imaging plates themselves, in the image reader or scanning devices, and in the application of image processing algorithms to affect image output.
The newer imaging plates developed for the latest CR devices have higher image quality (increased sharpness) and improved fading and residual image characteristics. Higherimagequalityhas resultedfromseveralmodifications
340 PICTURE ARCHIVING AND COMMUNICATION SYSTEMS
in the imaging plate phosphor and layer thickness. Smaller phosphor grain size in the IP (down to approximately 4 mm) diminishes fixed noise of the imaging plate, whereas increased packing density of phosphor particles counteracts a concomitant decrease in photostimulable luminescence (21). A thinner protective layer is used in the plates tending to reduce X-ray quantum noise and, in and of itself, would improve the spatial resolution response characteristics of the plates as a result of diminished beam scattering. However, in the newest IPs, the quantity of phosphor coated onto the plate is increased for durability purposes, resulting in the same response characteristic of previous imaging plates (27).
An historical review of CR scanning units chronicles improved compactness and increased processing speed. The first Fuji unit (FCR 101) from 1983 required roughly 6 m2 of floor space to house the reader and could only process about 45 plates per hour, whereas today’s Fuji models as well as other vendor’s devices occupy less than 1 m2 and can process over 110 plates per hour, which represents a decrease in apparatus size by a factor of approximately one-sixth and an increase in processing capacity of roughly 2.5 times. Desktop models reduce the physical device footprint even further.
CR imaging plate sizes, pixel resolutions, and their associated digital file sizes are roughly the same across manufacturers for the various cassette sizes offered. For example, the 1400 by 1700 (or 35 cm by 43 cm metric equivalent) plates are read with a sampling rate of 5–5.81 pixels per mm, at a digital image matrix size of roughly 2 k by 2 k pixels (1760 by 2140 pixels for Fuji (21) and 2048 by 2508 pixels for Agfa and Kodak (16). Images are typically quantized to 12 bits (for 4096 gray levels). Thus, total image file sizes range from roughly 8 megabytes (MB) to 11.5 MB. The smaller plates are scanned at the same laser spot size (100 mm), and the digitization rate does not change; therefore, the pixel size is smaller (16). The 1000 by 1200 (24 cm by 30 cm) plates are typically read at a sampling rate of 6.7–9 pixels per millimeter (mm) and the 800 by 1000 (18 cm by 24 cm) plates are read at 10 pixels per mm (16,21).
Cassetteless CR devices have been introduced in which the detector is incorporated into a chest unit, wall, or table buckey to speed throughput and facilitate workflow much like DR devices do. Dual-sided signal collection capability is available by Fuji, increasing overall signal-to-noise. Agfa has shown a product in development (ScanHead CR) that stimulates and reads out the imaging plate line-by-line, as opposed to the point-by-point scanning that occurs in most CR devices today. Increased speed (5 s scan time) and higher DQE have been demonstrated. In addition, needle phosphors have been explored as a possible replacement to powder phosphors, having shown improved spatial resolution and DQE.
Image Processing Algorithms. Image processing is performed to optimize the radiograph for output display. Each manufacturer has a set of proprietary algorithms that can be applied to the image for printing on laser film or display initially only on their own proprietary workstations. Prior to the DICOM standard, only the raw data
could be directly acquired digitally. Therefore, to attain the same image appearance on other display stations, the appropriate image processing algorithms (if known) had to be implemented somewhere along the chain from acquisition to display. Now image processing parameters can be passed in the DICOM header and algorithms applied to CR images displayed on generic workstations. Typically, however, advanced real-time manipulation of images can only be done on each manufacturers’ specific processing station. In general, the digital image processing applied to CR consists of a recognition or analysis phase, followed by contrast enhancement or frequency processing. Note that the same general types of image processing applied to CR can also be applied to DR images.
Image Segmentation. In the image recognition stage, the region of exposure is detected (i.e., the collimation edges are detected), a histogram analysis of the pixel gray values in the image is performed to assess the actual exposure to the plate, and the appropriate look-up table specific to the region of anatomy imaged and chosen by the X-ray technologist at the time of patient demographic information input is selected. Proper recognition of the exposed region of interest is extremely important as it affects future processing applied to the image data. For example, if the bright-white area of the image caused by collimation at the time of exposure is not detected properly, its very high gray values will be taken into account during histogram analysis, increasing the ‘‘window’’ of values to be accommodated by a given display device (softcopy or hardcopy). The effect would be to decrease the overall contrast in the image.
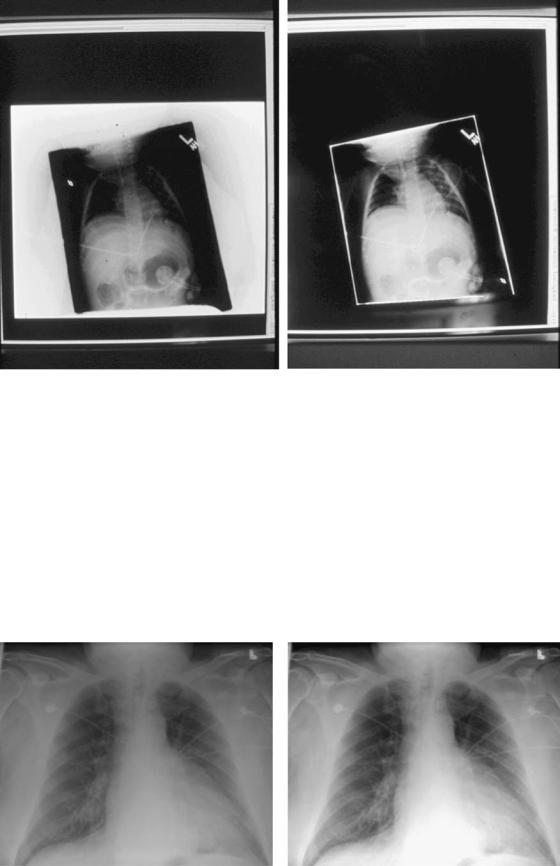
Some segmentation algorithms, in addition to detection of collimation edges in the image, enable users to blacken the region outside these edges in the final image if so desired (16,28), which tends to improve image contrast appearance by removing this bright-white background in images of small body parts or pediatric patients. The photo in Fig. 4B demonstrates this feature of ‘‘blackened surround,’’ as applied to the image in Fig. 4A.
Contrast Enhancement. Conventional contrast enhancement, also called gradation processing, tone scaling, and latitude reduction, is performed next. This processing amounts to choosing the best characteristic curve (usually a nonlinear transformation of X-ray exposure to image density) to apply to the image data. These algorithms are quite flexible and can be tuned to satisfy a particular user’s preferences for a given ‘‘look’’ of the image (29). Look-up tables are specific to the region of anatomy imaged. Figure 5 shows an example of the default adult chest look-up table (Fig. 5a) applied to an image and the same image with high contrast processing (Fig. 5b). A reverse-contrast scale or ‘‘black bone’’ technique, in which what was originally black in the image becomes white and what was originally white in the image becomes black, is sometimes felt to be beneficial for identifying and locating tubes and lines. An example is shown in Fig. 6 where the contrast reversal algorithm has been applied to the image in Fig. 6a, resulting in the image in Fig. 6b.
PICTURE ARCHIVING AND COMMUNICATION SYSTEMS |
341 |
Figure 4. Example image segmentation algorithm detection of (white) collimation edges of exposure region in image A, with ‘‘blackened surround’’ applied in image B. Note the improved overall contrast in the image in B.
Spatial Frequency Processing. The next type of image processing usually performed is spatial frequency processing, sometimes called edge enhancement. These algorithms adjust the frequency response characteristics of the CR systems essentially implementing a highor band-pass filter operation to enhance the high spatial frequency content contained in edge information. Unfortunately, noise also contains high spatial frequency information and can be exacerbated by edge enhancement techniques. To lessen this problem, a nonlinear unsharp masking technique is typically implemented serving to suppress noise via a smoothing process. Unsharp masking
is an averaging technique that, via summation, tends to blur the image. When this result is subtracted from the original image data, the effect is one of noise suppression. Specific spatial frequencies can be preferentially selected and emphasized by changing the mask size and weighting parameters. For example, low spatial frequency information in the image can be augmented by using a relatively large mask, whearas high spatial frequency or edge information can be enhanced by using a small mask size (16).
Dynamic Range Control. An advanced algorithm by Fuji, for selective compression or emphasis of low density
Figure 5. Chest image processed with A. default mode and B. high contrast algorithm applied.

342 PICTURE ARCHIVING AND COMMUNICATION SYSTEMS
Figure 6. Chest image processed with A. default mode and B. blackbone or contrast reversal algorithm applied.
regions in an image, independent of contrast and spatial frequency is known as dynamic range control (DRC) processing (30). The algorithm consists of performing an unsharp mask for suppression of high spatial frequency information, then application of a specific look-up table mapping to selected regions (i.e., low density areas). This mask is then added back to the original data with the overall result being improved contrast in poorly penetrated regions, without loss of high frequency and contrast emphasis. In a clinical evaluation of the algorithm for processing of adult portable chest exams, DRC was found to be preferred by five thoracic radiologists in a side-by-side comparison, providing improved visibility of mediastinal details and enhanced subdiaphragmatic regions (31).
Multiscale Image Contrast Amplification. Multiscale image contrast amplification (MUSICA) is a very flexible advanced image processing algorithm developed by Agfa (26,32). MUSICA is a local contrast enhancement technique based on the principle of detail amplitude or strength and the notion that image features can be striking or subtle, large in size or small. MUSICA processing is independent of the size or diameter of the object with the feature to be enhanced. The method is carried out by decomposing the original image into a set of detail images, where each detail image represents an image feature of a specific scale. This set of detail images or basis functions completely describes the original image. Each detail image representation and the image background are contrast equalized separately; some details can be enhanced and others attenuated as desired. All the separate detail images are recombined into a single image, and the result is diminished differences in contrast between features regardless of size, such that all image features become more visible.
Image Artifacts. The appearance and causes of image artifacts that can occur with CR systems should be recognized and corrected. Artifacts can develop from a variety of sources, including those related to the imaging plates themselves, to image readers, and to image processing.
Several types of artifacts potentially encountered with CR have been minimized with the latest technology improvements but may still be seen in older systems.
Lead backing added to the aluminum-framed, carbonfiber cassettes has eliminated the so-called light-bulb effect, darkened outer portions of a film due to backscattered radiation (33). High sensitivity of the CR plates renders them extremely susceptible to scattered radiation or inadvertent exposure, thus routine erasure of all CR plates on the day of use is recommended as is the storing of imaging plates on end, rather than stacking of cassettes one on top of the other (34). The occurrence of persistent latent images after high exposures or after prolonged intervals between plate erasure and reuse (33,35) has been lessened by the improved efficiency of the two-stage erasure procedure used in the latest CR systems (34). Improved recognition of the collimation pattern employed for a given image allows varied (including off-angle) collimation fields and in turn, improves histogram analysis and subsequent processing of the imaged region (34), although these algorithms can fail in some instances. Plate cracking, from wear-and-tear, can create troublesome artifacts as depicted in Volpe (34).
Inadvertent double exposures can occur with the present CR systems, potentially masking low density findings, such as regions of parenchymal consolidation, or leading to errors in interpreting line positions. Such artifacts are more difficult to detect than with screen-film systems because of CR’s linear frequency processing response, optimizing image intensity over a wide range of exposures (i.e., due to its wide dynamic range). Figure 7 shows an example double-exposure artifact, and additional examples are included in Volpe (34). Laser scanning artifacts can still occur with current CR readers and are seen as a linear artifact across the image, caused by dust on the light source (34). Proper and frequent cleaning of the laser and light guide apparatus as well as the imaging plates themselves can prevent such artifacts.
The ability of CR to produce clinically diagnostic images over a wide range of exposures is dependent on
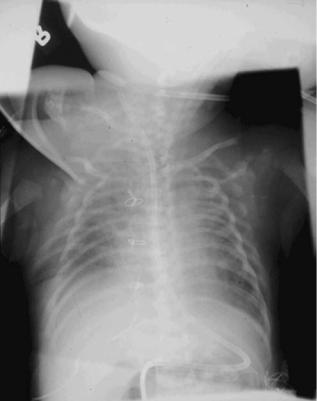
Figure 7. Example inadvertent double exposure.
the effectiveness of the image analysis algorithms applied to each dataset. The specific processing parameters used are based on standards tuned to the anatomic region under examination. Incorrect selection of diagnostic specifier or inappropriate anatomic region can result in an image of unacceptable quality. Understanding the causes of some of these CR imaging artifacts described here, as well as maintaining formal, routine quality assurance procedures, can help to recognize, correct for, and avoid future difficulties.
Summary of CR. CR can be used for the digital image acquisition of projection radiography examinations into a PACS. As a result of its wide exposure latitude and relative forgiveness of exposure technique, CR can improve the quality of images in difficult imaging situations, such as in portable or bedside examinations of critically ill or hospitalized patients. As such, CR systems have been successfully used in the ICU setting, in the emergency room (ER) or trauma center, as well as in the operating room (OR). CR can also be cost-effective for a high volume clinic setting, or in a low volume site as input to a teleradiology service, and have successfully reduced retake rates for portable and other examinations.
Technological advances in CR hardware and software have contributed to the increased acceptance of CR as a counterpart to conventional screen-film projection radiography, making the use of this modality for clinical purposes more widespread. CR is compatible with existing X-ray equipment, yet separates out the functions of image
PICTURE ARCHIVING AND COMMUNICATION SYSTEMS |
343 |
acquisition or capture, image display, and image archival versus traditional screen-film, in which film serves as the image detector, display, and storage medium. This separation in image capture, display, and storage functions by CR enables optimization of each of these steps individually. Potential expected benefits are improved diagnostic capability (via the wide dynamic range of CR and the ability to manipulate the exam through image processing) and enhanced radiology department productivity (via networking capabilities for transmission of images to remotely located digital softcopy displays and for storage and retrieval of the digital data).
Digital Radiography (DR). In addition to CR devices for digital image acquisition of projection X rays are the maturing direct digital detectors falling under the general heading of digital radiography (DR). Note that digital mammography is typically done using DR devices, although CR acquired at much higher sampling matrices has also been tested.
Unlike conventional screen-film radiography in which the film functions as the imaging sensor or recording medium as well as the display and storage media, DR, like CR, eliminates film from the image recording step, resulting in a separation of image capture from image display and image storage. This separation of functions potentiates optimization of each of these steps individually. In addition, DR, like CR, can capitalize on features common to digital or filmless imaging, namely the ability to acquire, transmit, display, manipulate, and archive data electronically, overcoming some of the limitations of conventional screen-film radiography. Digital imaging benefits include remote access to images and clinical information by multiple users simultaneously, permanent storage and subsequent retrieval of image data, expedient information delivery to those who need it, and efficient cost-effective workflow with elimination of film from the equation.
Review of the Fundamentals.
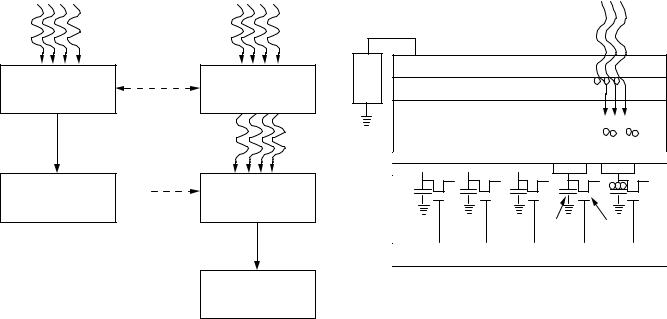
Process Description. Indirect versus Direct Conversion: DR refers to devices for direct digital acquisition of projection radiographs in which the digitization of the X-ray signal takes place within the detector. Compare this method with CR, which uses a photostimulable phosphor imaging plate detector in a cassette design that must be processed in a CR reader following X-ray exposure, for conversion to a digital image. DR devices, also called flatpanel detectors, include two types, indirect conversion devices in which light is first generated using a scintillator or phosphor and then detected by a CCD or a thin-film- transistor (TFT) array in conjunction with photodiodes; and DDR devices, which consist of a top electrode, dielectric layer, selenium X-ray photoconductor, and thin-film pixel array (36). Figure 8 shows a comparison of the direct and indirect energy conversion steps in the production of a digital X-ray image. DDR devices offer direct energy conversion of X ray for immediate readout without the intermediate light-conversion step.
The basis of DR devices is the large area thin-film- transistor (TFT) active matrix array, or flat panel, in which each pixel consists of a signal collection area or charge
344 PICTURE ARCHIVING AND COMMUNICATION SYSTEMS
Direct conversion |
|
Indirect conversion |
X-rays |
|
X-rays |
Photoconductor |
Conversion losses, |
|
increased noise |
Phosphor converts |
|
converts X-rays to |
|
|
|
X-rays to light |
|
electrical signal |
|
|
|
|
|
|
|
Light |
|
Conversion losses, |
|
|
increased noise |
Light converted to |
Digital X-ray image |
|
|
|
electrical signal |
|
|
|
Digital X-ray image
Figure 8. The image production steps involved in direct and indirect digital radiography detectors.
collection electrode, a storage capacitor, and an amorphous silicon field-effect transistor (FET) switch that allows the active readout of the charge stored in the capacitor (36). Arrays of individual detector areas are addressed by orthogonally arranged gate switches and data lines to read the signal generated by the absorption of X rays in the detector. The TFT arrays are used in conjunction with a direct X-ray photoconductor layer or an indirect X-ray-sensitive phosphor-coated light-sensitive detector or photodiode array.
An example DDR device, diagramed in cross section in Fig. 9 (36), uses a multilayer detector in a cassette design, in which the X-ray energy is converted directly to electronhole pairs in an amorphous selenium (Se) photoconductive conversion layer. Charge pairs are separated in a bias field such that the holes are collected in the storage capacitors and the electrons drift toward the Se-dielectric interface. At the end of exposure, the image resides in the pixel matrix in the form of charges, with the charge proportional to the absorbed radiation. At the end of the readout, the charges are erased to prepare for another detection cycle.
An example indirect DR device uses an X-ray-sensitive phosphor coating on top of a light-sensitive flat-panel amorphous silicon (Am-Si) detector TFT array. The X rays are first converted to light and then to a proportional charge in the photodiode [typically a cesium iodide (CsI) scintillator], which is then stored in the TFT array where the image signal is recorded.
System Characteristics. DR detectors have high efficiency, low noise and good spatial resolution, wide latitude, and all the benefits of digital or filmless imaging. Similarly, DR has a very wide dynamic range of quantization to thousands of gray levels. These devices are becoming more
|
|
|
X-rays |
|
+ |
Top electrode |
|
|
|
Power |
|
|
|
|
|
|
- - - |
|
|
supply |
Dielectric layer |
|
|
|
-- |
|
|
|
|
|
|
|
|
|
|
X-Ray photoconductor |
- + |
- + |
|
|
selenium |
|
||
|
Electron blocking layer |
|
|
|
|
Charge collection electrode |
|
|
|
|
|
|
+++ |
|
|
Active pixel array (TFTs) |
Storage |
Thin-film |
|
|
capacitor |
transistor |
|
|
|
Glass substrate |
|
|
|
Figure 9. Cross-sectional view of an example direct digital radiography (DDR) detector panel.
widely used clinically and are available in table buckeys as well as chest units. DR units have superior workflow and increased patient throughput due to the elimination of cassette handling (37).
The short imaging cycle time of DR may lend itself to combined static radiographic and dynamic fluoroscopic uses in future applications, which is true especially for the indirect devices. The direct Se detector, for example, has a ghosting problem due to charge trapping, which introduces a lag time at the end of each cycle, lengthening the time between readiness for the next exposure.
The cost of sensor production is still high such that the overall price of devices has not dropped appreciably. DR is sometimes referred to as a one-room-at-a-time technology because the detectors are built into the room and matched to the X-ray source. Detector fragility and poor portability makes DR difficult to use in the bedside X-ray environment, but some portable devices are now being introduced.
Image Quality. DR image quality is comparable with that of CR. However, DR devices have higher DQEs than CR, capturing roughly 80% absorption of the X-ray energy at optimum exposures. Thus, DR is a higher efficiency, low noise detector, converting much of the incoming X-ray signal into useful output. Several recent studies have demonstrated high image quality at lower radiation dose to the patient. The ability to lower exposure would be a significant advantage for DR. A factor limiting DR efficiency involves the packing fraction, or active detector area to dead space taken up by the data readout devices (transistors, data lines, capacitors, etc.). As the physical size of the data readout components is currently fixed, the smaller the pixel size, the smaller the packing fraction, with a larger proportion of dead area overwhelming the active area, in some cases reducing the active area to 30% or less (36). The overall effect is a reduction in geometric and quantum efficiency.
The spatial resolution of DR is comparable with CR, which is still less than that for analog X ray. Typical matrix sizes are on the order of 2000 to 2500 pixels by 2000 to 2500 pixels. The pixel size of the TFT array detector is the limiting factor for spatial resolution, with the direct Se detector yielding a better inherent spatial resolution than indirect detectors, which can lead to better signal modulation and superior contrast.
DR design presents a delicate tradeoff between detector efficiency, inversely proportional to pixel size, and spatial resolution, affected directly by pixel size. Typically, DR devices are specified for higher detection efficiency at a cost of less spatial resolution than screen-film, with compensation by a wide dynamic range or high contrast resolution. Design complexities requiring further development include wiring configurations to minimize dead space and maximize the detector packing fraction, fast and robust signal readout methods, and better error-correction matrices for more accurate signal readout.
Comparison of CR and DR. Table 2 lists the advantages of CR and DR, including all the benefits of digital images that can be electronically processed, manipulated, distributed, displayed, and archived. The superior contrast resolution of the digital modalities can compensate, in many cases, for the lesser spatial resolution as compared with screen-film. Both CR and DR can be used for the digital image acquisition of projection radiography examinations into a PACS.
As for any digital image acquisition device, CR or DR would be the first point of entry into a PACS. Errors may propagate from here, with the quality of the PACS output being directly dependent on the quality of the signal in. In addition to image quality, essential features for successful clinical implementation of CR or DR systems for a PACS include the following. DICOM conformance of the modality is essential and includes compliance with the image data and header format, as well as the DICOM communication protocol. Equally critical is interfacing to the RIS-HIS. Integration of the CR/DR system with the RIS-HIS can reduce human errors on patient demographic information input and improve efficiency. Ease of integration of the device into the daily workflow routine, and simplicity and robustness of the user interface are very important. Reliability, fault-tolerance, and capabilities for error tracking are also major issues to consider, as are device speed and performance.
As a result of CR’s convenient workflow and portability, as well as its wide exposure latitude and relative forgive-
Table 2. Summary of Advantages of CR and DR Systems
Produce digital images capable of being electronically processed, manipulated, distributed, displayed, and archived.
Large latitude systems allowing excellent visualization of both soft tissue and bone in the same exposure image.
Superior contrast resolution can compensate for lack of spatial resolution.
Decreased retake rates.
Potential cost savings if film is eliminated.
Improved radiology department workflow with elimination of film handling routines.
PICTURE ARCHIVING AND COMMUNICATION SYSTEMS |
345 |
|
|
Table 3. Summary of Future Trends in Image Acquisition |
|
|
|
|
|
Image Matrix Size |
" |
|
Image Quality |
"" |
|
Spatial Resolution |
" |
|
# Image Slices |
""" |
|
Size of Imaging Examinations |
""" |
|
Size of Devices |
## |
|
Portability of Devices |
" |
|
Cost of Devices |
# |
|
% of Image Devices that are Digital |
""" |
|
% of Image Acquisition that is Digital |
"" |
|
(Elimination of Film) |
|
ness of exposure technique, CR can improve the quality of images in difficult imaging situations, such as in portable or bedside examinations of critically ill or hospitalized patients, and enable decreased retake rates for improper exposure technique. As such, CR systems have been successfully used in the ICU setting, in the ER or trauma center, as well as in the OR. CR can also be cost effective for a high volume clinic setting, or in a low volume site as input to a teleradiology service. Cost savings and improved radiology departmental workflow can be realized with CR and the elimination of film (37).
Technological advances in CR hardware and software have contributed to the increased acceptance of CR as the current counterpart to conventional screen-film projection radiography, making the use of this modality for clinical purposes more widespread. CR is compatible with existing X-ray equipment, yet separates out the functions of image acquisition or capture, image display, and image archival versus traditional screen-film, in which film serves as the image detector, display, and storage medium. This separation in image capture, display, and storage functions by CR enables optimization of each of these steps individually. Potential expected benefits are improved diagnostic capability (via the wide dynamic range of CR and the ability to manipulate the data through image processing) and enhanced radiology department productivity (via networking capabilities for transmission of images to remotely located digital softcopy displays and for storage and retrieval of the digital data).
DR devices have more efficient detectors, offering direct energy conversion of X ray for immediate readout. The higher DQE may enable DR to produce high quality images at a lower radiation dose to the patient. These detectors have low noise and good spatial resolution, wide latitude, and all the benefits of digital or filmless imaging. However, cost is still high because detector production is difficult and expensive, and DR is a one-room-at-a-time detector. DR may be cost-effective in high volume settings with constant high patient throughput (37).
However, meeting the cost competitiveness of screenfilm systems is difficult unless film printing is eliminated from the cost equation. DR may be preferable for imaging examinations requiring very high quality, such as in mammography, upright chest exams and bone work. DR devices integrated into table and wall buckeys are now making these devices highly efficient for emergency department trauma cases.
346 PICTURE ARCHIVING AND COMMUNICATION SYSTEMS
Future improvements in image processing algorithms, with a better understanding of optimum display settings for soft copy viewing, have the potential to greatly facilitate and standardize softcopy reading of digital projection radiographs, and further the acceptance of CR and DR in the clinical arena. It is likely that CR and DR devices will coexist for some time.
Future Trends in Image Acquisition. Although the types of imaging modalities will probably not change all that much in the next several years, the anticipated future trends in image acquisition for digital radiology and PACS include changes in the image dataset sizes, changes in the imaging devices themselves, and improvement in image processing for softcopy display of digital images.
Image Data Sets. No new types of imaging modalities are foreseen for the near future. However, it is anticipated, and has to a certain extent already begun, that the image datasets acquired from the existing modalities will increase in overall study file size, in some cases dramatically. For example, many radiology departments have begun installing multiple detector array or multislice CT scanners that tend to generate a greater number of individual images than do the single detector array scanners because the slice thickness in helical acquisition ( 0.75 mm) versus the single detector arrays ( 7– 10 mm), and the clinical imaging protocols used, as well as the increasing clinical utility of 3D image display representations.
Image matrix sizes for the digital projection radiography devices (CR and DR) have gone up from roughly from one and two thousand square matrices to four by five thousand pixels squared for mammography applications. The increased sampling was done to improve the spatial resolution. Most laser film digitizers can now vary their spot sizes from 200 mm down to 50 mm, greatly improving the inherent spatial resolution of the resulting images of the scanned analog film, with a concomitant increase in file size.
The bit depth representation of gray-scale pixel values has also increased from 8 bits to 10, 12, and 16 bits, and color images are stored as 32 bit or 4 byte per pixel data files. Further, the addition of post-processing results or slice reconstructions, and cinegraphic sequences to the image dataset, while improving the overall quality of the image, may greatly increase the amount of data to be acquired into a PACS.
Devices. While image datasets and file sizes are getting larger, the imaging devices themselves will continue to get smaller in physical footprint, which has been seen most dramatically with the CR devices, going from requiring roughly 36 m2 of floor space and special electrical power and cooling, to desktop devices that can be placed in most any location. CT and MRI devices are also becoming smaller in size, more portable, and more robust. Hopefully, these devices will continue to become less expensive. Terahertz imaging currently used in aerospace applications may become developed for uses in imaging humans for medical purposes. These devices acquire images at 0.25
and 0.3 THz, creating a binary (two-color) picture to contrast between materials with different transmission and reflection properties. The main advantage of a terahertz imager is that it does not emit any radiation and it is a passive camera, capturing pictures of the natural terahertz rays emitted by almost all objects.
Image Processing. An important area of increased attention continues to be image processing capabilities for softcopy image display. Future processing techniques will most likely go above and beyond the simple window and level (or contrast and brightness) manipulation techniques. These post-processing algorithms are currently available and tunable at the imaging modality, or accompanying modality acquisition workstation, but may, in time, be manipulable in real-time at the display station. Stand-alone 3D workstations are becoming more common. Efforts to embed advanced processing and visualization in the PACS workstation will ultimately allow real-time processing to be performed by the radiologist or even the referring clinician.
Image compression is currently being debated, but may, in time, be available at the modality to reduce image transmission time and archival space. Some techniques, such as the wavelet transform, may become more widely used not only as a compression technique, but also for image enhancement at the imaging devices.
In time, it is anticipated that the percentage of all imaging devices used by health-care enterprises that are digital in nature will increase greatly. Further, the percentage of digital image acquisition from the devices that are capable should increase, decreasing the amount of film used as an acquisition, display, and archival medium.
Medical Image Archival
Digital image archives were once thought of as costly inefficient impediments to moving toward PACS and digital imaging departments (38). However, current trends in archival technology have shown the cost of digital storage media decreasing steadily with capacity increasing, whereas analog devices such as paper and film continue to increase in overall cost (39). Improvements in storage devices along with the use of intelligent software have removed digital archives as a major stumbling block to implementing PACS. The following tutorial on electronic archival technologies for medical images includes a discussion of available digital media, PACS system architectures, and storage management strategies.
Digital image archival can be more efficient than the manual data storage of the traditional film file room. A study of image examination retrieval from a PACS versus a film-based system showed statistically significant reduction in times for the digital method, in many cases down from hours to minutes (40). The improved retrieval times with PACS were particularly striking for studies between six months and one year old, and for studies greater than one year (40).
An informal survey of 75 radiologists operating in a traditional film-based radiology department found that 70% experienced delayed access to films, which caused them and their staff money in terms of decreased efficiency
(41). Rarely did this delayed access to films result in repeated or unnecessary studies, or result in longer hospital stays. However, inaccessible or lost films did result in time spent, often by the radiologist or clinician, looking for films.
Digital archives are generally less people-intensive, eliminating the physical handling of films, and are, therefore, less expensive and less subject to the errors in filing and lost films that often plague film stores. Electronic archives can improve the security of stored image data and related records, assuring no loss of exam data while offering simultaneous case availability to many.
Digital archives must have an intelligent patientcentric system database interface to enable easy retrieval of imaging examinations. They should conform to the DICOM standard format and communications protocol by being able to accept and return DICOM format files. Many archive systems reformat the data once inside the storage device to a more efficient schema appropriate for the specific archive architecture.
Medical image data files are large compared with textbased clinical data, and are growing in size as new digital applications prove clinically useful. A single view chest X ray, for example, requires approximately 10 MB of storage space. With the expanding availability of multidetector CT scanners and increasing use of magnetic resonance angiography examinations, thousand-slice studies are not uncommon. Imaging activity continues to increase significantly as it becomes a key diagnostic triage event, with most diagnostic imaging departments showing an increase in overall volume of cases. A typical 500 bed health-care enterprise performing approximately 200,000 examinations, for example, can generate on the order of 5–6 terabytes (TB) of data per year (42).
Compression can be used to reduce both image transmission time and storage requirements. Note that compression that can be achieved via hardware or software also occurs clinically (i.e., not all images of a study are filmed). Lossless (or bit-preserving) compression at 2:1 is done by most PACS archive systems already. Lossy or non-bit- preserving compression, by definition, does not provide an exact bit-for-bit replica of the original image data on decompression. However, studies have shown that numerically lossy compression can produce visually lossless images at compression ratios of 5:1 to 30:1 depending on modality (43–45). Compression at these levels can achieve much greater space savings and appear to be of adequate image quality for image comparison and review of prior studies. For perspective, without compression only 50 twoview digital projection X-ray examinations at approximately 10 MB per image can be stored on a 1 gigabyte (GB) disk. With compression at 25:1, approximately 1250 examinations can be stored on a 1 GB disk.
Digital Archival Media. The digital storage device media used in PACS today include computer hard drives or magnetic disks, RAID disks (redundant array of inexpensive disks), optical disks (OD), magneto-optical disks (MOD), and tape. Newer technologies such as digital video disks (DVD) and ultra-density optical (UDO) disks are being introduced. The properties and attributes of each
PICTURE ARCHIVING AND COMMUNICATION SYSTEMS |
347 |
|||||||
|
Capacity -performance characteristics |
|
|
|||||
|
|
100 seconds |
|
|
|
|
||
|
|
|
|
|
|
|
|
|
|
100,00 |
|
|
|
|
Tape |
|
|
|
|
|
|
|
|
|
|
|
|
0 |
|
10 seconds |
|
|
|
|
|
|
|
|
|
Optical disk |
|
|
||
|
|
|
|
|
|
|
||
|
10,000 |
|
|
|
|
|
|
|
ms) |
1,000 |
|
|
|
|
|
|
|
(in |
|
|
|
|
|
|
|
|
time |
100 |
|
|
|
|
|
|
|
Access |
10 |
|
|
|
|
|
|
|
|
|
|
|
|
|
|
|
|
|
|
|
|
Magnetic |
|
|
|
|
|
1 |
|
|
disk |
|
|
|
|
|
0.1 |
|
|
|
|
|
|
|
|
0.01 |
|
|
|
|
|
|
|
|
|
10 |
102 |
103 |
104 |
105 |
106 |
|
|
1 |
|||||||
Capacity (in GB)
Figure 10. Graph of capacity versus performance characteristics of digital archive media.
storage device, including capacity, performance, and relative cost, are compared and summarized below. Figure 10 graphs the capacity versus performance characteristics of the various digital archive media widely used in PACS. Table 4 summarizes the relative cost of digital archive media per capacity or number of GB that can be stored per dollar, in addition to typical capacities and retrieval times.
Magnetic Disk (MD). The standard computer hard drive or magnetic disk (MD), also known as a direct access storage device (DASD), is the fastest medium from which to retrieve data. Retrieval times are on the order of 1 to 50 milliseconds (ms). However, MDs have the lowest capacity, typically hundreds of MB to hundreds of GB, and the highest cost per amount of data storage of all the archival media used in PACS today, although prices are continuing to decrease rapidly. As a result of the relative high cost in the past, MDs have historically been used for online local storage at the display workstation where fast access was required, yet large capacity was not cost-effective. Today, it is becoming cost-effective to use spinning media for all stages of storage – the trend toward everything-on-line.
Redundant Array of Inexpensive Disks (RAID). RAID devices consist of multiple MDs with high performance and larger capacity (now TB worth per device). These devices can offer redundancy, lessening the concerns with a single point of failure, and have hot-swapable components that can be replaced as needed without bringing the entire archive system down.
RAID has traditionally been used for ‘‘near line,’’ intermediate short-term storage, or clinical-operational storage cache to minimize the number of transactions hitting the deep or long-term archive. It is becoming cheap enough per
348 |
PICTURE ARCHIVING AND COMMUNICATION SYSTEMS |
|
|
|
Table 4. Digital Archive Media Capacity, Retrieval Times, and Relative Costs per GB of Storage |
|
|||
|
|
|
|
|
|
|
|
Performance |
Cost per Capacity |
Archive Media Type |
Storage Capacity |
Retrieval Times |
(in Order of $ per GB) |
|
|
|
|
|
|
Magnetic Disk |
100s MB–10s GB |
1 to 50 ms |
$1.00/GB |
|
Optical Disk |
1 – 10s GB for TB devices |
s to min |
$0.40/GB |
|
Tape |
|
10s – 100s GB for 10s TB devices |
10s s to min |
$0.25/GB |
RAID |
|
10s–100s GB for 10s TB devices |
100–300 ms |
$10.00/GB |
DVD |
|
GB for TB devices |
s |
$2.50/GB |
UDO |
|
30 GB for 10s – 100s TB devices |
s to min |
$2.00/GB |
|
|
|
|
|
capacity to consider using RAID in larger configurations for high performance longer-term storage. In these configurations, a higher percentage of studies, perhaps accounting for several years or more, can remain available online for immediate access.
Optical/Magneto-optical Disk (OD/MOD). Optical disks and magneto-optical disks are of the removable spinning storage media class typically stored in an automated media movement device or jukebox giving them total device storage amounts equal to hundreds of times the media capacity. ODs and MODs have higher capacity than MDs, typically GB to tens of GB yielding hundreds of GB to tens of TB total device storage. They are lower cost per capacity than RAID, on the order of a half dollar per GB of storage. Optical disks are a slower medium than RAID, on the order of seconds to minutes for data retrieval in batch and random seek modes.
ODs are also known as WORM or write once, read many disks with data permanently written onto the disks. MODs are erasable reusable platters and are able to hold more data per unit than ODs. As a result of the slower performance and lower cost per capacity, ODs and MODs have traditionally been used for long-term permanent PACS storage.
Tape. Tape is also a removable storage medium typically kept in a jukebox or tape library. The magnetic tape type most often used for PACS is digital linear tape (DLT). It has very high capacity, tens to hundreds of GB for many TB per tape library, and low cost on the order of a quarter dollar or less per GB of storage. It is, however, a slower medium than MOD, for example, in random retrieval times because of its sequential nature. Tape performance is competitive with MOD for retrievals of large files, however, using very high batch read-write rates. Even random retrievals of very large files (on the order of 50 MB) can be transferred faster with DLT than with MODs. Tape has historically and is currently being used for disaster backup as well as for long-term permanent storage.
Newer Technologies
Digital Video Disk (DVD). Newer technologies, such as DVDs, appear promising but have failed to move significantly into the medical arena due to their high cost and slow performance. DVDs use dual-sided storage, thus achieving greater amounts of storage (GB) than MODs fairly inexpensively. However, the cost of the drives still remain quite high and the lack of a universal standard
read-write format currently limits the use of DVDs for PACS, although the DICOM standard is currently addressing this issue.
Ultra-Density Optical (UDO). Recently released ultradensity optical (UDO) disks use a blue laser recording technology to achieve much greater data storage densities, on the order of 30 GB capacity per disk, predicted to double within six months. UDO is a WORM disk technology with a 50 year lifespan and a current cost of approximately $2 per GB. Although just a first-generation device release in the medical arena (other fields including the defense industry have used UDOs), it may prove to be a useful technology for PACS.
A summary of capacity, performance, and relative cost of the types of digital archive media available today for PACS is given in Table 4. Figure 10 graphs the capacity versus performance characteristics of the MD, OD, and tape. Note that tape and OD are relatively similar in their tradeoff between capacity and performance.
Archival Strategies
Data Migration. Note that medical images have a life cycle in which, early on, quick access to the data is critical and is often needed by several people in many different locations simultaneously. After a patient has been treated and discharged, however, that same imaging study may rarely need to be accessed again, and if it is, taking minutes or even hours to retrieve it may be acceptable. This pattern of use suggests that hierarchical or staged archival strategies can be implemented for optimum cost-effective use of storage technologies, particularly for the older distributed PACS architectures.
The stages or terms of storage include online or local storage, shortor intermediate-term near-line storage, long-term or offline storage, and disaster recovery or backup storage. Online storage contains information that must be available to the user immediately at the display station and, therefore, requires high-speed access. As this performance is costly, online storage is usually reserved for clinically critical data needed during a single episode of current care (i.e., three days for outpatient clinical encounters and six days on average for a typical inpatient stay). The medium best meeting online local storage needs is the standard computer magnetic disk.
Short-term or near-line storage is used to provide relevant prior or historical imaging studies for comparison during a patient’s return visit. This method does not require immediate access, particularly if the data can be
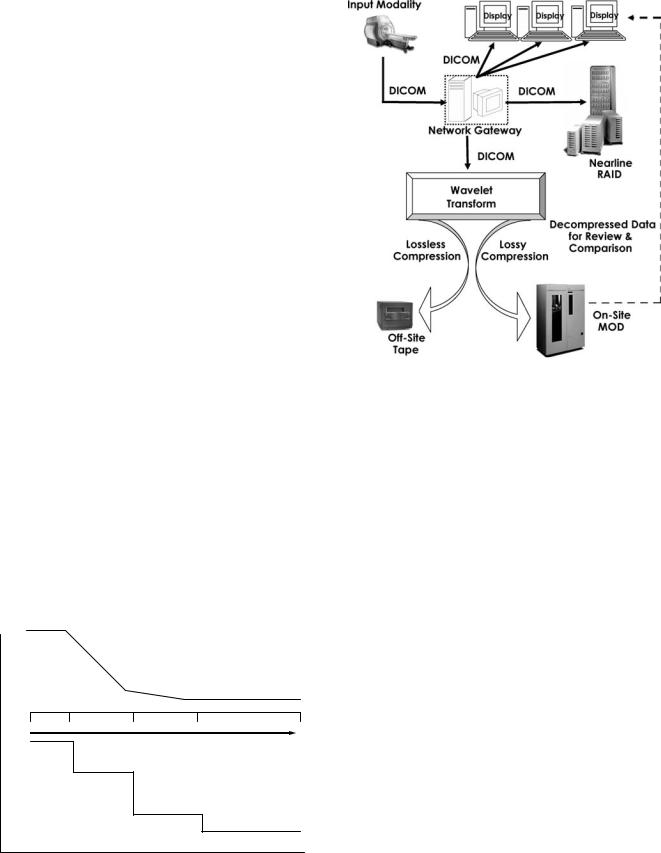
automatically prefetched with advanced notice of scheduled appointments. Note that most patients who do not return for continuing care within 18 months of the acute visit are unlikely to return at all. In other words, a large percentage of imaging examinations performed will never be re-reviewed after the original clinical episode, so slower access may be acceptable. As such, RAID devices work well as short-term or near-line storage, although RAID devices have nearly the high performance of a single magnetic disk but are more costly because of the controller and redundancy capabilities built in.
Long-term or permanent storage provides availability to data with advance notice for retrieval, especially when long-term storage is offline or on-the-shelf. Removable storage media devices such as OD, MOD, or tape jukeboxes are typically used for long-term storage due to their high capacity per cost characteristics. Long-term archives must cover an institution’s entire medico-legal storage requirements, which vary from state to state (i.e., 5 years for general adult studies, 21 years for pediatric studies, and life for mammograms and images with orthopedic appliances for Massachusetts).
The requirements for fast retrieval of images initially followed by slower retrieval later, if at all, suggests that different types of storage devices could be used over time to archive images with cost savings. As fast retrieval times grow less important, images could be migrated to less costly, higher capacity, slower storage devices, as diagramed in Fig. 11. Software is used to handle the movement of data from one medium to another, and the strategy makes the actual physical storage device transparent to the end user. Such a strategy is known as a hierarchical storage management (HSM) scheme.
Hierarchical Storage Management and Compression.
Note that data compression can be used to maximize the amount of online or near-line storage available to a PACS. Although the full resolution image data can be viewed originally for primary diagnosis, a losslessly compressed version can be sent off site to an inexpensive tape backup archive. The original data can also be wavelet lossy com-
High |
|
|
|
Retrieval Activity |
|
|
|
(Average per Hour) |
|
|
|
Low |
|
|
|
10 d |
6 mo |
3 yr |
7 yr |
High |
|
|
Study Age |
MD |
|
|
|
|
RAID |
|
|
Cost per Capacity |
|
|
|
|
|
OD |
|
Low |
|
|
Tape |
Figure 11. Migration strategy and retrieval requirements versus cost over time.
PICTURE ARCHIVING AND COMMUNICATION SYSTEMS |
349 |
Figure 12. HSM scheme. Image data is viewed at its original content for primary diagnosis, losslessly compressed for the offsite legal record on tape, and wavelet lossy compressed for the onsite near-line storage on MOD for review and historic comparison.
pressed and stored on a large RAID device for maximum cost-effective online storage and retrieval of images for review and comparison (44). This scheme is depicted in Fig. 12.
An HSM scheme using short-term archival of uncompressed DICOM data for primary diagnosis, in an onsite RAID, coupled with a very deep long-term archive of diagnostic quality wavelet compressed data in an onsite optical jukebox, cost effectively maximizes online storage for immediate image retrieval. Diagnostically lossy compressed data (at ratios of 25:1 for CR, 10:1 for CT, and 5:1 for MCI) grows the onsite jukebox by 10 times row, depending on the mix of cases, making 20 or more years available online (44), which effectively maintains the entire legal record worth of original plus two relevant prior examinations all online. Note that no large-scale facility has implemented this schema, preferring to accommodate their needs by purchasing more hardware. Also it is unclear what the medico-legal ramifications would be in using lossy compressed images for historical comparison.
A hierarchical storage management scheme such as this provides a solution for maximum intermediate storage and retrieval through the use of onsite lossy compression and offsite tape backup of losslessly compressed data for the legal record and disaster recovery of data. The use of compression in this HSM scheme provides a cost-effective, high performance archive system. This HSM can be tailored to a given health-care enterprise’s need to provide clinically and economically beneficial digital archival of medical images.

350 PICTURE ARCHIVING AND COMMUNICATION SYSTEMS
Other Scalable Solutions: EOL, NAS, SAN, CAS.
Everything-On-Line (EOL). With the dramatic decline in the cost and increase in capacity of RAID devices, it may become feasible to have all studies with their relevant prior examinations accessible online, which is particularly important for centralized or cacheless PACS architectures. On the other hand, imaging volume and study sizes continue to increase and may continue to overburden archive technologies. Thus, perhaps the intelligent use of the hardware and software technologies currently available through data migration schema is a sound strategy.
Networked-Attached Storage (NAS). Networked-Attached Storage (NAS) involves automated storage on a directaccess but separate local drive. NAS uses the existing local area network (LAN) to connect storage devices and the systems requiring data. A NAS server is optimized to perform file-sharing functions without the application processing overhead of typical network file servers, which enables files to be served rapidly to its clients. Performance is affected by the LAN capabilities and system configuration.
Storage Access Networks (SAN). Storage Access Networks (SAN) are dedicated networks that link storage devices and servers, creating an independent directly accessible pool of storage. SANs typically use fiber channel (FC) technology for high speed serial interconnections, usually over optical fiber. This network can provide simultaneous access from one or many servers to one or many storage devices and eliminates potential loading on the LAN.
Content-Addressed Storage (CAS). In Content-Addressed Storage (CAS) systems, data is stored and retrieved based on unique content ID keys. As medical image data is ‘‘fixed content’’ in that its information needs to be stored but cannot (typically) be altered in any way, CAS may prove useful. CAS associates a digital fingerprint, ID, or logical address to a stored element of data providing content security and integrity. The object-oriented nature of CAS could be exploited to improve database searchability.
Application Service Provider (ASP). An Application Service Provider (ASP) approach to medical data archival may be practical for some small entities. This strategy, in which an outside vendor provides services for storage using their hardware and software, has been around for several years. The advantages include less capital requirements for onsite hardware, technology obsolescence protection, maintenance and migration shifted to the ASP vendor, and offsite data backup. Disadvantages include potential vulnerability in performance and long-term viability of the ASP vendor, security issues, and potential high cost of service, particularly for large-volume sites.
Computer Networking
Computer networks enable communication of information between two or more physically distinct devices. They provide a path by which end user radiologists and clini-
cians sitting at one geographic location, for example, can access radiological images and diagnostic reports from a computer at another location. A private locally owned and controlled network (i.e., within a building or hospital) is called a LAN, whereas a network used outside of a local area is known as a wide area network or WAN. A WAN uses an external service provider and usually has lower bandwidth services than LANs. Intranet communication refers to communication across a private limited-access LAN. Internet communication is across public shared-access WANs.
Signals are transmitted via either bound media such as over cables or unbound broadcast media. Analog communications systems encode information into a continuous wave form of voltage signals, whereas digital systems encode the data into two discrete states or bits, either ‘‘0’’ or ‘‘1’’. The bits are packaged to form bytes, words, packets, blocks, and files based on a specified communication protocol. These communications standards give detailed specifications of the media, the physical connections between devices, the signal levels and timings, the packaging of the signals, and the software needed for the transport of data (46).
Serial data transmission sends digital signals one bit at a time over a single wire; the single bit stream is reassembled at the receiving end of transmission into meaningful byte-word-packet-block-file data (46). Parallel data transmission uses multiple wires to transmit bits simultaneously and, as such, provides increased transmission speeds. Synchronous communication is used in applications that require maximum speed and is carried out between two nodes that share a common clock. Asynchronous communication relies on start and stop signals to identify the beginning and end of data packets (46). An example of this technology is asynchronous transfer mode (ATM) technology.
Hardware. Important networking infrastructure considerations include bandwidth, or how much data can be transferred per period of time; latency, or how long the trip takes; topology or network segmentation, which describes the path data takes; and reliability and redundancy. Table 5 lists different types of network bandwidths or speeds available, in bits per second (bps), along with example transmission times for a single 10 MB CR digital projection radiograph. Note that over a telephone modem it would take approximately 24 minutes at best to transmit a single 10 MB image, whereas over Fast Ethernet it would
Table 5. Network Bandwidths and Example Image Transmission Times
|
Maximum |
Min Transmission |
|
Bandwith (bps) |
Time for 10 MB CR |
|
|
|
Modem |
56 kbps |
23.8 min |
T1 Line |
1.54 Mbps |
52 s |
Ethernet |
10 Mbps |
8 s |
Fast Ethernet |
100 Mbps |
0.8 s |
ATM |
155 Mbps |
0.52 s |
Gigabit Net |
1 Gbps |
0.08 s |
|
|
|

Bus
Ring
Hub/Switch
Star
Figure 13. Network topologies typically used in PACS: bus, ring, and star.
be only a fraction of a second. LANs can consist of low speed Ethernet, medium speed Fast Ethernet, or fast speed Gigabit infrastructure. WANs can consist of a range of digital service speeds from slow telephone modem to medium speed T1 lines to fast ATM. Transmission speeds track with cost.
The most common network topologies used in PACS include bus, ring, and star configurations. These are diagramed in Fig. 13. Bus topologies commonly use Ethernet and have the advantage of network simplicity, but the disadvantage of upper-level bottlenecking and difficult to identify channel failure. The ring topology uses fiber distributed data interface (FDDI) or high speed ATM SONET (synchronous optical NETwork) ring technology. Ring topologies offer simplicity and no bottleneck, but, in a single ring, if the channel between two nodes fails, then the network is down. The star or hub topology uses high speed Ethernet or ATM switching and offers network simplicity but a bottleneck as well as a single point of failure at the hub or switch.
The physical media or cabling that makes up PACS networks varies from telephone wires to unshielded twisted pair (UTP) copper cabling, also referred to as CAT5 or CAT3, depending on the quality of the wiring, to coax cable (also known as thinnet or 10Base5), and fiber optic cabling. Fiber optic cabling can transmit more data over longer distances than conventional cabling by using light or lasers instead of electrical signals, but are of relatively high cost. The network interface card or NIC
PICTURE ARCHIVING AND COMMUNICATION SYSTEMS |
351 |
connects a computer to the physical media or cabling of the network. A unique address, the Media Access Control or MAC address is derived from the NIC. This address is used to identify each individual computer on a network.
A hub or multiport repeater connects multiple computers on a network. A bridge isolates network traffic and connects two or more networks together. The bridge listens to all network traffic and keeps track of where individual computers are. A properly located bridge can take a large congested network segment and reduce the number of data collisions, improving performance.
A switch or router can scale a small-bandwidth network to a large bandwidth. Switches tend to be protocolindependent, whereas routers are protocol-dependent. Routers or relays are used in large networks because they can limit the broadcasts necessary to find devices and can more efficiently use the bandwidth. Routers, sometimes referred to as gateways, while beneficial in large complicated environments, can unfortunately slow traffic down because it has to examine data packets in order to make routing decisions. Bridges work much more quickly because they have fewer decisions to make. Switches have revolutionized the networking industry. They look at only as much of the data packet as bridges look at and are, in a sense, bridges with many interfaces. Switching incorporated with routing helps make network bottlenecks easier to remove. Some switches are used in the core of a network whereas others are used to replace hubs. Figure 14 shows example network switch and router devices.
Figure 15 diagrams an example PACS network, the one used at the University of California at San Francisco Medical Center for transmission of radiological images and related data around the hospital LAN and the health-care center WAN. The image acquisition devices, including the various modalities, such as CT and magnetic resonance scanners, are at the top of the diagram. As image acquisition devices are only capable of connecting to a network with Ethernet speeds, a switch or router is used to take scanner outputs over 10 Mbps in and transmit that data to the PACS servers using faster speeds of 100 Mbps. Images are sent to the display stations using the fastest network available. The circle in the upper-right corner of the diagram represents the UCSF Radiology WAN over which images and information are sent to other health-care facilities over 155 Mbps ATM.
Figure 14. Example network switches and routers.

352 PICTURE ARCHIVING AND COMMUNICATION SYSTEMS
Figure 15. Example PACS network used at the University of California at San Francisco Medical Center for radiological images and related data.
Networking Software. The International Standards Organization (ISO) developed the Open Systems Interconnect (OSI) model as a framework to facilitate interoperation of computer networks from the application layer (i.e., the image viewer) all the way down to the physical layer (i.e., the wires). The ISO/OSI communication protocol stack is shown in Fig. 16. It consists of seven layers (46). Each layer in the stack is interested only in the exchange of information between the layer directly above or directly below, and each layer has different and well-defined tasks.
The top or seventh layer of the ISO/OSI stack is the Application Layer, which provides services to users. The Application Layer knows the data it wants to transmit and which machine it wants to communicate with. The sixth layer is the Presentation Layer, which takes care of data
transformation such as encryption, compression, or reformatting. Layer five is the Session Layer, which controls applications running on different workstations, which is followed in the stack by the fourth or Transport Layer, which transfers data between end points and is handled here with error recovery. Layer three is the Network Layer, which establishes, maintains and terminates network connections. The second layer is the Data Link Layer, which handles network access, collision detection, token passing, and so on, and network control of logical links such as sending and receiving data messages or packets. The bottom layer or layer one is the Physical Layer corresponding to the hardware layer or the cable itself.
Also diagramed in Fig. 16 are the stacks for TCP/IP (Transmission Control Protocol/Internet Protocol) widely
Figure 16. Communication protocol stacks for ISO/OSI and TCP/IP.
ISO/OS |
|
TCP/IP |
|
Int. Standards |
|
Transmission Control |
|
Organization/ |
Specific Application |
Protocol/ Internet |
|
Open Systems Application |
Protocol |
||
API |
|||
Interconnection |
|
||
(DICOM) |
|
||
Presentation |
Process |
||
|
|||
Session |
Associate |
|
|
|
Host |
||
|
Hostname & IP |
||
Transport |
Address |
to |
|
|
|
Host |
|
Network |
IP Address |
|
|
123.321.45 |
Internet |
||
|
ping |
||
|
Network |
||
|
|
||
|
|
Access |
|
DataLink |
|
Layer |
|
Physical |
Wire |
Physical |
|
|
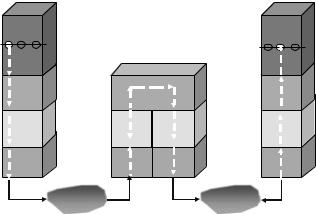
used in PACS applications. TCP/IP has four layers but is shown here as five layers, with the lowest level split out into two layers for the network access and physical layers. The top layer is called the Process Layer, and it corresponds to the Application and Presentation Layers in the ISO/OSI model. Such an application in the PACS world might be the DICOM communications protocol application. The layer below is the Host-to-Host or Transport Layer, followed by the Internet Layer and then the Network Access Layer, which encompasses Ethernet, token ring, for example, and the Physical or media Layer. To determine if two devices in a PACS network are communicating, the physical connection is tested. Using the unique IP address of the devices, a ‘‘ping’’ command will validate whether the one computer can reach the other over some network path. The TCP/IP hostname of the computer relates the unique IP address of the device to its DICOM AE (application entity) title so that computers can communicate using this protocol.
Figure 17 demonstrates the path messages take from one subnet, through a router, to another subnet. The process starts at the top of the stack in host A, where a DICOM port is opened. The information travels down the stack through the TCP Host-to-Host Layer to the Internet (IP) Layer and out the Network Access Layer across the Physical Layer. Messages then pass from the Physical Layer up the stack to the Network Access Layer, then the Internet Layer, to the Host-to-Host or Transport Layer, and, finally, a port is opened in the top Processor Application Layer.
Security and Redundancy. Advances in networking and communications devices have greatly facilitated the transfer of information between computers all over the world. For the secure transmission of private information such as clinical images and patient data, additional technologies are put into place to make the Internet a safe medium. The Health Insurance Portability and Accountability Act (HIPAA) of 1996 required the Department of Health and Human Services to establish national standards for electronic health-care transactions and national identifiers for providers, health plans, and employers. It also addresses
Host |
|
|
Host |
Process |
|
|
Process |
Port |
|
|
|
|
|
Port |
|
|
|
|
|
TCP |
Router |
|
|
|
|
TCP |
|
IP |
IP |
|
IP |
|
|
||
Network |
Network |
Network |
Network |
Access |
Access |
Access |
Access |
Protocol1 |
Protocol 1 Protocol2 |
Protocol 2 |
|
Physical |
Physical |
Physical |
Physical |
|
Network |
|
Network |
Figure 17. Connecting subnets via a router and DICOM.
PICTURE ARCHIVING AND COMMUNICATION SYSTEMS |
353 |
the security and privacy of health data, such that adopting these standards will improve the efficiency and effectiveness of the nation’s health-care system by encouraging the widespread use of electronic data interchange in health care.
Firewalls are protocol-dependent devices often used to secure a network by filtering traffic based on rules and policies. Intrusion detection systems (IDS) are another form of security device that uses policy-based monitoring, event logging, and alarms and alerting messaging to protect a network. Virtual Private Networks (VPNs) protect data by encrypting the information at the source device and decrypting it at the destination device. VPN clients are often used to securely access a hospital network for a location outside its LAN. A path can be created through the firewall or directly to a specific server enabling transmission of data.
PACS networks have become mission-critical devices in the transmission of digital medical images in and among health-care enterprises. As such, the networks must be highly available and have fault-tolerance mechanisms built in. Requirements for high availability networks include having redundant technology with automatic failover when devices are down. Redundant media and multiple paths should exist for the same information to get from one place to another. Redundant power for the devices involved is generally considered routine, as is proactive monitoring and problem mitigation with automated faultdetection processes in place.
Medical Image Display
Hardware – Monitors: CRT versus LCD. The choice of diagnostic display monitors was relatively straightforward for early adopters of PACS. Hardware was of a single type—cathode ray tube (CRT) technology—and was usually oriented in portrait mode emulating the shape of film. Monitors had high brightness, typically 200 to 300 candelas per square meter (cd/m2), relative to other computer and television monitors, and high refresh rates of greater than 72 Hz to reduce flicker visible to the human eye. The devices themselves were physically large, heavy, and expensive. They generated noticeable quantities of heat while consuming relatively high amounts of power, and their display quality degraded quickly in time, requiring frequent monitor replacement.
Early medical-grade monitors were available in two spatial resolutions (high and low) reflecting their pixel matrix sizes (2 k or 2048 columns by 2500 rows and 1 k or 1024 columns by 1280 columns, respectively). Medium resolution 1.5 k monitors of 1500 columns by 1500 rows were later added to the mix. As a result of the exponentially higher cost of 2 k monitors as compared with 1 k monitors, radiology departments typically had a combination of a few strategically placed high resolution displays and many low or medium resolution displays. The American College of Radiology (ACR) recommended that 2 k monitors be used for primary diagnosis of digital projection radiographs because a single image could be displayed per monitor in its full inherent acquired spatial resolution. The crosssectional modalities with slice matrix sizes of 512 by 512
354 PICTURE ARCHIVING AND COMMUNICATION SYSTEMS
for CT and 256 by 256 for MRI were considered adequately displayed on 1 k monitors. As display application software and graphical user interfaces (GUIs) improved, many radiologists became comfortable reading from 1 k monitors even for projection radiography, as long as the images were acquired at their full spatial and contrast resolutions and the GUIs allowed for easy manipulation, magnification, and comparison of images.
Today, a richer array of hardware technologies exist for the purposes of displaying digital medical images. Unfortunately, no formally defined standards or specification guidelines currently exist to clarify choices of monitors for users. The different display devices available today and the specifications to consider when purchasing monitors for use in radiological imaging are described. An explanation of the monitor types including CRTs, activematrix liquid crystal displays (AM-LCDs), and plasma technologies is given along with a discussion of spatial resolution capabilities and requirements, contrast resolution and monitor luminance, the orientation or shape and number of displays necessary, and a comparison of color versus monochrome or gray-scale monitors. Device calibration and quality assurance practices are also addressed.
Two technology types of hardware displays are currently used in medical imaging, the half-century-old mature cathode ray tubes and what the popular literature refers to as flat-panel technology, of which several types exist (47). Of the two broad categories of flat-panel displays, one filters reflected light or light from a source behind the filter, whereas the second type creates light by exciting a phosphor. Note that the term flat panel is not meant to refer to the face of the monitor as some CRTs have a flat face (48). Rather, it refers to the thin-film transistor array panel that addresses each pixel.
CRTs produce light by exciting a phosphor-luminescent coating with a focused electron beam. Light is generated in an emissive structure, where it diffuses in a controlled manner forming the displayed image. The highest spatial resolution CRT monitors available have a display area of 2048 by 2560 or roughly 5 million (mega) pixels (Mpixels). They come in lowand high-bright versions of 50–60 FL and 100 FL or greater, respectively. High and low resolution (2 k and 1 k) monitors typically come in the portrait mode with a 9:16 or 3:4 aspect ratio emulating the shape of film. Most medium resolution CRTs (1.5 k) are square or in the landscape mode with an aspect ratio of 16:9 or 4:3. Choice of portrait versus landscape monitor shape is a function of personal user preference, with no technical issues bearing on the issue.
The flat-panel display type predominantly used in medical imaging is the active-matrix liquid crystal display (AM-LCD). LCDs use a transistor-driven matrix of organic liquid crystals that filter reflected light. LCDs use a lightmodulating as opposed to a light-emitting mechanism for creating the display image. Polarization controls the light intensity such that the maximum intensity is perpendicular to the LCD panel. Consequently, this technology suffers from marked variations in luminance and contrast depending on viewing angle (47), which is the off-axis viewing or angle-of-regard problem in which images can appear quite different if viewed from different angles or heights above
and below the center axes of the screen. Newer LCD designs have a more uniform luminance and contrast profile within a larger viewing angle cone (some as high as 1708). Users should inquire about the horizontal and vertical viewing angle capabilities and, better yet, ask the vendor for a demonstration monitor for clinician testing. LCDs typically have the capability to display in portrait and landscape modes.
Plasma display panels (PDPs) are currently being developed largely for high definition television (HDTV) viewing with 37 inch or larger screens. A current passed through ionized gas (Ne-Xe) contained between a pair of glass layers causes emission of ultraviolet light that excites visible light-emitting phosphors to produce the display image. PDPs are very expensive and have roughly the same number of addressable pixels as 17 inch LCDs, can be hung on a wall, have a wide viewing angle with no loss of quality, and have high brightness but relatively slow response time (48). They are not used currently in medical imaging because of their high cost, slow refresh rates, ghosting artifacts, and contrast limitations. Other types of displays, such as field-emissive display (FEDs) and organic light-emitting diodes (OLEDs), are undergoing heavy developmental efforts but are not yet viable for medical imaging display purposes (48).
Although the spatial resolution terminology used for both CRTs and LCDs is based on the device pixel matrix dimensions — 1 k to 2 k for CRTs and 3, 5, and 9 Mpixels for LCDs — not all monitors are created equal. For example, 1 k and 2 k CRT monitors tend to have standard diagonals so that the larger pixel matrix size connotes smaller pixel size and, hence, better spatial resolution capabilities, and all 1 k monitors have had equivalent spatial resolution, as did all 2 k monitors, which is not the case for LCD displays. For example, 3 Mpixel monitors come with different sized diagonals, that is, different physical sizes such that the physically bigger monitor actually has larger pixel size and hence poorer spatial resolution. Users need to understand what the pixel or spot size is, because it directly reflects spatial resolution and perception of fine detail, and not necessarily choose the largest screen. Pixel size can be determined from the physical screen size, typically given as a display area diagonal in inches and total pixel count or horizontal and vertical matrix resolution. Often, vendors give the device pixel density or pixel pitch spacing and, to confuse the issue, it is often given in millimeters. As for comparison between CRT and LCD monitors, the 1 k CRTs at 1024 by 1280 correspond to 1 Mpixel monitors, 1500 by 1500 correspond to 2 Mpixel monitors, and 1760 by 1760 correspond to 3 Mpixel displays. The 2 k or 2048 by 2500 CRTs correspond to the 5 Mpixel LCD. The recently introduced 9 Mpixel LCD display has 200 pixels per inch on a 22 inch diagonal screen.
The brightness of a monitor or its luminance affects perceived contrast or the number of discernable gray levels. Studies have shown that diagnostic accuracy increases as monitor luminance increases. To gain a perspective on luminance values, the typical lightbox or alternator used to display film is on the order of 400 to 600 FL (1360 to 2040 cd/m2), whereas the standard PC color
monitor is roughly 20 to 40 FL (68 to 136 cd/m2). An LCD color monitor has 65 to 75 FL (221 to 255 cd/m2) monitor luminance, whereas the low-bright medical-grade CRT monitors have 50 to 60 FL (170 to 204 cd/m2) and the high-bright CRTs have 100 FL (340 cd/m2) or greater monitor luminance. Among the device specifications reflecting monitor brightness and affecting contrast resolution are the monitor and display card bit depth (typically 8 bits for 256 potential gray values) and the monitor dynamic range or contrast ratio reflecting the maximum discernable luminance over the minimum, with typical values of 600:1 or greater.
In comparing CRT versus LCD display technologies, the advantages of LCD over CRT monitors include better stability for longer device lifetime. The change in brightness of standard LCD monitors has been measured at less than 0.5% per month (47). LCDs are not prone to the geometric distortion typical of CRTs, they tend to consume less power, and this have reduced sensitivity and reflection artifacts from ambient room lighting. Disadvantages of LCD monitors versus CRTs include the afore-mentioned off-axis viewing or angle-of-regard distortion of LCDs, backlight instabilities, liquid crystal fluctuations with temperature, and manufacturing defects creating dead or nonresponsive pixel areas.
Receiver Operating Characteristic (ROC) studies are currently the best methodology available to compare monitor quality and associate it with reader performance, that is diagnostic accuracy, sensitivity, and specificity. Numerous clinical studies have been performed, most showing no significant difference between diagnostic performance on CRTs and LCDs. Recent studies representative of CRT versus LCD comparison for radiological diagnosis include one that examined brain CTs for identifying early infarction (49) and the other looked at CRs of the chest for the evaluation of interstitial lung disease (50). The CT ROC study showed no statistically significant differences in diagnostic performance between a 21 inch monochrome CRT monitor with a pixel matrix of 1280 by 1600 and a brightness of 175 FL versus an 18 inch color LCD monitor with a pixel matrix of 1024 by 1280 and a luminance of 55 FL, when 10 radiologists were asked to rate the presence or absence of disease on a 5 point scale. Similarly, an ROC study comparing the efficacy of a 5 Mpixel CRT display versus a 3 Mpixel LCD for the evaluation of interstitial lung disease in digital chest radiography showed no statistically significant change in observer performance sensitivity between the two types of monitors.
Several studies have investigated the comparison of color versus monochrome (technically achromatic) or gray-scale monitors, and a clear consensus does not seem to exist, which is an important issue because color monitors tend to have decreased luminance, contrast, and spatial resolution capabilities than monochrome monitors, and the human visual system has decreased spatial resolution perception in the color channels, but greater dynamic range (500 just-noticeable-differences (JND) versus 60 to 90 JNDs in gray-scale). On the other hand, high performance monochrome monitors are expensive and have a relatively short lifetime of approximately 3 years, and color is becoming increasingly useful in diagnostic imaging with
PICTURE ARCHIVING AND COMMUNICATION SYSTEMS |
355 |
the emergence of 3D display renderings. Although a study comparing monochromatic versus color CRT monitors found no statistically significant differences in display of CR chest images for the detection of subtle pulmonary disease, they did find higher sensitivity rates for specialty chest radiologists on the monochromatic monitor, perhaps due to the lower maximum luminance levels of the color displays (51). Another study comparing pulmonary nodule detection on P45 and P104 monochrome and color 1600 by 1200 pixel monitors found significantly greater false-posi- tive and false-negative responses with the color monitors as well as longer search times (52). So, for primary diagnosis of projection radiographs in particular, monochrome monitors may still be the way to go. Note, however, that users prefer color LCDs when compared with color CRTs. This fact may be related to the Gaussian spot pixel and emissive structure of CRTs and the use of black matrix (shadow mask or aperture grille), which separates the red- green-blue phosphor dots that form an arrangement of color dots or stripes for luminance and chromatic contrast (47). Grille misalignment can degrade color purity and contrast.
Early PACS adopters equipped their radiology reading rooms with the highest quality display monitors, some 2 k, others 1 k, but all high brightness. The software applications were more complex than those targeted for the nonradiologist enterprise user. It was common to provide an intermediate application for use by image-intensive specialists such as orthopedists, neurosurgeons, and radiation oncologists as well as in image-intensive areas such as emergency departments and ICUs. Lesser quality monitors with stripped-down software capabilities were used by enterprise image users. It is interesting to note that as display hardware and software continue to evolve, display application software moves toward melding into one flexible easily configurable GUI, and one monitor type may, in time, meet most needs.
Monitor calibration and QA practices are important to maintaining high performing medical displays. The DICOM 14 Gray-scale Standard Display Function (GSDF) and the AAPM (American Association of Physicists in Medicine) Task Group 18 recommend that monitors be calibrated to a perceptually linearized display function as this is matched to the perceptual capabilities of the human visual system. Monitors forced to follow these standards produce more uniform images with optimum contrast. CRTs are less stable than LCD monitors requiring luminance calibration and matching to be conducted monthly, physically measuring light levels with a photometer. Many LCD displays have embedded luminance meters for automated QA measurements, Although some studies have also recommended doing external luminance measures but less frequently. LCDs must still be manually inspected for nonresponsive pixels. Routine manual viewing of test patterns, such as the SMPTE (Society of Motion Picture and Television Engineers) Test Pattern, are usually sufficient for evaluating overall monitor performance, low contrast, and fine detail detection.
Software Functionality. How many individual monitors does a user need per display workstation — 1, 2, 4, or 8?
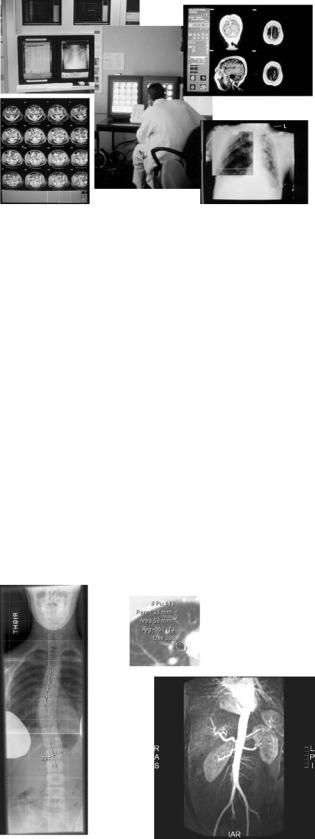
356 PICTURE ARCHIVING AND COMMUNICATION SYSTEMS
Many feel that for primary diagnosis, dual-headed configurations are most efficient for comparison of current and prior relevant studies, particularly for projection radiographs. Note that a good GUI design can reduce the need for multiple monitors. The ability to page through and move images around the screen, the ability to instantaneously switch between tile and stack or cine modes of display, and the ability to view multiple studies on one monitor as well as side-by-side comparison of studies are critical to reducing the amount of hardware and physical display space required. In most cases, the two-monitor setup is sufficient for primary diagnosis and image intensive use with perhaps a third (color) monitor for worklist creation and access to other relevant medical data. The most common configuration for enterprise users is the single-headed or one-monitor display.
First and foremost, a software GUI must be intuitive and easy to use. The software application must be responsive, robust, and reliable. Most display workstations have GUIs to perform two basic functions. The first is to deliver a patient list or worklist of imaging examinations to be read, for example, ‘‘today’s unread emergency department CTs.’’ The worklist environment allows users to interrogate the entire PACS database for a subset of cases with which they wish to work. Typically, the database can be searched for by a specific patient name or other identifier, for individual imaging modalities, over specified time frames, by imaging or patient location within the hospital or health-care enterprise, and so on. The second basic function workstations perform is study display and image manipulation.
Automated hanging protocols based on examination type, the existence of prior historical examinations, and so on can greatly enhance radiology interpretation workflow. For example, if the current imaging study requiring interpretation is a two-view chest projection radiograph, then the default display might be to place the posterioranterior (PA) view on the left display monitor and the lateral view on the right. If the patient has had a prior chest X ray, then the current PA should be placed on the left monitor with the lateral view behind and the prior PA on the right monitor with its corresponding lateral view waiting behind. If the current study is an MR of the brain, then automatically hang each sequence as a separate stack and place multiple (i.e., four-on-one) stacks per monitor so that they can be cined through simultaneously.
Basic display manipulation tools include the ability to dynamically change the window and level or contrast and brightness of the displayed image, the ability to magnify a portion of the image or zoom and pan through the entire image, and monitor configuration and image navigation tools such as paging, cine, and linked stack modes. Image mensuration capabilities, including linear, angle, and region-of-interest measurements, are also typical. Some advanced tools include the ability to track on a corresponding perpendicular slice, in MR studies, for example, where the cursor is on the perpendicular view for 3D referencing. Figure 18 depicts several example softcopy image displays on PACS workstations.
Well-designed PACS are tightly integrated with other information systems such as the hospital or radiology information system, enabling access to other relevant data
Figure 18. Example soft copy image display on PACS workstations.
about the patient or imaging examination from within the display application. Sometimes diagnostic radiology report generation systems, such as speech recognition, are embedded in the diagnostic workstation.
It is anticipated that the number of specialty display applications available on display stations will continue to increase as more features are added. Examples of the results of several advanced processing techniques are shown in Fig. 19. Some systems also provide algorithms for image processing such as image sharpening, or edge enhancement, and image smoothing. Maximum intensity projection (MIP) displays and multiplanar reformats (MPR) are also appearing on PACS workstations. Realtime 3D reconstruction of image data at the PACS display is beginning to be seen. Multimodality image data fusion such as CT and positron emission tomography (PET) images to depict the functional maps overlaid on the anatomical data maps will also likely be viewable.
Figure 19. Example advanced processing techniques: calculation of scoliosis Cobb angle, region-of-interest measurements, 3D magnetic resonance angiogram.
CURRENT TRENDS AND FUTURE PROSPECTS
Medical imaging is increasingly the key triage event in a patient’s encounter with the health-care system. The ability to eliminate the use of film in radiological imaging is a reality today. In addition to the economic advantages of using PACS for digital medical imaging, rapid access to all clinical information on patients, including imaging studies, anytime and anywhere with security, enhances the quality of patient care.
Hurdles still exist today. PACS are not just a radiological tool. Images are required enterprise-wide by many different types of clinicians and other health-care providers. Images are required for viewing in emergency departments, ICUs, surgical ORs, outpatient clinics and referring physicians’ offices as well as for teaching conferences, and at home for viewing by patients and clinical providers. Unless PACS can also deliver images to everyone in the health-care enterprise who requires them, film cannot be turned off, and facilities will have to operate in a painful mixed environment.
Web-based enterprise PACS applications do exist and continue to improve in their performance. Note that webbased PACS for within the radiology department are also becoming more common. Several requirements in the enterprise environment make transition to the all-digital, totally filmless medical imaging facility more difficult than just within the radiology department. The web-PACS enterprise application user interface or GUI must be very intuitive—like the rental car model. Most licensed drivers are able to get into a rental car, orient themselves to where the lights and windshield wipers are, and then go ahead and drive the car. They do not need to know how a car works in order to drive it, and the user interface is very standard across most all cars. The car works robustly and reliably and the user does not need to read a manual before they can drive the car. Unfortunately, the state-of-the-art in computer GUIs is not quite as intuitive, but much progress has been and continues to be made in this area, making GUIs self-training and bullet-proof. Humancomputer interfacing and interaction along with GUI design are currently active areas of research and discovery.
Web-PACS applications are often required to operate in mixed-platform environments to accommodate PC, Macintosh, and Unix boxes, which is sometimes problematic. Applications must be improved to be able to handle bottlenecks in the system at both the input to the database and the output to multiple users accessing the system simultaneously. The best applications are purely webbased; that is, they are not dependent on having to download Active-X components to every physical machine that uses the system.
In summarizing the key components and essential features for clinical implementation of a PACS, at acquisition, all image acquisition devices or imaging modalities should be required to conform to the DICOM standard image format and communications protocol. Devices and PACS in general operate best when well interfaced to other clinical information systems such as the HIS-RIS, report generation systems such as speech recognition applications, computerized physician order-entry (CPOE), and
PICTURE ARCHIVING AND COMMUNICATION SYSTEMS |
357 |
decision support systems. The inherently digital imaging modalities should be acquired into a PACS using direct DICOM capture. Film digitizers such as laser scanners can be used to acquire imaging examinations existing only on film into a PACS if required. Acquisition of digital projection radiographs, such as the conventional chest X ray, can be achieved using CR or photostimulable phosphor devices or digital radiography devices, which directly convert images to digital at the time of X ray exposure. CR and DR devices are likely to coexist for some time.
Archival media and devices will continue to advance, with databases becoming more patient-centric and seamlessly searchable. Computer networking will also improve in not only the hardware devices, but also the network management software strategies. Display GUIs must continue to become more intuitive and robust, and the monitors themselves will trend toward LCD devices as opposed to CRTs.
Predictors for success of the introduction of new technologies into the clinical arena include ease of integration into the existing workflow or change management activities to optimize new workflow with new devices. Systems must be reliable, simple to use, and have optimum performance so that processes can be completed more efficiently than in the analog film-based world. Systems must be flexible and configurable on a per-user basis and they must include fault-tolerance, redundancy, and error-tracking capabilities.
In the future, radiology can help to drive the changes that will greatly impact all of health care. Medical image management systems are maturing outside of the radiology department, providing hospital enterprise-wide access to clinical images and information via the Intranet as well as web access from outside the enterprise via a secure Internet connection. The web will change the way people communicate and perform their duties. Web-based PACS applications will become the norm offering ubiquitous distribution of and access to clinical data. Computer workstations will become less costly, more reliable, and have more intuitive GUIs. All relevant medical information systems will become more tightly integrated with each other, sharing and maintaining user, patient, image, and application sensitivity such that multiple distinct applications perform virtually as one.
Future PACS are likely to be on the less expensive off- the-shelf PC platform using industry standards. PACS display stations are likely to be configured with fewer numbers of monitors—two within radiology and imageintensive specialty areas and one out in the enterprise. Small and medium sized community hospitals, private practices, outpatient centers in rural areas, and some indigent care facilities will begin realizing the benefits of PACS and digital medical imaging through better access to high quality diagnostic imaging services.
PACS functionality will be incorporated into handheld devices for some applications, and wireless transmission will mature in the clinical arena. Improved integration with other information technologies into the total electronic medical record (EMR), including automated speech recognition systems, will enable a more efficient filmless environment as well as a paperless workflow.
358 PICTURE ARCHIVING AND COMMUNICATION SYSTEMS
Advanced image processing utility and translation from the research environment to clinical applications will increase. 3D displays, the use of color and video will increase as will the incorporation of computer-aided detection and decision support through outcomes research and evidence-based medicine will become more prevalent. Multimodality functional and molecular imaging will mature clinically, and value-added applications for specialties outside of diagnostic imaging will increase. Virtual reality imaging presentations and image-guided surgery applications are likely to become more commonly used clinically.
It is likely that the radiological interpretation process will need to transform in order to handle the information and image data overload currently plaguing medical imaging. This image interpretation paradigm shift will be required in order to evaluate, manage, and exploit the massive amounts of data acquired in a more timely, efficient, and accurate manner. Discovery and development of this new paradigm will require research into technological, environmental, and human factors. Interdisciplinary research into several broad areas will be necessary to make progress and ultimately to improve the quality and safety of patient care with respect to medical imaging. These areas are likely to include studies in human perception, image processing and computer-aided detection, visualization, navigation and usability of devices, databases and integration, and evaluation and validation of methods and performance. The result of this transformation will affect several key processes in radiology, including image interpretation, communication of imaging results, workflow and efficiency within health-care enterprises, diagnostic accuracy and a reduction in medical errors, and, ultimately, the overall quality of patient care (53).
Twentieth century medical imaging was film-based in which images were interpreted on analog viewboxes, film was stored as the legal imaging record. Film had to be manually disturbed from one location to another and could be accessed in only one physical location at a time. Twentyfirst century medical imaging will be characterized by digital image acquisition, softcopy computer interpretation, digital image archives, and electronic distribution. It is anticipated that the use of PACS and other information technology tools will enable the filmless, paperless, errorless era of imaging in medicine.
BIBLIOGRAPHY
1.Lemke HU, Stiehl HS, Scharnweber H, Jackel D. Applications of picture processing, image analysis and computer graphics techniques to cranial CT scans. Proceedings of the Sixth Conference on Computer Applications in Radiology and Computer Aided Analysis of Radiological Images; Los Alamitos, CA: IEEE Computer Society Press; 1979. 341–354.
2.Capp ML, et al. Photoelectronic radiology department. Proc SPIE–Int Soc Opt Eng 1981;314:2–8.
3.Dwyer III, SJ, et al. Cost of managing digital diagnostic images. Radiology 1982;144:313.
4.Duerinckx A., editor. Picture archiving and communication systems (PACS) for medical applications. First International Conference and Workshop, Proc SPIE; 1982; 318, Parts 1 and 2.
5.Huang HK, et al. Digital radiology at the University of California, Los Angeles: A feasibility study. Proc SPIE 1983; 418:259–265.
6.Blaine GJ, Hill RL, Cox JR, Jost RG. PACS workbench at mallinckrodt Institute of Radiology (MIR). Proc SPIE 1983; 418:80–86.
7.Seshadri SB, et al. Prototype medical image management system (MIMS) at the University of Pennsylvania: Software design considerations. Proc SPIE 1987;767:793–800.
8.Kim Y, Fahy JB, DeSoto LA, Haynor DR, Loop JW. Development of a PC-based radiological imaging workstation. Proc SPIE 1988;914:1257–1264.
9.Horii SC, et al. Environmental designs for reading from imaging workstations: Ergonomic and architectural features. Proc SPIE 1989;1091:172–178.
10.Arenson RL, Chakraborty DP, Seshadri SB, Kundel HL. The digital imaging workstation. Radiology 1990;176:303–315.
11.Hruby W, Maltsidis A. A view to the past of the future – A decade of digital revolution at the Danube Hospital. In: Hruby W, editor. Digital (R)evolution in Radiology. Vienna: Springer Publishers; 2000.
12.DICOM. 2004. Online. Available at http://medical.nema.org/
.http://medical.nema.org/dicom/2004/.
13.Andriole KP. Anatomy of picture archiving and communication systems: nuts and bolts – image acquisition: getting digital images for imaging modalities. Dig Imag 1999;12(2) Suppl 1: 216–217.
14.Andriole KP, Avrin DE, Yin L, Gould RG, Arenson RL. PACS databases and enrichment of the folder manager concept. Dig Imag 2000;13(1):3–12.
15.Andriole KP. Computed radiography overview. In: Seibert JA, Filipow LJ, Andriole KP, editors. Practical Digital Imaging and PACS. Medisson, WI: Medical Physics Publishing; 1999. p 135–155.
16.Bogucki TM, Trauernicht DP, Kocher TE. Characteristics of a storage phosphor system for medical imaging. Kodak Health Sciences Technical and Scientific Monograph. No. 6, New York: Eastman Kodak Co.; July 1995.
17.Barnes GT. Digital X-ray image capture with image intensifier and storage phosphor plates: Imaging principles, performance and limitations. Proceedings of the AAPM 1993 Summer School: Digital Imaging; Charlottesville, VA: University of Virginia; Monograph 22: 23–48.
18.Wilson AJ, West OC. Single-exposure conventional and computed radiography: The hybrid cassette revisited. Invest Radiol 1993;28(5):409–412.
19.Andriole KP, Gooding CA, Gould RG, Huang HK. Analysis of a high-resolution computed radiography imaging plate versus conventional screen-film radiography for neonatal intensive care unit applications. SPIE Phys Med Imag 1994;2163: 80–97.
20.Kodak. Digital radiography using storage phosphors. Kodak Health Sciences Technical and Scientific Monograph. New York: Eastman Kodak Co.; April 1992.
21.Matsuda T, Arakawa S, Kohda K, Torii S, Nakajima N. Fuji Computed Radiography Technical Review. No. 2. Tokyo: Fuji Photo Film Co., Ltd.; 1993.
22.Berg GE, Kaiser HF. The X-ray storage properties of the infrared storage phosphor and application to radiography. Appl Phys 1947;18:343–347.
23.Luckey G. Apparatus and methods for producing images corresponding to patterns of high energy radiation. U.S. Patent 3,859,527. June 7, 1975. Revision No. 31847. March 12, 1985.
24.Kotera N, Eguchi S, Miyahara J, Matsumoto S, Kato H. Method and apparatus for recording and reproducing a radiation image. U.S. Patent 4,236,078. 1980.