

- •VOLUME 5
- •CONTRIBUTOR LIST
- •PREFACE
- •LIST OF ARTICLES
- •ABBREVIATIONS AND ACRONYMS
- •CONVERSION FACTORS AND UNIT SYMBOLS
- •NANOPARTICLES
- •NEONATAL MONITORING
- •NERVE CONDUCTION STUDIES.
- •NEUROLOGICAL MONITORS
- •NEUROMUSCULAR STIMULATION.
- •NEUTRON ACTIVATION ANALYSIS
- •NEUTRON BEAM THERAPY
- •NEUROSTIMULATION.
- •NONIONIZING RADIATION, BIOLOGICAL EFFECTS OF
- •NUCLEAR MAGNETIC RESONANCE SPECTROSCOPY
- •NUCLEAR MEDICINE INSTRUMENTATION
- •NUCLEAR MEDICINE, COMPUTERS IN
- •NUTRITION, PARENTERAL
- •NYSTAGMOGRAPHY.
- •OCULAR FUNDUS REFLECTOMETRY
- •OCULAR MOTILITY RECORDING AND NYSTAGMUS
- •OCULOGRAPHY.
- •OFFICE AUTOMATION SYSTEMS
- •OPTICAL FIBERS IN MEDICINE.
- •OPTICAL SENSORS
- •OPTICAL TWEEZERS
- •ORAL CONTRACEPTIVES.
- •ORTHOPEDIC DEVICES MATERIALS AND DESIGN OF
- •ORTHOPEDICS PROSTHESIS FIXATION FOR
- •ORTHOTICS.
- •OSTEOPOROSIS.
- •OVULATION, DETECTION OF.
- •OXYGEN ANALYZERS
- •OXYGEN SENSORS
- •OXYGEN TOXICITY.
- •PACEMAKERS
- •PAIN SYNDROMES.
- •PANCREAS, ARTIFICIAL
- •PARENTERAL NUTRITION.
- •PERINATAL MONITORING.
- •PERIPHERAL VASCULAR NONINVASIVE MEASUREMENTS
- •PET SCAN.
- •PHANTOM MATERIALS IN RADIOLOGY
- •PHARMACOKINETICS AND PHARMACODYNAMICS
- •PHONOCARDIOGRAPHY
- •PHOTOTHERAPY.
- •PHOTOGRAPHY, MEDICAL
- •PHYSIOLOGICAL SYSTEMS MODELING
- •PICTURE ARCHIVING AND COMMUNICATION SYSTEMS
- •PIEZOELECTRIC SENSORS
- •PLETHYSMOGRAPHY.
- •PNEUMATIC ANTISHOCK GARMENT.
- •PNEUMOTACHOMETERS
- •POLYMERASE CHAIN REACTION
- •POLYMERIC MATERIALS
- •POLYMERS.
- •PRODUCT LIABILITY.
- •PROSTHESES, VISUAL.
- •PROSTHESIS FIXATION, ORTHOPEDIC.
- •POROUS MATERIALS FOR BIOLOGICAL APPLICATIONS
- •POSITRON EMISSION TOMOGRAPHY
- •PROSTATE SEED IMPLANTS
- •PTCA.
- •PULMONARY MECHANICS.
- •PULMONARY PHYSIOLOGY
- •PUMPS, INFUSION.
- •QUALITY CONTROL, X-RAY.
- •QUALITY-OF-LIFE MEASURES, CLINICAL SIGNIFICANCE OF
- •RADIATION DETECTORS.
- •RADIATION DOSIMETRY FOR ONCOLOGY
- •RADIATION DOSIMETRY, THREE-DIMENSIONAL
- •RADIATION, EFFECTS OF.
- •RADIATION PROTECTION INSTRUMENTATION
- •RADIATION THERAPY, INTENSITY MODULATED
- •RADIATION THERAPY SIMULATOR
- •RADIATION THERAPY TREATMENT PLANNING, MONTE CARLO CALCULATIONS IN
- •RADIATION THERAPY, QUALITY ASSURANCE IN
- •RADIATION, ULTRAVIOLET.
- •RADIOACTIVE DECAY.
- •RADIOACTIVE SEED IMPLANTATION.
- •RADIOIMMUNODETECTION.
- •RADIOISOTOPE IMAGING EQUIPMENT.
- •RADIOLOGY INFORMATION SYSTEMS
- •RADIOLOGY, PHANTOM MATERIALS.
- •RADIOMETRY.
- •RADIONUCLIDE PRODUCTION AND RADIOACTIVE DECAY
- •RADIOPHARMACEUTICAL DOSIMETRY
- •RADIOSURGERY, STEREOTACTIC
- •RADIOTHERAPY ACCESSORIES
25.Wuu CS, Zaider M. A calculation of the relative biological effectiveness of 125I and 103Pd brachytherapy sources using the concept of proximity function. Med Phys 1998;25:2186–2189.
26.Nath R, Anderson LL, Luxton G, Weaver KA, Williamson JF, Meigooni AS. Dosimetry of interstitial brachytherapy sources - recommendations of the aapm radiation-therapy committee task group no 43. Med Phys 1995;22:209–234.
27.Handbook of Chemistry and Physics. Boca Raton, FL: CRC Press; 1981.
28.Huda W, Slone R. Review of Radiologic Physics, 1995.
29.Rivard MJ, Butler WM, DeWerd LA, Huq MS, Ibbott GS, Li ZF, Mitch MG, Nath R, Williamson JF. Update of AAPM task group No. 43 report: A revised AAPM protocol for brachytherapy dose calculations. Med Phys 2004;31:3532–3533.
30.Williamson JF, Butler W, DeWerd LA, Huq MS, Ibbott GS, Li Z, Mitch MG, Nath R, Rivard MJ, Todor D. Recommendations of the American Association of Physicists in Medicine regarding the impact of implementing the 2004 task group 43 report on dose specification for Pd-103 and I-125 interstitial brachytherapy. Med Phys 2005;32:1424–1439.
31.Lance Chambers, Practical Handbook of Genetic Algorithms Boca Raton, FL: CRC Press; 1995.
32.Grefenstette JJ. American Association for Artificial Intelligence, Beranek a. N. i. Bolt, Naval Research Laboratory (U.S.), Genetic Algorithms and Their Applications Proceedings of the Second International Conference on Genetic Algorithms, July 28-31, 1987 at the Massachusetts Institute of Technology. Cambridge, MA: Hillsdale, NJ; 1987.
33.Man KF, Tang KS, Kwong S. Genetic Algorithms Concepts and Designs. London: 1999.
34.Zalzala AMS, Fleming PJ. Genetic Algorithms in Engineering Systems. London: 1997.
35.Sloboda RS. Optimization of brachytherapy dose distribution by simulated annealing. Med Phys 1992;19:964.
36.Pouliot J, Tremblay D, Roy J, Filice S. Optimization of permanent I-125 prostate implants using fast simulated annealing. Int J Radiat Oncol Biol Phys 1996;36:711–720.
37.Cohen GN, Amols HI, Zelefsky MJ, Zaider M. The Anderson nomograms for permanent interstitial prostate biplants: A briefing for practitioners. Int J Radiat Oncol Biol Phys 2002;53:504–511.
38.Wefer AE, Hricak H, Vigneron DB, Coakley FV, Lu Y, Wefer J, Mueller-Lisse U, Carroll PR, Kurhanewicz J. Sextant localization of prostate cancer: Comparison of sextant biopsy, magnetic resonance imaging and magnetic resonance spectroscopic imaging with step section histology. J Urol 2000;164: 400–404.
39.Kurhanewicz J, Vigneron DB, Males RG, Swanson MG, Yu KK, Hricak H. The prostate: MR imaging and spectroscopy — Present and future. Radiol Clin North Am 2000;38:115.
40.Scheidler J, Hricak H, Vigneron DB, Yu KK, Sokolov DL, Huang LR, Zaloudek CJ, Nelson SJ, Carroll PR, Kurhanewicz J. Prostate cancer: Localization with three-dimensional proton MR spectroscopic imaging — Clinicopathologic study. Radiology 1999;213:473–480.
41.Kurhanewicz J, Vigneron DB, Hricak H, Narayan P, Carroll P, Nelson SJ. Three-dimensional H-1 MR spectroscopic imaging of the in situ human prostate with high (0.24-0.1-cm(3)) spatial resolution. Radiology 1996;198:795–805.
42.Kurhanewicz J, Vigneron DB, Nelson SJ, Hricak H, MacDonald JM, Konety B, Narayan P. Citrate as an in-vivo marker to discriminate prostate-cancer from benign prostatic hyperplasia and normal prostate peripheral zone — detection via localized proton spectroscopy. Urology 1995;45:459–466.
43.Todor DA, Cohen GN, Amols HI, Zaider M. Operator-free, filmbased 3D seed reconstruction in brachytherapy. Phys Med Biol 2002;47:2031–2048.
PULMONARY PHYSIOLOGY |
429 |
44.Todor DA, Zaider M, Cohen GN, Worman MF, Zelefsky MJ. Intraoperative dynamic dosimetry for prostate implants. Phys Med Biol 2003;48:1153–1171.
45.Tubic D, Zaccarin A, Pouliot J, Beaulieu L. Automated seed detection and three-dimensional reconstruction. I. Seed localization from fluoroscopic images or radiographs. Med Phys 2001;28:2265–2271.
46.Tubic D, Zaccarin A, Beaulieu L, Pouliot J. Automated seed detection and three-dimensional reconstruction. II. Reconstruction of permanent prostate implants using simulated annealing. Med Phys 2001;28:2272–2279.
47.Lee EK, Zaider M. On the determination of an effective planning volume for permanent prostate implants. Int J Radiat Oncol Biol Phys 2001;49:1197–1206.
See also BRACHYTHERAPY, HIGH DOSE RATE; NUCLEAR MEDICINE INSTRUMENTATION.
PTCA. See CORONARY ANGIOPLASTY AND GUIDEWIRE
DIAGNOSTICS.
PULMONARY MECHANICS. See RESPIRATORY
MECHANICS AND GAS EXCHANGE.
PULMONARY PHYSIOLOGY
JOHN DEMENKOFF
Mayo Clinic, Dept. of Anesthesia
Scottsdale, Arizona
INTRODUCTION
Present day pulmonary function testing is available in all hospitals and in a less sophisticated form in many physicians’ offices. Such was not the case until the 1940s, when the fruits of physiological research dating back 150 years blossomed on the heels of World War II. This so-called golden age of pulmonary physiology spurred many of the currently available lung function tests which are used for diagnosis and treatment of existing lung disease; screening for early pulmonary disease; evaluation of respiratory symptoms such as cough and shortness of breath; performance of disability evaluations; preoperative assessment of thoracic and other surgical patients; determination of level of cardiopulmonary fitness; monitoring of adverse pulmonary effect of certain drug therapies.
Over the years, many have contributed to an understanding of the lung and how it works in health as well as in disease. These discoveries have provided building blocks of knowledge which form the basis of current modern pulmonary function testing.
PRE-1940S
Leonardo DaVinci: This genius drew detailed anatomical illustrations clearly depicting a bellows function of the respiratory muscles.
John Malysed: In 1674, he constructed a model of the chest and lungs with a bladder enclosed inside a

430 PULMONARY PHYSIOLOGY
simple bellows with the neck outside. With a glass plate on one side, one could watch the bladder inflate and deflate when the bellows operated.
John Hutchinson: In 1848, he developed a spirometer and measured the vital capacity in thousands of normal subjects (1). He also differentiated normal and abnormal results quantitatively, thus ushering in a diagnostic use for pulmonary testing.
Humphrey Davey: Discoverer of hydrogen gas in the early 1800s. This led the way for measuring various lung volumes and compartments other than Hutchinson’s vital capacity. Davey built his own spirometer, filled it part way with hydrogen, and breathed it back and forth ‘‘for seven quick breaths’’, finally exhaling fully into the spirometer. Then by measuring the amount and concentration of hydrogen in the spirometer and assuming an equal concentration in his lungs, he calculated the amount of air in his lungs at the end of full exhalation, known today as the residual volume. Modern day lung volume determinations use the inert gas helium with a slightly different protocol, but the fundamental principles remain the same.
Marie Krogh: Prior to 1915, many eminent physiologists believed that oxygen was actively secreted by the lungs into the blood stream. Marie Krogh challenged this popular notion with her diffusion experiments using carbon monoxide. She devised a single breath test in which a subject first fully exhaled to residual volume, then inspired deeply from a spirometer containing 1% carbon monoxide. After an initial exhalation and a six second breath hold, the subject completed a full exhalation. Krogh measured the alveolar gas before and after the six-second breath hold and calculated the uptake of carbon monoxide by the bloodstream.
The amount of CO transfer was noted to be entirely by the process of diffusion and proportional to the pressure differential across the alveolar capillary membrane (P1 P2). Because CO binds so tightly to the hemoglobin molecule, P2 is small. The driving pressure P1 can be easily calculated. Krogh took advantage of these factors in devising her test, which confirmed the importance of diffusion, not secretion, in the lung.
For many reasons open to speculation, the importance of Krogh’s work was not fully appreciated nor developed clinically until the 1940s. The reader is referred to a delightful discourse on such medical curiosities in Ref. 2.
POST-1940S AND THE GOLD AGE OF PULMONARY PHYSIOLOGY
What occurred in the 1940s was a combination of intellect and pluck driven by military contracts and government funds. The resulting research and understanding of lung physiology paved the way for development of current-day pulmonary function laboratories. Some of the more brilli-
ant, resourceful and ingenious researchers of this time are listed below.
Julius Comroe
Chairman, Department Physiology and Pharmacology, University of Pennsylvania, 1946–1957. Director of Cardiovascular Research Institute, University of California, San Francisco, 1957–1983. At both of these institutions, Dr. Comroe developed and fostered world-renowned faculty who studied multiple facets of pulmonary physiology. While at the University of Pennsylvania, Comroe demonstrated his ingenuity by adapting a used surplus bomber nose cone as a body plesthymograph. He wanted to apply Boyle’s Law to the measurement of lung volumes, air flow, and airway resistance. His work ushered in modern-day plethysmography. His text, Physiology of Respiration (2) remains a classic.
Herman Rahn, Wallace O. Fenn, Arthur Otis
These remarkable men formed the core of a research effort at the University of Rochester. An account of this creative ground work is found in Ref. 3, and is rich in historical facts. In the 1940s, pneumotachographs had to be fabricated by individual research groups. In the Rochester group’s first model, a cluster of soda straws encased in a brass tube served as the flow resistance element. In later versions, they used as resistive elements glass wool enclosed in a lady’s hair net. Their contributions are evident today, as many of their postdoctoral fellows and research associates have gone on and taught the next generation of pulmonary specialists.
Andre Frederick Cournand, Dickinson Woodrow Richards
Both rshared shared the 1956 Nobel Prize in medicine and physiology, and formed the famous Bellevue Hospital Cardiopulmonary Lab at Columbia University. Their observations regarding prolonged nitrogen washout in the lungs of emphysematous patients fostered the clinical use of diagnostic pulmonary function tests. They also established normal values and formulated testing protocols.They pioneered catheterizationofthe right heart, making way for analysis of mixed venous bloodandmoreaccuratecardiacoutputandpulmonary blood flow via the direct Fick technique.
Pulmonary blood flow
O2 consumption
¼ Arterial-mixed venous O2 difference
Current interventional cardiology, and the understanding of complex interrelatedness of pulmonary diseases on the heart, stem from these studies done in the 1950s at Columbia.
Since the mid-1960s, pulmonary function testing has evolved more slowly. Tests that are reproducible, well tolerated by patients, and offer helpful clinical information have been further refined by advances in instrumentation and computerization.

With the advent of rapidly responding gas analyzers, highly accurate and calibrated pneumotachographs, and sophisticated computer software, the study of lung function during exercise has become possible. The complex interactions of metabolic-cardiopulmonary systems is discussed below, in the section on exercise physiology. While a boon to performance-minded athletes, these tests also shed light on limitation of exercise tolerance due to diseases of the heart and lung.
From the time of DaVinci to the present, great strides have been made in the understanding of lung function and its measurement. Now simple acts, such as blowing out a candle or coughing, are known to be dependent on elastic recoil of the lungs and complex airways dynamics. Both properties of the lung are measured with pulmonary function testing.
Each test discussed in the following text carries with it a rich historical and intellectual story line.
PHYSIOLOGICAL PRINCIPLES UNDERLYING MODERN PULMONARY FUNCTION TESTS
The interpretation and analysis of pulmonary function tests is often conveyed in physiological terms rather than as specific medical diagnoses. As such important underlying physiological concepts are presented that will provide a deeper understanding of pulmonary function test results. Many of these concepts have been developed and refined over time and represent a legacy of scientific achievement.
SINGLE BREATH NITROGEN WASHOUT
Aptly named, this test measures the nitrogen concentration of a normal exhalation after a deep inhalation of 100% oxygen. It was developed by Fowler in 1948 to measure the
anatomic dead space Vdanatomical.
During normal tidal breathing, a part of each breath remains in the conducting airways of the upper airway and tracheobronchial tree. It never reaches the alveoli; therefore it does not participate in gas exchange and is referred to as anatomical dead space. The fraction of total ventilation (OE) that reaches gas exchanging space of alveoli is called alveolar ventilation or OA.
OA ¼ OE f Vdanatomical
where f ¼ respiratory frequency
In Fowlers method (Fig. 1), a simultaneous recording of nitrogen and exhaled volume is made after a deep inhalation of pure oxygen.
At the start of expiration, the gas comes from the anatomical dead space, which contains no nitrogen. Along the course of the S-shaped N2 washout, a front between the alveolar air and dead space air can be determined (see Graphical depiction below).
The anatomical dead space is related to body weight and is 150 mL for a normal man. The extrathoracic fraction, mouth and pharynx, contributes 66 mL with a range of 35– 105 mL, depending on jaw and neck position. Anatomic dead space represents an inefficiency of the design of the
|
|
|
PULMONARY PHYSIOLOGY |
431 |
|||||||||||||
|
|
Start of |
|
|
|
|
|
|
|
|
|
||||||
|
|
insp. |
|
|
|
|
|
|
|
|
|
||||||
80 |
|
|
|
|
|
|
|
|
|
Alveolar |
End of |
||||||
|
|
|
|
|
|
|
|
|
|||||||||
|
|
|
|
|
|
|
|
|
|||||||||
|
|
|
|
|
|
|
|
|
|
||||||||
% N2 |
|
|
|
|
|
|
|
|
|
plateau |
exp. |
||||||
|
Deep |
|
|
|
|
|
|
|
|
CALV. |
|||||||
|
|
|
|
|
|
|
|
|
|||||||||
|
|
|
|
|
|
|
|
|
|
||||||||
|
|
|
|
|
|
|
|
|
|
||||||||
40 |
|
breath |
|
|
|
|
|
|
|
|
|
||||||
|
of O2 |
|
|
|
|
|
|
|
|
|
|||||||
|
|
|
|
|
|
|
|
|
|
|
|||||||
|
|
|
Start of |
|
|
|
|
|
|
|
|
|
|||||
|
|
|
exp. |
|
|
|
|
|
|
|
|
|
|||||
0 |
|
|
|
|
|
|
|
|
|
|
|
|
|
|
|
|
Cinsp. |
|
|
|
|
|
|
|
|
|
|
|
|
|
|
|
|
||
|
|
|
|
|
|
|
|
|
|
|
|
|
|
|
|
||
|
|
|
|
|
VDS |
|
|
|
|
|
Valv. |
|
|
|
|||
|
|
|
|
|
|
|
|
|
|
|
|
|
|
||||
|
|
|
|
|
|
|
|
Vexp. |
|
|
|
|
|||||
|
|
|
|
|
|
|
|
|
|
|
|
|
|
|
|||
|
|
|
|
|
|
|
|
|
|
|
|
|
|
|
|||
Figure 1. Fowler’s method. For determination of anatomic dead space. See text for description. The flat portion of the curve is called the alveolar plateau and represents pure alveolar gas.
respiratory system. With each breath, a significant volume of air must be moved, requiring work, for which no benefit is derived.
PHYSIOLOGICAL DEAD SPACE BOHR EQUATION
Inefficiencies also occur at the level of the alveoli where some air reaches the alveoli, but gas exchange never occurs. For example, the upper lobes in a normal resting upright lung are well-ventilated, but not perfused.
This is wasted ventilation, and when added to the anatomic dead space is designated as the physiological dead space. This can be measured by application of the Bohr equation (4). If one complete expiration is collected in a bag, the amount of carbon dioxide is [FECO2 VT]. This volume of CO2 comes partly from the nonexchanging dead space, which has a volume from the inspired air [VD FICO2], plus the volume from alveolar gas FACO2 [VT VD].
½FECO2 VT& ¼ FICO2 VD þ FACO2½VT VD&
FACO2 ¼ VT FECO2 VDFICO2
VT VD
VD ¼ ½FACO2 FECO2&VT
FACO2 FICO2
If inspired, CO2 is zero then FICO2 ¼ 0.
Hence,
V |
D |
¼ |
FACO2 FECO2 |
V |
T |
|
|
|
FACO2 |
|
|||
VD |
¼ |
FACO2 FECO2 |
|
|
||
VT |
|
FACO2 |
|
|
||
FACO2 ¼ Alveolar CO2 fractional concentration measured by obtaining an alveolar sample.

432 PULMONARY PHYSIOLOGY
FECO2 ¼ Mixed expired CO2 fractional concentration measured from a collection of expired air; Douglas bag or mixing chamber.
The parameter VD/VT is called the dead space to tidal volume ratio where the dead space is physiologic and includes the anatomic dead space. It is an efficiency rating, typically 0.3 in normals and up to 0.5 or so in patients with emphysema. In the latter case, 50% of the breath is wasted and does not participate in gas exchange.
FORCED EXPIRATION AND DYNAMIC COMPRESSION
The most familiar maneuver that utilizes a maximal expiratory effort is a cough. The resulting dynamic airway compression facilitates clearance of bronchial secretions. Even at maximal exercise, such flow rates are not attained, thus demonstrating an impressive reserve in flow characteristics of the lung.
The complex mechanics of forced exhalations were elucidated by the work of Hyatt, Schilder, and Fry. They described a maximal expiratory flow volume curve, where instantaneous expiratory flow is plotted against volume instead of time (as is done with FEV1). Flow reaches a maximum at 80% of vital capacity and reaches zero at residual volume. The curve is shown to be effort-dependent >75% of VC and effort-independent <75%.
Once dynamic compression occurs, the lung behaves as a Starling Resistor (Fig. 2). The flow then depends on the elastic recoil of the lung and airway resistance upstream from the compressed lung segment. Under these conditions, an increase in effort produces no increase in flow.
DIFFUSION AND DIFFUSING
The purpose of the lung is to deliver oxygen to the blood stream and remove the byproduct of metabolism, carbon dioxide. This process begins with mass transport of oxygen down conducting tubes of diminishing caliber called bronchi, bronchioles, terminal bronchioles, and finally air sacs or alveoli. Simple diffusion then occurs at the interface between the walls of the alveoli and pulmonary capillaries. The 300 million or so alveoli in the human lung
P1 |
P2 |
|
 P3
P3
Figure 2. A Starling Resistor that is a mechanical analog for dynamic compression of the airways. The collapsible tubing in the chamber represents small airways. The pressure P2 is pleural pressure during a forced vital capacity maneuver which collapses the airways at the equal pressure point, that is, P2 > P3. The pressure P1 represents the elastic recoil of the lungs. Flow is proportional to P1 P2.
O2 |
|
|
|
P2 |
Vgas |
A |
· D · (P1 − P2) |
|
|||
|
T |
||
CO2 |
D Sol |
||
|
MW |
||
P1

 Thickness
Figure 3. The process of diffusion and Fick’s law of diffusion. Within the lung P1 would represent the alveolar space and P2 the capillary space.
create a surface area for diffusion of 85 m2. The rat at which gas, either oxygen or carbon dioxide that transverses this membrane follows Fick’s law of diffusion and is proportional to the surface area of the sheet and inversely proportional to its thickness.
The diffusion coefficient is proportional to the solubility of the gas and inversely proportional to the square root of the molecular weight (Fig. 3).
˙ |
A |
|
|
Vgas ¼ |
|
DðP1 |
P2Þ |
T |
Sol
D ¼ p
MW
where MW ¼ molecular weight
When applying this formula to the special case of oxygen diffusion the partial pressure of oxygen in the alveolus (PAO2) or driving pressure (P1) is 100 mmHg (13.2 kPa) while that in the pulmonary capillary (P2) is 40 mmHg (5.3 kPa). The amount of oxygen transferred depends in part on this pressure differential (P1 P2); 100 mmHg (13.2 kPa) minus 40 mmHg (5.3 kPa), which results in a diffusion gradient of 60 mmHg (7.9 kPa). In addition the thickness of the alveolar-capillary membrane (normally 0.3 m) appears to be of equal importance. When this membrane is thickened by disease states, such as pneumonia, pulmonary fibrosis, asbestosis, or silicosis, oxygen transfer is considerably impaired.
The complexity of oxygen diffusion becomes apparent when one considers that red blood cells carrying the hemoglobin molecule typically spend only 0.75 s in the pulmonary capillary. Given a normal driving pressure (P1 P2) of 60 mmHg (7.9 kPa) and a healthy alveolar-capillary membrane (0.3 mm thick) equilibrium (P1 ¼ P2) will occur in 0.25 s. In other words, as blood exits the gas exchange space it will have gone from a PO2 of 40 mmHg (5.3 kPa)– 100 mmHg (13.2 kPa) rapidly.
Various lung diseases can compromise the elegant process of diffusion outlined above. In some the alveolar oxygen level is reduced thereby diminishing the driving pressure. In others diffusion is impaired by a thickened alveolar capillary membrane. And finally, with exertion, as blood flow increases, the time available to load oxygen onto the hemoglobin molecule is reduced. Any one or combination of these factors can lead to a reduction in the diffusion of oxygen.
Having said this, the actual measurement of the diffusing capacity of the lung for oxygen as a clinically useful

pulmonary function test has proved difficult to develop. This is due to the fact that the capillary oxygen pressure is ever increasing as P2 approaches P1 creating a back pressure thus slowing diffusion as red cells travel along the pulmonary capillary bed. The parameter P2 can be calculated through a very complex and cumbersome integration method. In the final analysis, oxygen transfer then is actually significantly dependent on total flow of pulmonary capillary blood rather than diffusion alone.
Unlike oxygen, carbon monoxide transfer is diffusionlimited because it binds so tightly to hemoglobin that the partial pressure of CO in pulmonary capillary blood is low. There is little back pressure, so the amount of carbon monoxide transferred is related only to the driving pressure P1 (P2 0), which is the alveolar pressure PA of carbon monoxide.
|
¼ |
|
T |
|
|
ð |
|
|
|
Þ |
Ogas |
|
A |
|
D |
|
P1 |
|
P2 |
|
|
|
|
|
|
|
||||||
Ogas |
A |
D |
|
|
|
|
|
|||
|
¼ |
|
|
|
|
|
|
|||
P1 |
T |
|
|
|
|
|
||||
The above equation is simplified as follows, where DL is called the diffused capacity of the lung and includes the area, thickness, and diffusing properties of the sheet and the gas concerned.
DLCO ¼ |
A |
D ¼ |
OCO |
¼ |
OCO |
|||||
T |
P1CO |
PACO |
|
|
||||||
P1 |
¼ Driving pressure ¼ PACO ¼ Alveolar CO |
|||||||||
P2 |
¼ 0 |
OCO |
|
|
|
OCO |
||||
DLCO ¼ |
|
DLCO ¼ |
||||||||
P1 P2 |
|
PACO |
|
|||||||
GAS LAWS
By convention, pulmonary function test results are expressed either at body temperature and ambient pressure, saturated (BTPS), ambient temperature and pressure, saturated (ATPS), or standard temperature and pressure, dry (STPD). A working knowledge of gas laws is essential for accurate conversion from one state to another.
Gas inside the lung is at BTPS. The pressure is the barometric pressure (PB), and saturated refers to the saturated water vapor pressure (PW), which is a function of temperature. At normal body temperature (37 8C), PW is 47 mmHg (6.2 kPa).
Gas measured in the equipment is at ambient temperature, dry (ATD) if the expired water vapor is absorbed prior to the measurement or if inspired gas is from a cylinder. Alternately, it is called ATPS if expired gas is collected, but the water vapor was not absorbed. At normal room temperature (25 8C), PW is 22 mmHg (2.9 kPa).
Inspired gas from the atmosphere is ordinarily between ATPD and ATPS. Since buildings typically are at 50% relative humidity, PW is 50% of 22 mmHg (1.4 kPa) or 11 mmHg (1.4 kPa).
Boyle first published his ideal gas law in 1662. It states that, for a given mass of gas at constant temperature, the
PULMONARY PHYSIOLOGY |
433 |
volume varies inversely with the pressure:
PV ¼ RT
Charles’s law states that, for a given mass of gas at constant pressure, the volume varies directly with the absolute temperature. Thus V/T is a constant, where T designates a temperature on the absolute or kelvin scale.
Combining both these gas laws gives an approximation of real gases under various conditions.
P1V1 ¼ P2V2
T1 T2
Usually called the ideal gas law.
Suppose that a patient expires into a Douglas bag, which is then transferred to a laboratory at 20 8C and squeezed through a dry gas meter. From a knowledge of the number of expirations collected and the respiratory frequency, the volume of gas at 20 8C corresponding to the minute volume ventilation OE can be calculated. If the minute volume was 6 L at ATPS then, by use of the combined gas law equation, volumes can be adjusted to BTPS and STPD.
Assume that the patient’s body temperature is 37 8C, the saturated water vapor pressure is 18 mmHg (2.4 kPa) at 20 8C and 47 mmHg (6.2 kPa) at 37 8 C and that the barometric pressure is 760 mmHg (101 kPa). Because water vapor does not follow the ideal gas law, its partial pressure is subtracted.
ð760 |
|
18Þ |
6 |
|
ð760 47Þ V2 |
||
273 |
þ |
20 |
¼ |
|
|||
|
273 |
þ |
37 |
||||
|
|
|
|||||
So that
742 6 310
V2 ¼ 713 293 ¼ 6:61 L BTPS
The same volume of 6 L measured under atmospheric conditions would represent 5.45 L under STPD, that is, 760 mmHg (101 kPa) and 0 8C.
ð760 |
18Þ |
|
6 |
760 |
|
V |
||||
|
|
|
|
|
||||||
273 |
þ |
20 |
¼ 273 |
3 |
||||||
|
||||||||||
V |
3 ¼ |
742 6 273 |
¼ |
5:45 L ATPD |
||||||
|
|
760 |
|
293 |
|
|||||
|
|
|
|
|
|
|
|
|
|
|
BTPS is used for lung volumes and ventilation OE, ATPS for maximal inspiratory and expiratory flow, and STPD for oxygen consumption and carbon dioxide output.
CALCULATION OF OXYGEN UPTAKE
Oxygen uptake is the difference between oxygen breathed in and the amount in the exhaled air.
OO2 ¼ ðOI FIO2Þ ðOE FEO2Þ
Where OO2 is the oxygen uptake in liter per minute; OI is the inspired minute volume (L min 1), FEO2 is the mixed expired oxygen fraction, and FIO2 is the inspired oxygen fraction. Because the volume of inspired air is slightly greater than expired air (more O2 consumed than carbon

434 PULMONARY PHYSIOLOGY
dioxide, CO2, is produced), a correction factor using measured nitrogen is used.
OI ¼ OE
This has been attributed to the British researcher and is referred to as the Haldane Transformation. It is used to calculate the inspired volume when only OE is measured, the latter being much easier to measure than the former.
Substituting this correction factor into the original equation,
|
OO2 |
¼ |
OE |
|
FEN2 |
|
|
F1O2 |
OE |
|
FEO2 |
Þ |
||
|
|
|||||||||||||
|
|
|
F1N2 |
|
ð |
|
|
|
||||||
since FEN2 ¼ (1 FEO2 FECO2), this becomes |
|
|
||||||||||||
OO2 |
OE |
ð1 FEO2 FECO2Þ 0:2093 |
|
|
OE |
|
FEO2 |
|||||||
|
¼ |
|
|
0:7904 |
|
|
|
|
|
|||||
reducing to
OO2 ¼ OEðð1 FEO2 FECO2Þ 0:265Þ ðFEO2Þ
By convention, OO2 is expressed under standard conditions (STPD).
During a standard cardiopulmonary exercise stress, all the variables on the right side of the equation are measured as follows:
OE |
Douglas bag for collection |
|
or |
|
Pneumotachograph interfaced with a |
|
computer for exercise testing |
FEO2 |
Measured from Douglas bag at rest |
|
or |
|
Mixing chamber for exercise testing |
FECO2 |
Measured from Douglas bag at rest |
|
or |
|
Mixing chamber for exercise testing |
Calculation of carbon dioxide output OCO2
OCO2 ¼ OE FECO2
Because there is little CO2 in inspired air this, calculation becomes much simpler. Again by convention, OCO2 is also expressed under STPD.
Respiratory Exchange Ratio (R).
R ¼ OCO2
OO2
This value is typically 0.8 during the steady state of respiration and represents the ratio of CO2 produced to oxygen consumed by the metabolic pathways of the cell. The value of R is fixed depending on the primary source of fuel being metabolized. Pure carbohydrate gives a ratio of 0.7 and fat burns at a ratio of 1.0. A typical ratio is 0.8 and represents a mixture of the two food groups being metabolically consumed.
In the nonsteady state, the amount of CO2 exhaled rapidly changes based on the level of hyper or hypoventila-
tion, so R may vary from 0.6 to 1.4. In addition, CO2 produced by bicarbonate buffering of lactic acid adds to the OCO2 produced by metabolism during peak exercise. This will be discussed further in the section on cardiopulmonary exercise testing.
The measurement of OO2 , OCO2 , and the ratio OCO2 /OO2 provide important information on assessing overall lung function, at rest and especially during exercise testing.
INSTRUMENTATION
Volume Measuring Devises
In order to calculate minute ventilation (OE), and other derived variables such as OO2 and OCO2 the expired volume over time is collected in a Douglas bag or meteorological (Mylar) balloon. So collected, the expired gas is then connected and emitted into a large spirometer, such as the 120 L Tissot spirometer, and the volume is measured by use of a calibration factor. The Tissot spirometer is a typical water-filled spirometer, but due to its size and the considerable inertia of the bell, it is not used for measuring tidal breathing. Smaller water-filled spirometers (9–13.5) liters have a lower airway resistance and an appropriate response time (up to 20 Hz) needed to measure forced exhalation. All water-sealed spirometers, regardless of size, are configured similarly and operate on the same principles (Fig. 4). A bell is sleeved between the inner
Figure 4. Water filled spirometer connected to a rotating Kymograph.
and outer housing. Water fills the space between the inner cylinder and outer housing, providing an airtight seal for air entering the bell. Rigid tubing connects the inner cylinder to exhaled air from the patient or collection bag. A CO2 absorbant is placed in circuit when rebreathing maneuvers are carried out, such as resting metabolic rate or FRC determinations. When forced maneuvers, such as MVV, FVC, FEV1 or PEFR are accomplished, the absorbant is removed, thereby reducing resistance in the expiratory system.
As air enters or leaves the spirometer the chain-sus- pended bell rises and falls. These movements are recorded by means of pens moving in parallel. A kymograph drum turns at a preselected pace, adding a time dimension to the volume changes. This allows measurement of the based variables such as MVV, FEV1, FEF25–75, PEF.
Another type of spirometer is the so-called dry rolling seal, also called the Ohio spirometer. A horizontal cylinder is attached to a flexible rolling seal. As air enters, the rolling seal allows the cylinder to move horizontally. Linear transducers attached to the cylinder are interfaced with a computer, allowing measurement of volume over time and flow.
Dry gasmeters typically measure inspired air to avoid accumulation of moisture on a bellows mechanism. The movement of the bellows is transmitted to a circular dial that is labeled with appropriate volumes.
A spirometer that uses a wedge-shaped bellows is called a wedge spirometer (5). The bellows expands and collapses as gas moves in and out. One side is stationary, while the other side moves a pen that records the changes. Pressure activation moves the chart horizontally, giving a time domain to the recording.
The peak flow meter (6) is a spirometer that works on a completely different principle from other spirometers. It is known as a variable orifice meter (Fig. 5), popularized as rotameter gas flow meter on anesthesia machines (7). As air enters the flow meter, a bobbin or light-weight marker is entrained in the vertical column of air. The flow meter has a variable inner orifice dimension that increases with height. The bobbin records the peak flow M, which corresponds to a particular inner orifice (r). The original peak flow meter was developed by F. M. Wright of England in 1959 and is often referred to as the Wright peak flow meter
(6). It is based on Poiseuille’s equation.
M ¼ |
pPr4 |
M ¼ flow |
8n‘ |
r ¼ radius |
|
|
|
FLOW AND VOLUME TRANSDUCERS
Instantaneous flow signals generated from flow transducers discussed below can be integrated with respect to time, thereby obtaining volume measurements. Harmonic analysis of respiratory flow phenomena has shown significant signals out to 20 C.P.S., requiring all devices to respond with fidelity at this frequency (8).
The Fleish Pneumotach (9) quantifies airflow by measuring the pressure drop across an in-line obstruction, such
PULMONARY PHYSIOLOGY |
435 |
Figure 5. A variable orifice flow meter.
as mesh or porous membrane (Fig. 6). The pressure drop follows Poiseuille’s law and is for laminar or nonturbulent flow. To prevent nonlaminar flow, various size pneumotachographs are used for different settings, such as studying children or exercising adults.
A Pitot tube that utilizes the Venturi effect is another type of flow meter (Fig. 7). The pressures of two tubes, one facing and one perpendicular to the air stream, is measured with a differential pressure transducer. Air flow velocity is proportional to the density of the gas and to the square of the pressure difference. They do not depend on laminar flow, typically are low weight and as opposed to pneumotachograms are low resistance breathing circuits.
P1 P2
Airflow
Figure 6. Fleisch pneumotachograph.
P2
Airflow
P1
Figure 7. Pitot tube.

436 PULMONARY PHYSIOLOGY
Airflow
Figure 8. Hot wire anemometer.
Hot-wire anemometers measure mass flow by detecting the increase in current needed to heat a hot wire placed in the air stream as air flows over and cools the wire (Fig. 8).
A turbine transducer uses a low mass helical impeller mounted on bearings. As the impeller blade spins with airflow, an interposed light beam is broken and digital signals proportional to the flow are sent to the pressure sensor (Fig. 9).
The accuracy of each of these flow meters is potentially affected by the temperature, viscosity and density of the gas measured as well as the flow character (laminar or turbulent). When proper calibration is maintained, these devices produce a 3% accuracy, as recommended by the American Thoracic Society Guidelines (10).
GAS ANALYSIS
Rapidly responding (<100 ms) gas analyzers have made breath-by-breath analysis possible. Such measurements of expired oxygen and carbon dioxide give dense data useful in interpretation of cardiopulmonary exercise stress tests. When speed of analysis is not essential, chemical analysis by the Scholander or Haldane methods provide accurate results and are considered the gold standard. Gases measured by this method are used to validate other calibrating gases.
OXYGEN ANALYZERS
Discrete oxygen analyzers commonly used are paramagnetic, fuel cell or zirconium oxide. Each are calibrated over the expected range of measurement (e.g., 12–21%) by validated control gases. Of the three mentioned, the later two respond very quickly and so are used in breath-by- breath analysis. Paramagnetism is a distinctive property of oxygen: The molecules aligning in a magnetic field and thus enhancing it. A typical use of this slower responding analyzer is measuring oxygen concentration in large collecting bags or mixing chambers. Of note, oxygen does not have suitable absorption bands in the ultraviolet (UV), infrared (IR), or visible wavelengths. The following sections discuss gases that do have these properties.
Airflow
Figure 9. Turbine.
NONDISPERSIBLE INFRARED GAS ANALYZERS
This instrumentation (7,11) is used for multiple polyatomic gases including CO2 and CO, commonly measured in pulmonary function testing. An IR beam is directed alternately through a reference and measurement cell. By means of a chopper wheel, a detector senses the alternating change in absorption of selected IR wavelengths. This signal is amplified with a high input impedance ac amplifier, rectified and displayed on a meter or digital recorder.
NITROGEN METER
The fact that nitrogen molecules can be excited in a low pressure electric discharge to emit visible light in the purple region forms the basis of the nitrogen meter (7,11). A 1500 V electric potential difference is maintained and optical filters select appropriate wavelengths in the violet range. The resulting light intensity is measured by a photocell with an amplifier.
MASS SPECTROMETER
Used primarily in research labs, mass spectrometry is capable of analyzing any gas with speed, specificity, sensitivity, and accuracy unmatched by any other method. Molecules of the sample are ionized at low pressure by a beam of electrons, and the ions are deflected in a circular path by a magnetic field. The stream of particles splits into beams of different molecular weight, any one of which can be detected by a suitably placed collector. Due to expense, mass spectometry is not a typical part of clinical (hospital or office-based) pulmonary function testing.
PULMONARY FUNCTION TESTS
Pulmonary function tests do not provide a complete diagnostic picture. At best, they support a clinical impression that is formed by a thorough history, physical exam, and X- ray studies. Given the myriad of lung function tests available, an informed decision on the most important ones to order maximized their usefulness.
SPIROMETRY
A forced exhalation maneuver after a deep inhalation is recorded by a moving kymograph on a small water-filled spirometer. A pneumotachograph with computer interfacing could be used with equally acceptable results. A tracing of volume over time is obtained and the following measurements are derived (Fig. 10). This is called a forced vital capacity maneuver.
FVC |
Forced vital capacity. This value is effort |
|
dependent and depends on the full cooperation |
|
of the patient. |
FEV1 |
From the tracing, the amount of air exhaled in |
|
the first second is measured. Patient effort is |
|
required to obtain a reliable value. |

Figure 10. A normal spirographic tracing volume versus time.
FEV1/FVC
FEF25–75
PEFR
This ratio is helpful in ascertaining airflow obstruction and is typically 70% in normal people.
This is a flow rate and represents the slope DV/DT during the mid-section of the spirometer tracing. It is where dynamic compression of airways occurs (Fig. 11).
Peak expiratory flow rate. The steepest slope on the curve, typically at 80% of the vital capacity maneuver.
MMEF |
Mid-maximal expiratory flow rate is a slope |
|
taken at 50% of the vital capacity maneuver. It |
|
reflects smaller airways airflow. |
All along the spirometric curve, an infinite number of slopes can be determined, from which a flow–volume curve could be constructed. However, a flow signal from a pneumotachograph plotted against time is the preferred method of generating this data.
SVC |
Slow Vital Capacity. Instead of a forced man- |
|
euver, the vital capacity may be performed |
|
with less effort. In normals, the FVC and |
|
FEF25-75 |
liters |
|
1 |
MIDDLE HALF (by volume) OF EXP. |
|
|
2 |
= 2.50 liters in 1.05 s |
3 |
FEF25-75 = 2.38 liters/s |
|
|
4 |
|
5
0 1·0 2·0 3·0
Seconds
Figure 11. The FEF25–75 Slope DV/DT derived from spirogram and expressed in liters per second.
PULMONARY PHYSIOLOGY |
437 |
SVC are equal. Because of air trapping, patients with emphysema more fully exhale with the SVC.
FLOW–VOLUME CURVES
Spirometers and flow-volume curves contain the same information, displayed differently. Below is a typical flow–volume curve generated by a pneumotachograph (Fig. 12). A forced expiratory maneuver is performed. Pneumotachographs can measure peak inspiratory flow volume curves, which are important in diagnosing obstructive supraglottic lesions. Expiratory flow-volume curves can unmask central airway tumors not appreciated on simple spirometry at 50% FVC nor seen on standard chest X ray (12).
This curve reflects phenomena in small airways where dynamic compression occurs. Normally, flow here is dependent on gas density. This fact forms the basis for flow–volume measurements after inhalation of 80% helium–20% oxygen mixtures. When overlayed, the flow–volume curves of smokers show little difference after breathing low density helium–oxygen compared to room air (79% nitrogen–21% oxygen). The density independence reflects increased resistance in diseased small airways and is a very sensitive early indication of smokinginduced lung disease.
LUNG VOLUME
There are three methods for measuring the lung volume FRC or functional residual capacity: body plethysmography, nitrogen washout(13), or helium dilution. Once the FRC is measured, residual volume can be determined by asking a patient to exhale completely from FRC to residual volume (RV). The air left in the lung is the residual volume. The total lung capacity is then determined by measuring a deep inhalation from RV (inspiratory capacity) and adding
12
10
8
Vmax
LPS
6
4
2
TLC |
|
|
|
|
RV |
||
|
|
|
|
|
|
|
|
100 |
80 |
60 |
40 |
20 |
0 |
||
|
|
|
|
% VC |
|
|
|
Figure 12. Flow volume curve. Forced exhalation from TLC to RV ¼ FVC recorded by a pneumotachograph.

438 PULMONARY PHYSIOLOGY
Figure 13. Lung volume. Measurements by a water filled spirometer.
that to the residual volume already measured (Fig. 13).
RV ¼ FRC ERC
ðERC ¼ expiratory reserve capacityÞ TLC ¼ RV þ IC
ðIC ¼ inspiratory capacityÞ
FRC BY PLETHYSMOGRAPHY
A plethysmograph is an airtight box of known volume, similar to a telephone booth, in which a patient sits. A mouthpiece connects the patient to air outside the apparatus and pressure sensors are located within the box and within the breathing capacity. At the end of a normal tidal breath, a shutter on the mouthpiece closes and the subject is asked to make respiratory efforts. As the subject tries to inhale, the volume of the lung expands slightly while the pressure drops due to the chest (lung) expansion (Fig. 14). Applying Boyle’s law, if the pressures in the box before and after the inspiratory effort are P1 and P2, respectively, V1 is the preinspiratory box volume and DV is the change in volume of the box (or lung) DV can be obtained from the
equation P1V1 ¼ P2(V1 þ DV).
Applying Boyle’s law to the gas in the lung,
P3(V2) ¼ P4(V2 þ DV), where P3 and P4 are the mouth pressures before and after the inspiratory effort and V2
is the FRC. Thus FRC can be obtained.
Figure 14. The FRC by whole body plethysmography utilizing Boyle’s law.
The body plethysmograph measures the total volume of compressible gas, including any that is trapped behind closed or poorly communicating airways.
The other two methods measure only volumes based on gas communicating with and open to airways. This is not an issue in normal subjects, but in diseased lungs considerable amounts of gas are trapped and do not communicate freely. Therefore the FRC values differ depending on methodology.
NITROGEN WASHOUT
If a subject quietly breathes 100% oxygen for several minutes, all the nitrogen emptied from the lung can be determined by multiplying the exhaled volume by the exhaled nitrogen concentration. Since the initial lung concentration of N2 is 80%, the measured volume of nitrogen exhaled multiplied by 1/0.8 equals the volume of the lung prior to 100% oxygen breathing. The value of FRC can be underestimated if significant parts of the lung communicate poorly or not at all with the inspired oxygen (13).
HELIUM DILUTION
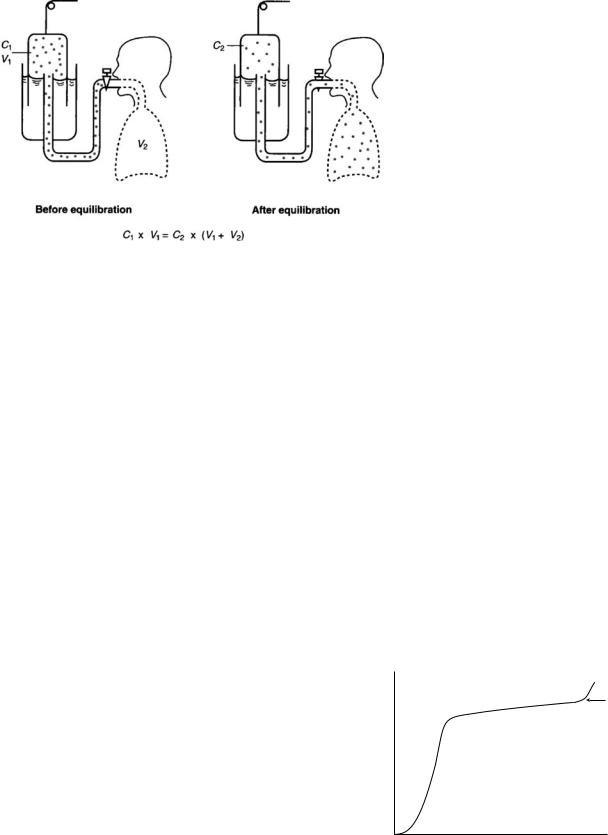
As a subject breathes from a spirometer with a known concentration of helium, after several normal breaths the helium concentration in the lung and spirometer equilibrate (Fig. 15), Since helium is insoluble in blood, none of it is absorbed, so the final equilibrium concentration is a reflection of dilution only. The amount of helium before equilibration is (C1 V1) and equals that after equilibra-
tion C2 (V1 þ V2) solving for V2, V2 ¼ ðC1V1=C2Þ ðV1Þ. During the equilibration period oxygen is added to the
spirometer and carbon dioxide is absorbed.
Although many other measurements of lung function are perhaps more useful, knowledge of the lung volumes is essential in other complex measurements such as diffusing capacity.
DIFFUSING CAPACITY
Given the challenges with measuring the diffusing capacity of the lung for oxygen, carbon monoxide as originally
PULMONARY PHYSIOLOGY |
439 |
used by Marie Krogh in 1914 is used for current day measurements. There are at least seven variations of this method that have since been developed.
The most common of these is the single-breath modified Krogh technique attributed to Kety and Fowler. Both helium and carbon monoxide are inhaled. After a period of breath hold (15 s), the alveolar portion of the exhaled gas is collected and the concentration of carbon monoxide and helium is measured.
The initial alveolar carbon monoxide concentration is calculated thus:
|
He%in expired alveolar sample |
|
|
|
|||
FICO |
|
¼ FACO |
|||||
Inspired helium percentage |
|||||||
DLCO |
|
ln FICO alv |
|||||
¼ |
Alveolar volume STPD 60 |
|
|||||
|
|
|
|
|
|||
Seconds of breath hold PB 47 |
|
FECO alv |
|||||
In the above equation, the alveolar volume is measured by a helium dilution technique similar to that in lung volume determinations.
CLOSING VOLUME
This sensitive test detects early changes in lung function and reflects pathology in the small airways. Smokers have an abnormally high closing volume prior to any other pulmonary function test changes. In this test, the subject inhales a breath of 100% O2 to TLC. During the subsequent exhalation, the nitrogen is measured through the alveolar plateau to an abrupt rise in exhaled nitrogen, so-called phase 4 (Fig. 16). This signals closure of airways in the base of the lungs and preferential emptying of upper airways. Less of the 100% oxygen inhalation is distributed to the upper lung, making it richer in nitrogen. It is this fact that creates phase 4. In some lung diseases, the closing volume is above the FRC. This means that airways close even during normal breathing and is an indication of advanced disease.
MAXIMAL VOLUNTARY VENTILATION
This test measures the volume of air moved during 15 s of repetitive forced deep maximal exhalations. A water filled
Figure 15. Helium equilibration. Technique for FRC determination.
spirometer is used for measurement with a time kymographic tracing. Pneumotachographs with real time computer graphics may be used. The main requirement for accurate test results is a low resistance breathing circuit and avoidance of resonance in the system. Both problems have been overcome by modern spirometers, valves and tubing. Although this is formally a lung test, nonpulmonary factors such as motivation, muscular strength and endurance are very important and must be taken into consideration when interpreting the test. The results are expressed in liters per minute BTPS.
PEAK FLOW
Peak flow meters have the distinct advantage of being handheld, self-contained and thus very portable. This is an effort-dependent test, yet it is an excellent reflection of airways function. Its main utility is quickness and simplicity, and it is often used for the management of asthma. Much like a home glucose meter in a diabetic, the peak flow meter can give objective assessment of airways function throughout the day to help guide treatment and presage severe attacks.
Phase IV
FN2
%
Expired Volume
Figure 16. Abrupt rise at the end of exhalation called phase (IV) correlates with the closing volume.

440 PULMONARY PHYSIOLOGY
STANDARDIZATION OF PULMONARY
FUNCTION TESTS
The American Thoracic Society published standards on spirometry in 1979 at the Snowbird Workshop. An official update was issued in 1994, which details equipment and procedural guidelines to enhance accuracy and reproducibility.
Without meticulous attention to these recommendations, the utility of all pulmonary function tests is compromised.
CARDIOPULMONARY STRESS TESTING
Cardiopulmonary stress testing (14) uncovers disorders of the respiratory system as it functions in the integrated cardiopulmonary response to the metabolic demands of increasing incremental work loads. During the course of a cardiopulmonary stress test, the following variables are measured in real time:
W |
Work |
´ |
|
fc |
Heart rate |
OO2 |
Oxygen consumption |
OCO2 |
Carbon dioxide production |
OE |
Minute Ventilation |
R |
OCO2 /OO2 |
OE/OO2 |
Efficiency of ventilation |
OE/OCO2 |
Efficiency of ventilation |
PETO2 |
End tidal PO2 |
PETCO2 |
End tidal PCO2 |
PECO2 |
Mixed expired CO2 |
The instrumentation required to make these breath-by- breath and time-averaged measurements are rapid responding CO2 and O2 meters; pneumotachograph for flows, ventilation; mixing chamber for collection of exhaled gas; ECG; ergometer cycle, arm, treadmill; computer interface with full graphics in real time.
Limits to exercise appear often in clinical medicine with the presenting problem of dyspnea or shortness of breath on exertion. The genesis of this symptom may reside within either the respiratory or cardiac systems or both simultaneously. Analysis of data obtained from cardiopulmonary stress testing can aid in clinical diagnosis.
Testing begins with an incremental ergometric work load that creates a systemic metabolic response measured as oxygen uptake or consumption. There is a strong reproducible linear relationship between the work load and oxygen consumption. It is derived from the coupling of work and mitochondrial metabolic pathways for cellular energy generation.
With increasing work loads and oxygen consumption, the total ventilation of the lung increases. This requires higher airflow which in normals, even at peak work loads, never reaches flows measured in maximal flow–volume curves. Such is not the case in obstructive lung disorders,
where reduced flow is a hallmark of the disease. Exercise is limited due to the inability to generate flows capable of sustaining the metabolic demands.
As the exercise test progresses real-time analysis of dead space can be measured. Typically the PECO2 ¼ PACO2 ¼ PaCO2 remains constant with the mixed expired CO2 PE CO2 increasing. This is reflected in a decrease in the OE/OCO2 marking increased efficiency as more CO2 is exhaled per breath. By making use of the Bohr equation:
VD=VT ¼ FACO2 FECO2
FACO2
it appears that VD/VT or wasted ventilation decreases with increased exercise. This occurs because lung apical units not perfused but ventilated at rest now are fully perfused and participate in gas exchange. If VD/VT does not decrease with exercise, then it is likely based on a structural disease such as emphysema. The work of breathing at any given work load is higher in these patients in part because VD/VT (wasted ventilation) remains abnormally high.
As the level of incremental work load increases, the delivery of oxygen fails to meet the metabolic demands of tissues and anaerobic metabolism becomes prominent. Lactic acid is dumped into the blood stream and is quickly buffered by bicarbonate, which generates more carbon dioxide. A dramatic upsurge in OCO2 marks this point and is called the anaerobic or metabolic threshold. The parameter RðOCO2=OO2Þ values that previously were 0.8 are now 1.2–1.4, indicating a combined metabolic and buffer source of carbon dioxide. Ventilation (OE) is driven by the chemical stimulation of lactic acidosis in addition to the demands of oxygen delivery.
Data from such a stress test yields much clinically useful information and allows one to differentiate a pulmonary from a cardiac cause for exercise limitations. Cardiopulmonary deconditioning has a distinct pattern as does obesity. Low peak OO2 and low A.T. as a percent of OO2 max are good indications of these two conditions.
Future of Pulmonary Function Testing
No doubt, advances in instrumentation and computers will continue to refine pulmonary function testing. Miniaturization of testing equipment allows complex measurements not only in the laboratory but also in the wild. The burgeoning science of sleep medicine is an example of this.
Epidemiological studies will explore the relationship of pulmonary function to health and uncover what makes the vital capacity so vital to life. A fundamental role for FEV1 in total mortality independent of cigarette smoking has been proposed. Whether reduced lung function leaves an individual open to oxidative stress is unknown.
If pulmonary function proves to be a long-term predictor for overall survival rates in both genders, it could be used as a tool in general health assessment.
The search for tests that implicate early potentially reversible lung disease will continue. The benefit to asymptomatic patients and society as a whole is obvious.

The long-term effects of air pollution and impact of air quality on lung health will always be of prime concern, not only to the general public, but to government officials who set air quality standards.
Perhaps pulmonary function testing will ultimately guide and protect us all.
TERMINOLOGY—DEFINITIONS—EQUATIONS
Spirometer
FRC
FEV1
TLC
RV
FVC
FEF25–75
PEFR
MVV
DLCO
Flow–volume curve
PAO2
PACO2
PETO2
PETCO2
PEO2
PECO2
Oo2
Oco
A measuring device for determining lung volume, its subcompartments, and expiratory flow rates.
Functional residual capacity: The volume in the lung after a normal exhalation. At this volume the recoil pressure of the lungs inward is exactly balanced with the outward recoil pressure of the chest wall.
Forced expiratory volume in the first second:The amount ofairexpired in the first second of a forced expiratory maneuver.
Total lung capacity.
Residual volume: The volume of air left in the lungs after a full exhalation.
Forced vital capacity: The amount of air exhaled during a complete exhalation.
Forced expiratory flow: The mean expiratory flow measured between 75 and 25% of the vital capacity during forced exhalation.
Peak expiratory flow rate during forced exhalation.
Maximal voluntary ventilation expressed in liters per min.
Diffusing capacity for carbon monoxide.
A maximal exhalation measuring flow versus volume.
Alveolar oxygen partial pressure.
Alveolar carbon dioxide partial pressure.
End tidal oxygen partial pressure.
End tidal carbon dioxide partial pressure.
Mixed expired oxygen partial pressure.
Mixed expired carbon dioxide partial pressure.
Volume of oxygen take up per minute.
Volume of carbon dioxide output per minute.
|
PULMONARY PHYSIOLOGY |
441 |
OE |
Minute ventilation: Total volume of |
|
|
air expressed per minute from the |
|
|
lungs. |
|
VT |
Tidal volume: The volume of a single |
|
|
breath. |
|
VD |
The volume of physiological dead |
|
|
space. |
|
VD/VT
VA
General gas law Boyle’s law
Charles’s law
Poiseuille’s law
Bohr equation
The ratio between dead-space volume and tidal volume. This ration indicates the efficiency of ventilation.
Volume of alveolar gas in the tidal volume.
PV ¼ RT
P1V1 ¼ P2V2 (temperature constant)
V1 ¼ T1 (pressure constant)
V2 T2
V˙ ¼ Ppr4
8n
P ¼ Pressure difference across length ‘ and radius r
n ¼ Coefficient of viscosity
VD=VT ¼ PACO2 PECO2
PACO2
BIBLIOGRAPHY
1.Hutchinson J. On the capacity of the lungs, and on the respiratory functions, with a view of establishing a precise and easy method of detecting disease by the spirometer. Med Chir Trans (London) 1846;29:137.
2.Comroe JH Jr. Retrospectoscope. Insights into medical discovery. Menlo Park, (CA): Von Gehr Press; 1977.
3.Otis AB, Rahn H. Developments of Concepts in Rochester,
New York, in the 1940’s. In: West JB, editor. Pulmonary Gas Exchange Volume 1. New York: Academic; 1980. pp. 33– 65.
4.Bates DV, Macklem DT, Christie RV. Respiratory Function in Disease. 2nd ed. Philadelphia: Saunders; 1971.
5.Horton GE, Phillips S. The expiratory ventilagram: application of total and time vital capacities and maximal expiratory flow rate, as obtained by a bellows apparatus, for bedside and office use. Am Rev Respir Dis 1959 Nov; 80:724–731.
6.Wright BM, McKerrow CB. Maximum forced expiratory flow rate as a measure of ventilatory capacity: with a description of a new portable instrument for measuring it. Br Med J 1951 Nov. 21; 5159:1041–1046.
7.Hill DW. Physics Applied to Anesthesia. New York: Appleton- Century-Crofts; 1972.
8.McCall CB, Hyatt RE, Noble FW, Fry DL. Harmonic content of certain respiratory flow phenomena of normal individuals. J App Physiol 1957 Mar; 10(2):215–218.
9.Bouhuys A. The clinical use of pneumotachography. Acta Med Scand 1957 Nov. 15; 159(2):91–103.
10.Standardization of Spirometry. Official statement of the American Thoracic Society. Am J Respir Crit Care Med. 1995;152:1107–1136.
11.Gaensler EA. Evaluation of pulmonary function: methods. Annu Rev Med 1961;12:385–408.