

50 NEUTRON BEAM THERAPY
35.Procedings of 7th international conference on nuclear analytical methods in the life science; June 16–22, 2002, Antalya Turkey: J Radioanal Nucl Chem 2004;259:1–539.
36.Proceedings of the International Conference on Nuclear Analytical Methods in the Life Sciences – Sep. 1998, Beijing, China: Bio. Trace Elem; 1999;71(2).
37.Proceedings of the 10th international conference on modern trends in activation analysis, 19–23, April, Maryland: 1999. J Radioanal Nucl Chem 2000;244:1–704 and 245:1–228.
38.Proceedings of the 11th international conference on modern trends in activation analysis; 20–25 June, Guildford, UK: 2004. J Radioanal Nucl Chem 2005; in progress.
Reading List
Afassi ZB. Activation analysis. Boca Raton: CRC; 1990. Ehmann WD, Vance DE. Radiochemistry and Nuclear Methods of
Analysis. New York: John Wiley & Sons; 1991.
Parry SJ. Activation spectrometry in chemical analysis. New York: John Wiley & Sons; 1991.
See also BORON NEUTRON CAPTURE THERAPY; RADIONUCLIDE PRODUCTION AND RADIOACTIVE DECAY; TRACER KINETICS.
NEUTRON BEAM THERAPY
RICHARD L. MAUGHAN
Hospital of the University of
Pennsylvania
INTRODUCTION: THE ORIGINS OF FAST NEUTRON THERAPY
The year 1932 was a remarkable one at the Cavendish Laboratory of the University of Cambridge. It represented a pinnacle of achievement for Lord Ernest Rutherford and his collaborators in the nuclear physics laboratories. The results of three experiments performed in this single year resulted in Nobel Prizes in physics for four of the university faculty. Two of these experiments were of great significance for the production of neutrons. Of course, the most significant was the discovery of the neutron itself by James Chadwick in February, 1932 (1). Chadwick needed a source of neutrons to perform this experiment. At that time, the only sources of energetic heavy particles were naturally occurring isotopes that emitted alpha particles. Chadwick’s neutron source was comprised of a polonium source (210Po), which emits a 5.3 MeV alpha particle and a block of beryllium housed in a vacuum chamber. The nuclear reaction
a þ 9Be ! 12C þ n
produces a flux of neutrons with energies of several million electronvolts (MeV). To detect these neutrons, Chadwick used an ionization chamber with a thin entrance window. Pulses could be observed on a oscillograph as the source was brought closer to the ionization chamber. The chamber was air filled and the increasing count rate was interpreted as being due to recoil nitrogen nuclei in the chamber. When a sheet of paraffin wax was placed in between the source
and the ionization chamber a further increase in the source count rate was observed and interpreted as resulting from recoil protons from n–p elastic scattering. Further measurements confirmed that the particles producing the recoil protons were neutral particles of the same mass as the proton. With this simple and elegant apparatus Chadwick discovered the neutral nuclear particle, the existence of which Rutherford had postulated in 1919.
Sources of this type give very low neutron fluxes and are not suitable for neutron radiation therapy or radiobiology. It was another of the Nobel Prize winning discoveries of 1932 at Cavendish Laboratory that offered the means for producing intense sources of neutrons. This was the discovery of artificial transmutation of nuclei by John Cockroft and Ernest Walton in April 1932. In this experiment, Cockroft and Walton used their specially designed highvoltage apparatus (now commonly known as a Cockroft– Walton accelerator) to produce protons of energy 700 keV. When these protons interacted with a lithium target, the resulting mass eight compound nuclei disintegrated into two alpha particles with the release of 17 MeV of energy
p þ 7Li ! 4He þ 4He
The alpha particles were detected as scintillations on a zinc sulfide screen and, in order to observe these events, Cockroft or Walton had to sit in a small darkened enclosure at the end of the accelerator tube (2).
Although this first artificial splitting of the atom did not involve the production of neutrons, it was not long before another Rutherford’s research team, Mark Oliphant, was to apply the new technology to an experiment to demonstrate the fusion of deuterium nuclei. In this reaction, the products are helium 3 and a neutron
2H þ 2H ! 3He þ 1n
The reaction has a positive Q value of 3.27 MeV and a deuteron beam of 400-keV energy produces neutrons with energies up to 3.5 MeV.
This experiment was performed in 1934 and almost immediately L.H. Gray, yet another of Rutherford’s exstudents, working as one of the first British medical physicists at Mount Vernon Hospital in Northwood, England, realized the potential of this reaction as a source of neutrons for radiobiology research. The ability of neutrons to produce ionizing radiation in the form of heavy recoil particles had been realized soon after their discovery and that these particles might be able to produce biological damage similar to that produced by the recoil electrons associated with X ray beams and radium sources had also been recognized. Neutrons are heavy particles and can transfer relatively large amounts of energy to their secondary recoil particles in comparison to the recoil electrons produced when X rays interact with matter. The neutrons are, therefore, capable of high linear energy transfer (LET) to the recoil particles associated with them and for this reason are known as high LET particles. Gray and others observed that the very great difference between the distribution of ions along the track of a recoiling nucleus and a fast electron made it probable that the biological action of neutrons would show interesting differences from that of

the other radiations. It was hoped that a study of these differences would throw light on the mode of action of radiations on biological material. There was also the possibility that eventually neutrons might prove a more potent means of treating cancer (3).
Gray obtained funding to build a 400 keV Cockroft– Walton accelerator in which he used the deuteron–deuteron reaction to produce a neutron beam for radiobiology research (3). The capital cost of the unit was $2400 with maintenance costs of $320/annum for 1937 and 1938. The unit was housed in a wooden shed.
Concurrently, progress was being made in accelerator technology in the United States by another renowned physicist, Ernest O. Lawrence. Lawrence’s invention of the cyclotron earned him the 1939 Nobel Prize for physics and provided a means for producing ion beams with energies of several tens of million electronvolts, far in excess of the energies obtained by Cockroft and Walton with their accelerator. Ernest Lawrence’s brother, John, was a physician and the two brothers soon realized the potential medical benefits of applying neutron beams produced by accelerated protons or deuterons. In 1938, funding was obtained from the National Cancer Institute (NCI) for the construction of a 60 in. medical cyclotron; this was the first NCI research grant. This cyclotron was used to produce a neutron therapy beam using a 16 MeV deuteron beam incident on a thick beryllium target. With the use of this beam, Dr. Robert Stone performed the first clinical trials of fast neutrons.
Hence, by 1938 accelerated beams of particles were being used to produce high intensity neutron beams for radiobiology and/or external beam radiation therapy research in both the United States and the United Kingdom.
RADIOBIOLOGICAL RATIONALE FOR FAST NEUTRON THERAPY
The first clinical trials of neutron therapy were performed at the University of California in Berkeley, and were interrupted by the Second World War, when the Berkeley cyclotron was utilized for nuclear physics research associated with the Manhattan Project. Patients with advanced inoperable head and neck tumors were treated with neutron therapy using the same number of treatment sessions, or fractions, as was normally used for conventional X-ray therapy. Although remarkable tumor regression was seen in a few cases, this was at the cost of excessive damage to the surrounding irradiated normal tissues. In 1947, Stone concluded that ‘‘ neutron therapy as administered by us has resulted in bad late sequelae in proportion to the few good results that it should not be continued’’, (4). The trials had been undertaken to test the hypothesis that neutron radiation may be superior to X-ray radiation in curing human cancers. However, at the time little was known about the radiobiological effects of neutron irradiation in comparison to conventional X-ray irradiation. It was not until later, when some basic radiobiological research on the effects of neutron irradiation on mammalian cells had been completed, that the reasons for the failure of this original clinical trial could be understood. Further neutron radio-
NEUTRON BEAM THERAPY |
51 |
biology research enabled a firm rationale for neutron therapy to be established.
When mammalian cells are irradiated in vitro by ionizing radiation (X rays or neutrons) cells are killed in proportion to the radiation dose delivered. A plot of the cell kill as a function of the radiation dose, or survival curve, is markedly different in shape depending on whether the cells are irradiated by X rays or fast neutrons. This finding is illustrated in Fig. 1, taken from the work of McNally et al. (5). On a log-linear plot at high doses the response appears linear (i.e., exponential), but at low doses there is a ‘‘shoulder’’ on the survival curve. This shoulder is more pronounced for X ray irradiations than for neutron irradiations. Another point to notice is that for a given radiation dose the cell-kill by fast neutrons is greater than for X rays. The relative biological effectiveness (RBE) of neutrons relative to X rays is defined as the ratio the dose of X rays required to produce a given level of cell-kill compared to the dose of fast neutrons required to give the same cell kill. Because of the different shapes and sizes of the shoulders on the neutron and X ray cell survival curves it can be seen from Fig. 1 that the RBE at a surviving
100
10−1
fraction |
10−2 |
|
Surviving |
||
|
X
10−3
N
10−4
0 |
10 |
20 |
30 |
|
|
Dose / Grays |
|
Figure 1. Survival curve for WHFIB mouse tumor cells irradiated with fast neutrons and X rays. Reproduced with permission from McNally, et al. Rad. Res. 1982;89:234.
52 NEUTRON BEAM THERAPY
100
V 79 |
WHFlB |
|
fractionSurviving |
10−1 |
|
|
|
|
|
|
|
|
|
|
|
|
|
|
|
|
|
|
|
|
|
|
|
|
|
|
|
|
|
|
|
|
|
|
|
|
|
|
||
|
|
|
|
|
|
|
|
|
|
|
|
|
|
|||||||
|
|
|
|
|
|
|
|
|
|
|
|
|
|
|
|
|
|
|
|
|
|
|
|
|
|
|
|
|
|
|
|
|
|
|
|
|
|
|
|
|
|
|
|
|
|
|
|
|
|
|
|
|
|
|
|
|
|
|
|
|
|
|
|
|
|
|
|
|
|
|
|
|
|
|
|
|
|
|
|
|
|
|
|
|
|
|
|
|
|
|
|
|
|
|
|
|
|
|
|
|
|
|
|
|
|
|
|
|
|
|
|
|
|
|
|
|
|
|
|
|
|
|
|
|
|
|
|
|
|
|
|
|
|
|
|
|
|
|
|
|
|
|
|
|
|
|
|
|
|
|
|
|
|
|
|
|
|
|
|
|
|
|
|
|
|
|
|
|
10−2 |
|
|
|
|
|
|
|
|
|
|
|
|
|
||||||
|
|
|
|
|
|
|
|
|
|
|
|
|
|
|||||||
|
|
|
|
|
|
|
|
|
|
|
|
|
|
|||||||
|
|
|
|
|
|
|
|
|
|
|
|
|
||||||||
|
|
|
|
|
|
|
|
|
|
|
|
|
|
|
|
|
|
|
|
|
10−3
0 |
10 |
20 |
30 |
0 |
10 |
20 |
Dose / Grays
Figure 2. Survival curves for V79 and WHFIB cells, irradiated in air and hypoxia. Squares, X rays; circles neutrons; open symbols, air; solid symbols hypoxia. Reproduced with permission from McNally, et al. Rad. Res. 1982;89:232.
fraction of 10 2 (i.e., a relatively high dose) is 3.8, while for a surviving fraction of 3 10 1 (i.e., a lower dose) the RBE increases to 5. John Lawrence measured the RBE in nonhuman biological systems, prior to commencing the Berkeley fast neutron therapy trials with Robert Stone, using large single doses of radiation to produce an observable biological effect. Based on an RBE measured at high single doses, they calculated the required total neutron dose from a knowledge of the total X ray doses delivered to cancer patients at that time. Unfortunately, radiation therapy doses are delivered as a large number of small doses and at these smaller doses the RBE is much larger, hence, the fast neutron dose delivered to patients in the original fast neutron trial was overestimated by a considerable margin. This of course resulted in good tumor control compared to conventional X rays, but also produced an unacceptable level of normal tissue damage. It was not until 1971 that Sheline et al. (6) explained this phenomenon.
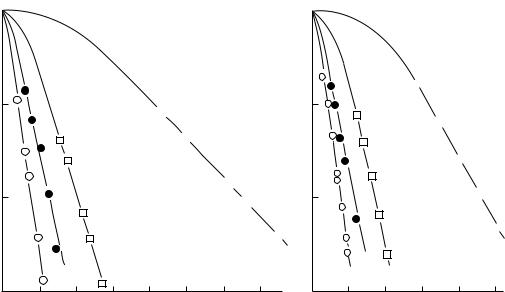
In the meantime, L.H. Gray working at Hammersmith Hospital had described a logical rationale for fast neutron therapy. In 1954, in a landmark paper in radiation therapy, Thomlinson and Gray described how, in a poorly vasculated tumor, areas of reduced oxygenation, or hypoxia, can exist as the distance from blood vessels increases (7). If oxygenation drops low enough, the cells become necrotic and die. Gray showed, using diffusion kinetics, that an oxygen concentration gradient can exist within a tumor and that in certain areas of the tumor there may be severely hypoxic, yet viable cells. How this phenomenon can be exploited to advantage in fast neutron therapy is illustrated in Fig. 2. In this figure, cell survival curves for cells irradiated by both X rays and fast neutrons in an oxygen (oxic) and a nitrogen (anoxic) environment are
plotted. The anoxic cells are more resistant to radiation than the oxic cells and as tumors are poorly oxygenated and contain anoxic cells this could well result in an inability to deliver sufficient radiation to kill all the tumor cells, leading to tumor recurrence. Normal tissues are well oxygenated and, therefore, are more easily damaged. Hence, it is possible that the doses to the normal tissues surrounding the tumor may reach their acceptable tolerance level before sufficient dose has been delivered to the hypoxic tumor cells to eradicate them. Figure 2 shows that the differential cell killing for oxic and anoxic cells is much greater for X rays than for fast neutrons. Thus for a given level of normal tissue, cell kill or damage neutrons should be more effective at killing hypoxic cells in the tumor than conventional X- ray therapy. It was this hypothesis that lead to the restarting of fast neutron clinical trials at Hammersmith Hospital in London in 1970. The encouraging results obtained at Hammersmith Hospital rekindled interest in fast neutron therapy and by 1980 there were close to 20 centers treating patients.
The clinical results showed that fast neutron therapy appeared to be particularly effective in the treatment of slow growing tumors such as adenocarcinoma of the prostate and bladder. In the meantime, radiobiology research had revealed another important difference between X rays and fast neutrons related to the variation of the radiation sensitivity of mammalian cells at different phases of the mammalian cell cycle. Mammalian cells exhibit welldefined stages in their cycle first described by Howard and Pelc (8). Figure 3 shows a schematic representation of the phases of the cell cycle. Cells spend most of their time in a quiescent phase known as G1 (gap 1), after the G1 phase they move into a phase during which duplicate DNA is synthesized, the S phase. Following DNA synthesis there
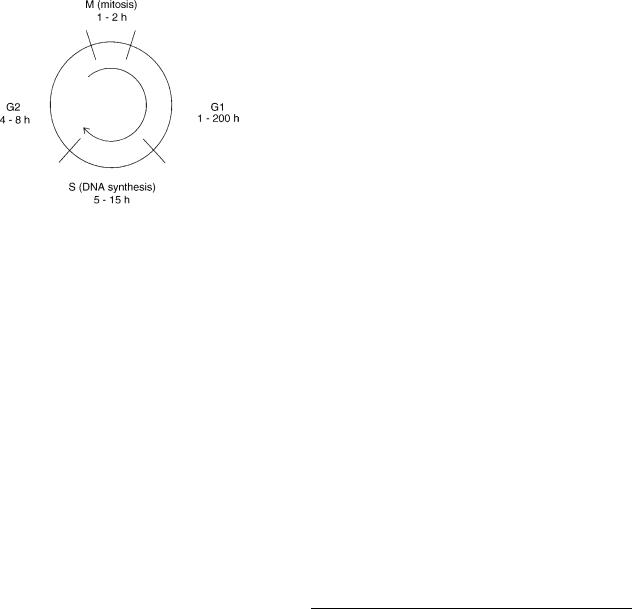
Figure 3. Schematic representation of the phases of the cell cycle.
is another gap phase, G2, which precedes cell division or mitosis (the M phase). The S, G2, and M phase have a similar duration for all mammalians cells, being typically 8, 4, and 1 h, respectively. It is the G1 phase that varies for rapidly and slow growing cells, being as short as 1 h for fast growing cells and as long as 200 h for slow growing cells. The variation in the radiosensitivity of cells irradiated with conventional X rays at different phases of the cell cycle can be considerable (9). The late G1 phase is a relatively radioresistant phase and in cells with a long G1 there is also a period of radioresistance during early G1. As a result, slow growing cells, which spend a larger proportion of the cell cycle in G1 phase than rapidly proliferating cells, would be expected to be more resistant to radiation than the fast growing cells. Withers et al. (10) have shown that the variation of cell sensitivity during the cell cycle is less for fast neutron irradiation than for conventional X-ray radiation. This is a potential advantage for fast neutron therapy, since is means that neutrons are relatively more effective in killing cells in the radioresistant phases of the cell cycle. This would explain the observed efficacy of neutrons in the treatment of slow growing tumors. Another observation, which confirms the efficacy of fast neutrons in treating slow growing tumors, was made by Battermann et al. (11), who showed that the relative biological effectiveness of fast neutrons increases with tumor doubling time.
Thus by the early 1980s it had been established that fast neutron therapy could be justified on radiobiological rationale related to both tumor hypoxia and volume doubling time.
REVIEW OF CLINICAL RESULTS
After the original unsuccessful clinical trials at Berkeley, fast neutron therapy was restarted in 1970 by Dr. Mary Catterall, at Hammersmith Hospital in London. Although Dr. Catterall’s studies were not controlled clinical trials they did demonstrate the potential efficacy of fast neutron therapy in the treatment of advanced or recurrent tumors. The success of these studies lead to the establishment of many fast neutron therapy centers around the world and to the instigation of a number of clinical studies of those tumors thought to be the most promising candidates for
NEUTRON BEAM THERAPY |
53 |
neutron therapy. These tumors included advanced inoperable tumors of the salivary glands; squamous carcinoma of the head and neck; adenocarcinoma of the prostate, rectum, bladder, and soft-tissue; oesteoand chondrosarcomas. The results of these studies demonstrated that fast neutron therapy was particularly promising for the treatment of salivary gland tumors, prostate tumors, and bone tumors. The results for squamous carcinoma of the head and neck, however, were ambiguous. Prompted by these results, the NCI in the United States decided to fund four purpose-built hospital-based neutron therapy facilities to contribute to a definitive series of controlled clinical trials performed at these and other approved centers.
The NCI trials were undertaken in two phases starting with dose searching studies, designated as phase II trials, followed by efficacy studies (phase III trials). The patient accrual into these trials is shown in Table 1. The phase II trials established the general treatment protocol for the phase III studies, that is, a dose of 20.4 Gy would be delivered in 12 fractions over 4 weeks and after 13.6 Gy abdominal and pelvic treatment fields would be reduced in size.
Of the seven phase III trials undertaken, only three were successfully completed; the head and neck, lung, and prostate trials. The salivary gland trial was terminated early; the investigators thought it unethical to continue with randomization because of the excellent results obtained with neutron therapy (12). The remaining three trials were closed because of poor patient accrual. The only other trial to yield a positive result was the prostate trial (13). This trial also highlighted the importance of shaping the beam to conform to the tumor outline. The three centers contributing patients to this trial had facilities with different beam collimation systems of varying degrees of sophistication. The occurrence of normal tissue complications in the bladder and rectum was closely related to the
Table 1. Patient Accrual for NCI–NTCWG Clinical Trials Using the New Generation of Neutron Therapy Facilities in the United States (1984–1991)
Site |
No of Patients |
|
|
Dose searching studies |
|
Head and neck |
59 |
Thorax |
169 |
Abdomen |
78 |
Pelvis |
102 |
Extremity |
92 |
Subtotal |
500 |
|
|
Phase III studies |
|
Salivary gland |
9 |
Head and neck (squamous) |
178 |
Lung |
232 |
Prostate |
178 |
Cervix |
28 |
Rectum |
2 |
Resistant histology |
47 |
Subtotal |
674 |
|
|
Total accrual |
1174 |
|
|

54 NEUTRON BEAM THERAPY
sophistication of the beam collimator. The University of Washington, which utilized a sophisticated multileaf collimator for beam shaping, had the least number of treatment related complications, while the M.D. Anderson Hospital in Houston, which used an insert-based collimation with limited shaping capability, had the greatest number of normal tissue complications (13).
An earlier NCI funded Phase III trial for advanced adenocarcinoma of the prostate had shown that a mixedbeam treatment regimen of 60% photons combined with 40% neutrons was superior to conventional photon only therapy (14). With this in mind, Forman et al. (15) undertook a series of in-house neutron therapy trials at Wayne State University using mixed-beam therapy (50% photons and 50% neutrons) for early and some late stage patients. This trial also utilized a sophisticated beam shaping system, a multirod collimator. These trials demonstrated that mixed-beam therapy is as effective as any other state-of- the-art radiation therapy techniques (Intensity Modulated Radiation Therapy or IMRT, proton therapy, brachytherapy) in the treatment of early stage prostate cancer, and that it is probably superior for the treatment of late stage disease (15).
Full reviews of neutron therapy in the treatment of cancer can be found in the work of Wambersie et al. (16) and in a recent International Atomic Energy Agency (IAEA) publication (17). The IAEA report concludes that fast neutrons are superior to photons in the treatment of salivary gland tumors (locally extended, well differentiated), paranasal sinuses (adenocarcinoma, adenoid cystic carcinomas, and possibly other histologies), some tumors of the head and neck (locally extended, metastatic adenopathies), soft tissue sarcomas, osteosarcomas, chondrosarcomas (especially slowly growing/well differentiated), prostatic adenocarcinomas (locally extended), and melanomas (inoperable and recurrent). The IAEA report also identifies tumors for which conflicting or incomplete results have been reported and for which additional studies are necessary, these include inoperable pancreatic tumors, bladder carcinoma, recurrent and inoperable adenocarcinoma of the rectum, tumors of the esophagus, locally advanced tumors of the uterine cervix, and brain tumors for treatment with a neutron boost irradiation before or after X-ray therapy.
NEUTRON SOURCES FOR RADIATION THERAPY
Characteristics of Neutron Sources for Medical Use
In order to be useful for medical applications, fast neutron therapy facilities must meet a set of minimum requirements. As described above, in the early years of the 1970s many neutron therapy centers were set up to carry out clinical trials. Most of these centers made use of existing physics research accelerators (cyclotrons or proton linacs), which were adapted for clinical use. The trials produced results, which were often ambiguous and much of this ambiguity was ascribed to the inadequacies of the equipment. When the NCI in the United States decided to fund a number of therapy facilities, the basic specifications for these accelerators were defined to ensure that the equip-
Table 2. Summary of Some of the Key Requirements for a Hospital-Based Neutron Therapy Facility as Defined by the NCIa
Neutron beams having build-up and depth-dose characteristics equivalent to 4 MV X rays, penumbra not less sharp than 60Co gamma-ray beams, and dose rates not less than 20 cGy/min.
Preferably an isocentric beam delivery system and as a minimum one horizontal and/or vertical beam delivery port.
Access to the neutron beam therapy facility for a minimum of 8 h/ day, 4 days/week, 45 weeks/year for patient treatment and 16 h/ week additional for physics and biology.
Methodology for providing a variety of square, rectangular, and
irregularly shaped fields ranging in size from 5 5 cm2 to 20 20 cm2.
Capability to shape treatment fields using a variety of wedges and blocks so that any treatment field normally used for conventional X ray therapy can be reproduced on the neutron beam.
aSee Ref. (18).
ment would be adequate to allow meaningful clinical trials to be completed (18); the key requirements are summarized in Table 2. All the facilities funded by the NCI were hospital-based and had rotational isocentric capability, that is, the neutron beam could be rotated around the patient in the treatment position.
Several of these requirements depend critically on the neutron source. In particular, the attenuation (depth-dose) characteristics of the beam, the neutron dose rate (treatment time), and the reliability of the device may be dependent on the neutron source and the means of neutron production.
In order to fully characterize a neutron source it is necessary to have a detailed knowledge of a number of physical characteristics of the neutron beam. Most importantly, the physical data must be sufficient to allow for the accurate calculation of the physical dose delivered both to the tumor site and the surrounding normal tissues in the patient. In addition, physical data may also be necessary to adequately interpret the biological effects that are observed with high linear energy transfer (LET) beams. Table 3 lists the type of data, which are necessary to fully characterize the neutron source. These data are also necessary to fully assess the relative merits, usefulness, and
Table 3. Physical Data Necessary to Characterize Neutron Sources for Radiation Therapy
Total neutron yield or dose or kerma rate.
Neutron spectrum (i.e., Neutron yield as a function of neutron energy).
Neutron yield as a function of angle relative to the forward direction of the beam.
Neutron dose as a function of depth in a water phantom (i.e, depthdose data).
Relative neutron dose as a function of the lateral postion (i.e, dose profiles).
The microdosimetric properties of the beam (i.e., the LET distribution of the secondary particles).
Neutron interaction data (cross-sections or kerma) for the interaction for the neutron beam with the constituent nuclei of tissue (C, N, O, H, Ca).
suitability of the various different neutron sources for radiation therapy applications. Much of the data in Table 3 are interconnected. In theory, a detailed knowledge of the neutron spectrum as a function of angle should be sufficient to calculate the other data provided there are comprehensive data on the nuclear cross-sections for the interaction of the neutrons with all the various biological target nuclei involved across the energy range of interest. Although, these data do exist for fast neutron beams they are not comprehensive and performing the necessary calculations with Monte Carlo codes remains a formidable and time consuming task. For this reason, until now it has proved simpler and more efficient to rely on various types of direct measurements to collect the necessary data; this situation may change in the future.
Basic Source Data
Neutron Yield. Neutron yields may be measured using a suitable detector that counts the number of particles arriving at the detector with no regard to the energy of the particle. Such detectors must usually be calibrated in order to determine their absolute efficiency. An excellent account of neutron detectors can be found in the work of Knoll (19). Neutron yields are generally expressed in terms of neu-
trons per steradian per microcoulomb of incident beam charge (mC 1 sr 1).
Neutron Spectra. Neutron spectra are measured using a variety of neutron detectors (19,20). For a spectral measurement, the detector must exhibit an energy response in which the magnitude of the detector signal is proportional to the energy of the incident neutrons. Such detectors must also be calibrated so that correction can be made for their counting efficiency.
In a spectrum measurement, the neutron yield is measured as a function of energy (mC 1 MeV 1 sr 1). The total neutron yield at a particular angle can be calculated from a spectral measurement by integrating over the neutron energy.
Neutron Dose. Neutron dose is most easily and accurately measured using the methods of mixed-field dosimetry (21). A tissue equivalent plastic ionization chamber is used to measure the total neutron plus gamma-ray dose and a Geiger–Muller (GM) tube is used as a neutron insensitive detector. From the two measurements, the neutron and gamma-ray dose can be determined separately. This does not mean that spectral and kerma data are not important. Indeed, the calculation of dose from an ionization chamber reading involves the use of factors, which rely on the exact nature of the neutron spectrum (e.g., kerma ratios and the energy to produce an ion pair). These factors are readily available in the literature in ICRU Report No. 46 (22). In practice, it is sufficient to measure the total dose only, since the percentage of gamma-ray dose is relatively small and its biological effectiveness is 3 times less than an identical neutron dose.
Microdosimetric Measurements. Microdosimetric data are most commonly measured using a Rossi type A-150
NEUTRON BEAM THERAPY |
55 |
tissue equivalent plastic proportional counter in which the sensitive volume of the counter is filled with a tissue equivalent proportional counter gas at reduced pressure (23). Typically, the internal diameter of these counters is 12.7 mm, and when filled to a pressure of 8.8 kPa with propane-based tissue equivalent gas, the counter simulates a sphere of solid tissue of diameter 2 mm. The counter detects the energy deposited in the gas as recoil particles traverse the gas volume after a neutron interaction has occurred in the plastic wall of the counter. From a knowledge of the counter geometry, it is possible to calculate the energy deposited per unit path length (keV/mm) (24). The microdosimetric spectrum is usually plotted as a single event spectrum in which the event size (y), in units of keV/ mm, is plotted on a log scale as the ordinate and the differential dose distribution in event size (y) per unit logarithmic interval, y d(y), is plotted on a linear scale as the abscissa. A typical microdosimetric spectrum plotted in this form is shown in Fig. 4. In this representation, the area under the curve represents the total dose. The various peaks in the curve can be interpreted as due to the different components of the dose, gamma-rays, recoil protons, alpha particles, and recoil heavy ions. Hence, such plots can be used to distinguish between neutron beams produced by different sources. A detailed account of microdosimetric methods can be found in ICRU Report No. 36 (24).
Beam Characteristics. From a practical radiation therapy physics point of view, the most useful data is that which allows you to calculate the neutron radiation dose distribution within the patient. A detailed knowledge of the neutron fluence and energy is not necessary to make these calculations. In radiation therapy measurements of absorbed dose in a water tank, 60 60 60 cm3 are made using a small volume (typically 0.3 cm3) ionization chamber; the tank is known as a ‘‘water phantom’’. Neutron dose at a point in the phantom must be determined at a known depth, field size, and source-to-surface distance
0.4
2.5 cm depth, 7 cm off-axis Complete spectrum
0.3Gamma component Proton component Heavy ion component
yd(y) |
0.2 |
|
|
|
|
|
|
|
|
|
|
|
|
|
0.1 |
|
|
|
|
|
|
0.0 |
|
|
|
|
|
|
10−2 |
10−1 |
100 |
101 |
102 |
103 |
Lineal energy y (kev/ m)
Figure 4. A typical microdosimetric event size spectrum measured with a tissue equivalent plastic Rossi proportional counter. The portions of the spectrum attributable to recoil electrons from gamma-ray interactions and recoil protons, alphas, and heavy ion recoils (C12, N14, and O16) from neutron interactions are identified. Reproduced with permission from Kota and Maughan, Med. Phys. 1996;23:1593.
56 |
NEUTRON BEAM THERAPY |
|
|
|
|
|
|
|
|
Table 4. A Comprehensive List of All Neutron Therapy Centers |
|
|
|
|
|||||
|
|
|
|
|
|
|
|
|
|
Facility |
|
Reaction |
Type of Machine |
Z50, cm |
Dmax, cm |
Beam Type |
Beam Shaping |
First Tx |
Status |
|
|
|
|
|
|
|
|
|
|
Berkeley |
|
d(16.0)Be |
Cyclotron |
8.8 |
0.2 |
Fixed |
Inserts |
1938 |
Closed |
London |
|
d(16.0)Be |
Cyclotron |
8.8 |
0.2 |
Fixed |
Inserts/Jaws |
1966 |
Closed |
Dresden |
|
d(13.5)Be |
Cyclotron |
7.9 |
0.2 |
Fixed |
Inserts |
1972 |
Closed |
Houston MDAH |
d(50)Be |
Cyclotron |
13.1 |
0.8 |
Fixed |
Inserts |
1972 |
Closed |
|
Washington MANTA |
d(35)Be |
Cyclotron |
11.7 |
0.5 |
Fixed |
Inserts |
1973 |
Closed |
|
Univ. of Washington |
d(21)Be |
Cyclotron |
9.4 |
0.2–0.3 |
Fixed |
Inserts |
1973 |
Closed |
|
Chiba-Chi |
d(30)Be |
Cyclotron |
10.8 |
0.5 |
Fixed |
Multileaf |
1975 |
Closed |
|
Fermi Lab |
p(66)Be |
Proton Linac |
16.6 |
1.6 |
Fixed |
Inserts |
1976 |
Open |
|
Amsterdam |
d(0.25)T |
D–T |
10.3 |
0.2–0.3 |
Rotational |
Inserts |
1976 |
Closed |
|
Essen |
|
d(14.3)Be |
Cyclotron |
8.1 |
0.2 |
Rotational |
Inserts |
1976 |
Open |
Glasgow |
|
d(0.25)T |
D–T |
10.3 |
0.2–0.3 |
Rotational |
Inserts |
1977 |
Closed |
Manchester |
d(0.25)T |
D–T |
10.5 |
0.2–0.3 |
Rotational |
Inserts |
1977 |
Closed |
|
Heidelburg |
d(0.25)T |
D–T |
10.6 |
0.3 |
Rotational |
Inserts |
1977 |
Closed |
|
Hamburg |
d(0.5)T |
D–T |
8.8 |
0.25 |
Rotational |
Inserts |
1977 |
Closed |
|
Cleveland (GLANTA) |
p(25)Be |
Cyclotron |
10.3 |
0.5 |
Fixed |
Inserts |
1977 |
Closed |
|
Louvain-la-Neuve |
p(65)Be |
Cyclotron |
17.5 |
1.8 |
Fixed |
Multileaf |
1978 |
Closed |
|
Tokyo |
|
d(14.0)Be |
Cyclotron |
8.3 |
0.2 |
Fixed |
Inserts |
1978 |
Closed |
Krakow |
|
d(12.5)Be |
Cyclotron |
7.7 |
0.2 |
Fixed |
Inserts |
1978 |
Closed |
Edinburgh |
d(16.0)Be |
Cyclotron |
8.7 |
0.2 |
Rotational |
Inserts |
1978 |
Closed |
|
Chicago |
|
d(8.0)D |
Cyclotron |
9.8 |
0.15 |
Fixed |
Inserts |
1981 |
Closed |
Orleans |
|
p(34)Be |
Cyclotron |
12.8 |
0.5 |
Fixed |
Inserts |
1981 |
Open |
Cleveland (GLANTA) |
p(42)Be |
Cyclotron |
13.5 |
2.2 |
Fixed |
Inserts |
1982 |
Closed |
|
Houston (MDA) |
p(42)Be |
Cyclotron |
14 |
1.2 |
Rotational |
Inserts |
1983 |
Closed |
|
Riyadh |
|
p(26)Be |
Cyclotron |
10.3 |
0.5 |
Rotational |
Inserts |
1984 |
Closed |
Munster |
|
d(0.25)T |
D–T |
10.5 |
0.3 |
Rotational |
Inserts |
1984 |
Closed |
Univ. of Washington |
p(50)Be |
Cyclotron |
14.8 |
1.2 |
Rotational |
Multileaf |
1984 |
Open |
|
Univ. of Pennsylvania |
d(0.25)T |
D–T |
10.3 |
0.2–0.3 |
Rotational |
Inserts |
1985 |
Closed |
|
Clatterbridge |
p(62)Be |
Cyclotron |
16.2 |
1.4 |
Rotational |
Jaws |
1986 |
Closed |
|
Seoul |
|
p(50)Be |
Cyclotron |
14.8 |
1.2 |
Rotational |
Jaws |
1986 |
Closed |
UCLA |
|
p(46)Be |
Cyclotron |
13.1 |
1.7 |
Rotational |
Jaws |
1986 |
Closed |
Faure S.Africa |
p(66)Be |
Cyclotron |
16.2 |
1.5 |
Rotational |
Jaws/MLC trim |
1988 |
Open |
|
Detroit |
|
d(48.5)Be |
SC Cyclotron |
13.6 |
0.9 |
Rotational |
Multirod |
1991 |
Open |
Beijing |
|
p(35)Be |
Proton Linac |
13.0 |
0.5 |
Fixed |
Inserts |
1991 |
Closed |
Nice |
|
p(65)Be |
Cyclotron |
17.5 |
1.8 |
Fixed |
Multileaf |
1993 |
Closed |
|
|
|
|
|
|
|
|
|
|
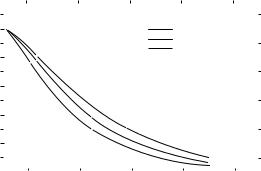
(see the section: Neutron Dose). Measurements are also made along the radiation beam central axis to determine the attenuation of the beam. The parameter Z50 is a measure of the beam penetration as defined by the depth in a water phantom at which the neutron dose is reduced to 50% of its maximum value for a 10 10 cm2 field. The Z50 value varies as a function of the energy and type of particle used in the primary beam. As the incident particle energy increases the mean neutron energy increases and the Z50 increases; this can be seen from the data in Table 4. This 50% depth-dose point also varies with the dimensions of the irradiation field (normally known as the field size). Some form of collimator is required to set the field size, this may be an attenuating block with a predefined rectangular opening, a pair of attenuating jaws, which provide a variable rectangular opening, or a multileaf collimator, which can define rectangular fields or more complex shapes. Generally, square fields are used for beam data measurements and the field size is defined at the center of the treatment volume (isocenter). The Z50 variation with field size arises because the dose at a point depends not only on attenuation of the primary beam in the water phantom, but also on the scattered component of the beam, which is field size dependent. To fully characterize a therapeutic beam it
is, therefore, necessary to measure depth dose curves at a variety of field sizes; Fig. 5 illustrates this phenomenon.
Another beam parameter, which varies with the primary beam particle and energy is the beam build-up. When
|
120 |
|
|
|
|
|
|
|
|
|
|
|
|
|
|
|
|
|
|
|
|
|
|
|
|
|
|
|
|
|
|
|
|
|
|
|
|
|
|
|
|
|
|
|
100 |
|
|
|
|
|
|
|
|
|
|
|
|
|
5 × 5 cm2 |
|
|
|
|||
|
|
|
|
|
|
|
|
|
|
|
|
|
|
|
|
|
|||||
|
|
|
|
|
|
|
|
|
|
|
|
|
|
|
10 × 10 cm2 |
|
|
|
|||
|
80 |
|
|
|
|
|
|
|
|
|
|
|
|
|
20 × 20 cm2 |
|
|
|
|||
dose |
|
|
|
|
|
|
|
|
|
|
|
|
|
|
|
|
|
|
|
|
|
|
|
|
|
|
|
|
|
|
|
|
|
|
|
|
|
|
|
|
|
||
60 |
|
|
|
|
|
|
|
|
|
|
|
|
|
|
|
|
|
|
|
|
|
Depth |
|
|
|
|
|
|
|
|
|
|
|
|
|
|
|
|
|
|
|
|
|
|
|
|
|
|
|
|
|
|
|
|
|
|
|
|
|
|
|
|
|
||
40 |
|
|
|
|
|
|
|
|
|
|
|
|
|
|
|
|
|
|
|
|
|
% |
|
|
|
|
|
|
|
|
|
|
|
|
|
|
|
|
|
|
|
|
|
|
|
|
|
|
|
|
|
|
|
|
|
|
|
|
|
|
|
|
|
||
|
|
|
|
|
|
|
|
|
|
|
|
|
|
|
|
|
|
|
|
|
|
|
20 |
|
|
|
|
|
|
|
|
|
|
|
|
|
|
|
|
|
|
|
|
|
|
|
|
|
|
|
|
|
|
|
|
|
|
|
|
|
|
|
|
|
|
|
|
|
|
|
|
|
|
|
|
|
|
|
|
|
|
|
|
|
|
|
|
|
0 |
10 |
20 |
30 |
40 |
50 |
|||||||||||||||
|
|
|
|
|
|
|
Depth (cm) |
|
|
|
|
|
|
|
|||||||
Figure 5. Depth-dose curves for d(48.5)Be neutron beam plotted as a function of field size. Reproduced with permission from Maughan and Yudelev, Med. Phys. 1995;22:1462.
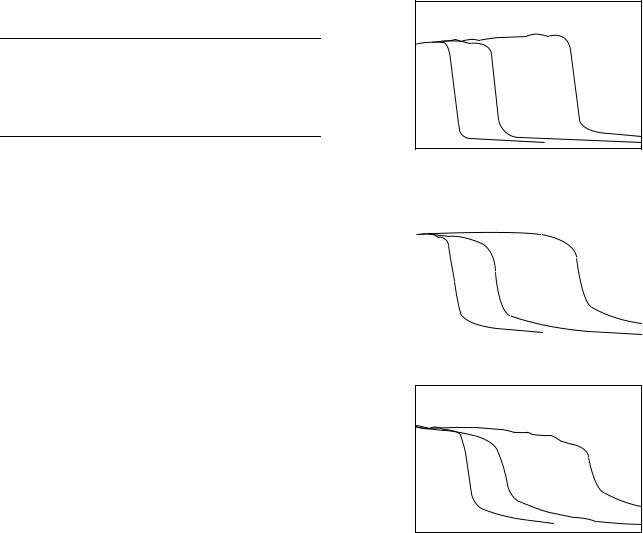
Table 5. The Variation of surface dose and dmax as function of the neutron producing nuclear reaction and the energy of the incident particlea
Neutron |
Incident |
Surface Dose |
|
Producing |
Particle |
as a % of the |
|
Reaction |
Energy, MeV |
Dose at dmax |
dmax, cm |
|
|
|
|
d þ Be |
48.5 |
42 |
0.9 |
p þ Be |
50 |
38 |
1.2 |
p þ Be |
66 |
40 |
1.6 |
aData taken from Ref. (21) and (25).
an indirectly ionizing radiation beam (neutrons or X rays) passes from air into a solid water medium, the secondary particle fluence in the surface layers is much less than at depth, because in the shallower layers the secondary particles are those that originated in the air and passed into the solid. Since air is much less dense than the solid, there are relatively few secondary particles in the surface layer. As the neutron beam penetrates the solid medium, more and more secondary particles are set in motion in the solid medium, until an equilibrium situation is reached at a depth that is about equal to the average range of the secondary particles in the solid. The energy deposition (dose) reaches a maximum at this depth (known as the depth of maximum dose, dmax) and is attenuated beyond this point as shown in Fig. 5. This build-up region of the curve cannot be measured using the instrumentation used to measure the attenuation data in Fig. 5. A specialized thin pill box shaped ionization chamber (known as an extrapolation ionization chamber) is required for these measurements. The build-up region has considerable clinical significance, when treating tumors at depths >dmax, since the dose in the surface layers of the skin is reduced relative to the tumor dose and, hence, the skin can be spared from excessive radiation damage. Table 5 shows how the surface dose (dose at zero depth), expressed as a
percentage of the dose at dmax, and dmax vary as a function of the neutron producing nuclear reaction and the incident
particle energy.
Beam profiles are also measured in the water phantom by scanning the ionization chamber in a direction perpendicular to the radiation beam central axis. A typical beam profile is shown in Fig. 6. As can be seen from this figure, the exact shape of the profiles depends on the depth in the phantom and the radiation field size. The most important feature of the profiles is the sharpness of the beam edges; This parameter degrades with both increase in field size and depth due to increased scattering of the neutrons. The exact sharpness of this penumbra region depends on many factors including, the source size, scattering from the collimator system and beam monitoring components in the beam path, the collimator geometry (i.e., whether the edges of the collimator jaws or leafs are divergent), and finally on neutron scattering in the patient (or phantom). Generally, phantom scatter is the predominating factor.
Depth-dose and profile date are inputted to the computer programs used for calculating the dose distribution in patients. These programs use a variety of different mathematical algorithms to calculate the dose distributions in the patient.
NEUTRON BEAM THERAPY |
57 |
140 |
(a) 1.2 cm depth |
|
|
|
|
|
|
120 |
|
|
|
|
|
||
|
|
|
|
|
|
|
|
100 |
|
|
|
|
|
|
|
80 |
|
|
|
|
|
|
|
60 |
|
|
|
|
|
|
|
40 |
|
|
|
|
|
|
|
20 |
|
|
|
|
|
|
|
0 |
2 |
4 |
6 |
8 |
10 |
12 |
14 |
|
140 |
|
|
|
|
|
|
|
|
|
|
|
(b) 10 cm depth |
|
|
|
|
|
|
||
|
120 |
|
|
|
|
|
|
|
||
|
|
|
|
|
|
|
|
|
|
|
dose |
100 |
|
|
|
|
|
|
|
|
|
80 |
|
|
|
|
|
|
|
|
|
|
% |
|
|
|
|
|
|
|
|
|
|
20 |
|
|
|
|
|
|
|
|
|
|
Normalized |
|
|
|
|
|
|
|
|
|
|
|
60 |
|
|
|
|
|
|
|
|
|
|
40 |
|
|
|
|
|
|
|
|
|
|
|
|
|
|
|
|
|
|
|
|
|
0 |
2 |
4 |
6 |
8 |
10 |
12 |
14 |
||
140
(c) 20 cm depth
120
100
80
60
40
20
0 |
2 |
4 |
6 |
8 |
10 |
12 |
14 |
|
|
Distance from central axis (cm) |
|
|
|||
Figure 6. Beam profiles for field sizes of 5 5 cm2 (solid line), 10 10 cm2 (dotted line), and 25 25 cm2 (dashed line) at depths of (a) 1.2, (b) 10, and (c) 20 cm in a water phantom. Reproduced with permission from Maughan and Yudelev, Med. Phys. 1995; 22: 1461.
NEUTRON PRODUCTION
Fast Neutron Therapy Beams
Over the past 65 years, there have been at least 34 centers that have been involved in fast neutron radiation therapy. Table 4 lists these centers and indicates which nuclear reaction has been used to produce the neutron beam. In column 2, the lower case letter indicates the accelerated particle, the number in parenthesis is the energy in megaelectronvolts of this projectile and the final letter(s) represents the target nucleus. Of the facilities, 12 have used the deuteron stripping reaction with a beryllium target, 14 the proton inelastic scattering reaction on a beryllium target, 7 the deuteron–tritium fusion reaction and only 1, the deuteron–deuterium fusion reaction. The relative
58 NEUTRON BEAM THERAPY
merits of these various modes of neutron production will be discussed.
The d-Be Reaction
In practice, the deuteron stripping reaction on beryllium is the most prolific neutron producing reaction since a solid beryllium target capable of stopping the full energy of the beam can easily be constructed. There are basic physical reasons for the deuteron stripping reaction on beryllium being more prolific in producing neutrons than the inelastic scattering of protons from a beryllium target. The deuteron is a loosely bound structure of a neutron and a proton in which the two particles spend most of their time at greater distances from each other than the range of the forces between them. Hence, when an energetic deuteron approaches a beryllium target nucleus it is possible for the proton to be absorbed into the target nucleus, breaking free from the neutron that carries on following its original path at its original velocity (i.e., with half the kinetic energy of the original deuteron). The excited 10B nucleus formed may also decay by neutron emission. When a proton beam interacts with a beryllium target the proton is absorbed into the target nucleus to form a compound nucleus, 10B, in an excited state, which may decay by emitting a neutron. Hence, the stripping reaction is a much more prolific source of neutrons, since many neutrons originate from the breakup of the deuteron. In addition, the stripping reaction is very forward-peaked in the laboratory, while the (p,n) reaction on beryllium produces a more isotopic distribution, since it involves the formation of a compound nucleus. The theoretical aspects of the production of intense neutron beams using the deuteron stripping reaction with beryllium targets has been discussed by August et al. (26). Experimental neutron yield data and spectral data on the characteristics of neutrons from beryllium targets bombarded with protons and deuterons with energies of 16, 33, and 50 MeV are available in the work of Meulders et al. (27). The above experiments measure the total neutron fluence at 08 or the differential fluence as a function of neutron energy at various angles relative to the forward direction. In order to estimate the usefulness of a given reaction as a neutron source for radiation therapy, it is necessary to know the neutron dose rate produced in practice by a given attainable beam current. Such information can be calculated from neutron spectrum data using neutron kerma factors for water or body tissue (22).
Another vitally important parameter is the penetration of the neutron beam in tissue. Although in principle it is possible to calculate this information from the spectral and kerma data, in practice there are insufficient data and the calculations are difficult. Therefore, ionization chamber measurements are often more convenient for measuring both the dose rate and penetration of neutron beams. There is extensive data on neutron dose rates and depth dose characteristics of neutron beams across a wide range of energies for the deuteron stripping reaction on beryllium. Smathers et al. (28) reviewed the available dose rate data in the incident deuteron energy range of 11–50 MeV and concluded that the tissue kerma measured free-in-air at a target-to-detector distance of 1.25 m and for a 5 5 cm2
field size could be fitted by an equation of the form
1n K ¼ 1n a þ b ln E |
ð1Þ |
In this equation, E is the energy of the incident beam in million electronvolts, K is the tissue kerma in units of cGy min 1 mA 1 and a and b are constants with numerical values of 1.356 10 4 and 2.97, respectively.
Later, Wootton (29) reviewing ionization chamber dose rate data for the d-Be reaction quoted the following expression for the dose rate at 1.25 m
D |
|
Q 1 |
¼ |
2:49 |
|
10 2 E2:95 |
2 |
Þ |
|
|
|
d |
ð |
where D Q 1 (in Gy/C) is the absorbed dose to tissue free- in-air at a 1.25 m target to detector distance per unit charge of deuteron beam, and Ed is the incident deuteron energy in million electronvolts. If Eq. 1 is rewritten in this form and normalized to the same units it becomes
D |
|
Q 1 |
¼ |
2:26 |
|
10 2 E2:95 |
3 |
Þ |
|
|
|
d |
ð |
At Ed ¼ 50 and 10 MeV, these equations agree to within 2 and 5%, respectively. Of course, such equations can only be used to give a rough estimate of the neutron dose output of a neutron therapy device, since the exact output depends on the details of the target, flattening filter, collimator, and dose monitor design.
The spectral data of Lone et al. (30) gives information on the fluence averaged energy of the neutron beam (En), they derived the following expression:
En ¼ 0:4 Ed 0:3 |
ð4Þ |
relating the mean neutron energy to the incident deuteron energy (Ed) in million electronvolts.
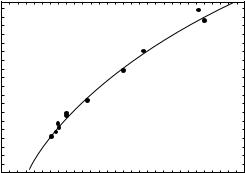
Data on the penetration of neutron beams, produced by the d-Be reaction, have been published by Shaw and Kacperek (31). In Fig. 7, the values of Z50 from Table 4 for the d-Be reaction is plotted as a function of incident deuteron energy. A power law fit to the curve yields the
|
14 |
|
12 |
(cm) |
10 |
50 |
|
Z |
|
|
8 |
|
6 |
0 |
10 |
20 |
30 |
40 |
50 |
60 |
|
|
|
Ed (MeV) |
|
|
|
Figure 7. The neutron beam 50% depth-dose value (Z50) for neutrons produced by the d-Be reaction plotted as a function of the incident deuteron energy (Ed). The solid line is a power law fit to the data (Eq. 5). The data are for a 10 10 cm2 field at a range of source-surface distances (SSD) between 91 and 183 cm.
following equation
Z50 ¼ 2:90 Ed0:39 |
ð5Þ |
The exact value of Z50 depends on the target structure and the beam filtering effects of the flattening filter and the dose monitor devices.
The clinical relevance of microdosimetric data in neutron therapy planning has been discussed by Pihet et al. (32). The microdosimetric dose distribution shown in Fig. 4 can be analyzed in several ways, the most useful single parameter, which can be used to describe the distribution is the dose mean lineal energy corrected for saturation
ð
y1 ¼ ysat d1ðyÞ dy |
ð6Þ |
This parameter was defined in the dual radiation action theory of Kellerer and Rossi (33). The function ysat is a response function that accounts for the saturation effect that is observed in mammalian cell systems (34); as the LET of the beam is increased the observed RBE decreases due to the overkill effect (35). In Fig. 8, the y1 values for a variety of different therapy beams are plotted as a function of the mean neutron energy, as defined in Eqs. (4) and (8). The closed circles represent the data for the d-Be reaction.
The p-Be Reaction
From Table 4, it can be seen that most of the early neutron therapy centers (i.e., those operating at lower energies) utilized the deuteron stripping reaction or the fusion reaction as the source of neutrons (see Section: The d-T Reaction). Interest in the p-Be reaction increased when the importance of constructing neutron sources with rotational isocentric capability (i.e., capable of rotating around the patient with the tumor center on the axis of rotation) and with penetration equivalent to 4 MV photon beams was realized (Table 2). Good penetrability requires deuteron or proton beams with energies of 40–50 MeV or greater, and isocentricity requires bending magnet systems capable of
|
34 |
|
|
|
|
|
|
|
|
|
|
|
|
|
d-Be reaction |
|
|
||
|
|
|
|
|
|
|
|
||
|
32 |
|
|
|
|
p-Be reaction |
|
|
|
|
|
|
|
|
|
d-T reaction |
|
|
|
m |
30 |
|
|
|
|
|
|
|
|
|
|
|
|
|
|
|
|
|
|
ikeV/in* |
28 |
|
|
|
|
|
|
|
|
|
|
|
|
|
|
|
|
|
|
y |
26 |
|
|
|
|
|
|
|
|
|
24 |
|
|
|
|
|
|
|
|
|
22 |
|
|
|
|
|
|
|
|
|
0 |
5 |
10 |
15 |
20 |
25 |
30 |
||
En (MeV)
Figure 8. The microdosimetric parameter mean lineal energy corrected for saturation (y1 ) plotted as a function of the mean energy of the neutron beam for various neutron producing reactions: d-Be, open circles (En from Eq. 4); p-Be, open circles (En form Eq. 8), and d-T reaction, open triangle (En ¼ 14.1 MeV).
NEUTRON BEAM THERAPY |
59 |
bending these beams 1808 (a 458 bend followed by a 1358 bend). Conventional cyclotrons capable of producing 50 MeV deuterons were too large and expensive as were the magnet systems for bending these beams. Proton cyclotrons of 50 or 60 MeV offered a much less expensive alternative in the late 1970s, when the decision to install a new generation of hospital-based neutron therapy facilities was being made by the NCI in the United States. The problems of switching from the deuteron stripping to the p-Be reaction were soon recognized: the energy spectrum from the reaction of protons on a beryllium target has a significant low-energy tail, which reduces the average neutron beam energy and spoils the penetration. Also the neutron output is much less, therefore, higher beam currents are required with an increase in the problems associated with target cooling and target activation. The penetration problem can be overcome by using nonstopping targets (i.e., beryllium targets in which the incident proton beam does not lose all its energy) in conjunction with polyethylene filters, which filter out the low energy component of the beam. These techniques have been discussed in detail for proton beams with energies between 30 and 60 MeV by Bewley et al. (36) and for a 41 MeV proton beam by Smathers et al. (37). The absorbed dose rate (D Q 1) to tissue at 1.25 m from the target is given by Wootton (29) as
D |
|
Q 1 |
¼ |
2:44 |
|
10 2 E2:37 |
7 |
Þ |
|
|
|
p |
ð |
where D Q 1 is in units of Gy/C and Ep is the incident proton energy in million electronvolts.
For the p þ Be reaction with a stopping target, the average neutron energy for neutrons with energies >2 MeV (En) measured at 08 to the incident beam is given by
En ¼ 0:47 Ep 2:2 |
ð8Þ |
where Ep is the incident proton energy (29).
In Fig. 9, the value of Z50 from Table 4 for the p-Be reaction is plotted as a function of incident proton energy, the solid curve is a power law fit to the data that gives the
|
18 |
|
|
|
|
|
|
|
|
|
|
|
|
|
|
|
|
|
16 |
|
|
|
|
|
|
|
cmin |
14 |
|
|
|
|
|
|
|
|
|
|
|
|
|
|
|
|
50 |
12 |
|
|
|
|
|
|
|
Z |
|
|
|
|
|
|
|
|
|
10 |
|
|
|
|
|
|
|
|
8 |
|
|
|
|
|
|
|
|
|
30 |
40 |
50 |
60 |
70 |
||
|
20 |
|||||||
Ep in MeV
Figure 9. The neutron beam 50% depth-dose value (Z50) for neutrons produced by the p-Be reaction plotted as a function of the incident proton energy (Ep). The solid line is a power law fit to the data (Eq. 9). The data are for a 10 10 cm2 field for range of SSD between 125 and 190 cm.
60 NEUTRON BEAM THERAPY
following equation:
Z50 ¼ 2:06 E0p:50 ð9Þ
The greater spread in the data points, when compared with the similar data plotted in Fig. 7, is a result of the greater variety in the target design (i.e., target thickness and filtration conditions) used at the different facilities.
The microdosimetric data for the p-Be reaction is represented by the open circular data points in Fig. 8. The dose mean lineal energy corrected for saturation correlates with the mean neutron energy for both the p-Be and the d-Be produced neutron beams.
The d-D Reaction
This reaction was used in the neutron radiation therapy facility at the University of Chicago, where a deuteron beam of energy 8.3 MeV was incident on a thick cryogenic deuterium gas target designed by Kuchnir et al. (38). Two reactions predominate when a deuterium target is bombarded with deuterons:
d þ D ¼ 3He þ n |
Q ¼ þ3:27 MeV |
and, |
|
d þ D ¼ d þ n þ p |
Q ¼ 2:22 MeV |
Hence, there are two distinct groups of neutrons produced, the higher energy group resulting from the first of these two reactions. The neutron energy spectrum for bombardment of a thick stopping target exhibits two maxima corresponding to the two groups. The relative magnitude of the two peaks depends on the incident deuteron energy. At an incident deuteron energy of 6.8 MeV the higher energy peak due to the D(d,n)3He reaction predominates, but for an incident energy of 11.1 MeV, the two peaks are comparable (39). Waterman et al. (39) calculated the neutron spectra at 6.8, 8.9, and 11.1 MeV from a knowledge of the mass stopping power of deuterons in deuterium and from the cross-sections of the two reactions as given by Schraube et al. (40).
The dosimetric properties of the d–D neutron beam are summarized in the work of Kuchnir et al. (38). Figure 10 shows the variation in absorbed tissue dose rate (Gy/mC) as a function of the incident deuteron energy for a thick deuterium gas target. The measurements were made at a SSD of 126 cm with a 11.1 11.1 cm2 field size. The data can be fitted by a power law expression.
D |
|
Q 1 |
¼ |
2:41 |
|
10 2 E3:28 |
ð |
10 |
Þ |
|
|
|
d |
|
where D Q 1 (Gy/C) is the absorbed dose to tissue measured free-in-air per coulomb (C) of incident beam current, and Ed is the incident deuteron beam energy. Measurements have been made by Weaver et al. (41) at an incident deuteron energy of 21 MeV, but with a transmission gas target. For a target filled to a pressure of 3.33 MPa (33 atm), equivalent to an energy loss of 3.5 MeV, the measured dose was 2.25 10 4 Gy/mC for a 10 10-cm field at 1.25 m SSD.
In practice, the University of Chicago neutron therapy facility produced a maximum dose rate of 0.12 Gy/min at an
|
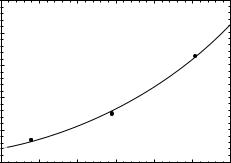
1.0 |
|
max |
0.8 |
|
at D |
|
|
tissuedose (Gy/ c) |
0.6 |
|
0.4 |
||
|
||
Total |
0.2 |
|
|
||
|
0.0 |
6 |
7 |
8 |
9 |
10 |
11 |
12 |
Deuteron energy (MeV)
Figure 10. Absorbed dose at the depth of maximum dose as a function of incident deuteron energy for the d–D reaction. The data are from Kuchnir et al.(38). The solid curve is a power law fit to the data (Eq. 10). Measurements were made in a 11.1 11.1 cm2 field at an SSD of 126 cm.
SSD of 91 cm, for a 10 10 cm field size. The penetration of the University of Chicago d–D beams in terms Z50 is 9.8 cm (Table 4). An interesting feature of the d–D reaction is that as the incident deuteron energy is increased the mean neutron energy produced remains practically constant. This finding is evident in the depth-dose data of Kuchnir et al. (38), where changing the incident deuteron energy has no significant effect on the value of Z50. Even at 21 MeV with a transmission target the Z50 remains constant at 10 cm. Thus, the inherent poor penetration of neutron beams produced by the d–D reaction, combined with the difficulties of producing a cryogenic deuterium gas target discouraged the use of this reaction as a neutron source for radiation therapy.
The d–T Reaction
For many years, this reaction was seen as the ideal reaction for producing a relatively inexpensive source of neutrons for radiation therapy. The large positive Q-value for the reaction
d þ 3H ! 4He þ n Q þ 16:6 MeV
results in monoenergetic neutrons of energy 14 MeV. In principle, a relatively modest deuteron energy of 250– 500 keV should be sufficient to produce an intense source of 14-MeV neutrons if sufficient beam current can be obtained. The original intention was to produce the source and target assembly in the form of a sealed tube, which could be easily replaced in the treatment head and would have a lifetime of 1000 h or more. Such a unit would have been similar in this respect to the 250-kVp X-ray units that were in widespread use before the advent of 60Co units and high-energy electron linacs in conventional photon radiation therapy. Initially, the main problem with these devices was that associated with producing a target in the sealed tube configuration that would provide sufficient neutron dose rate. However, many different systems were used in attempts to produce a practical d–T generator and these have been reviewed in detail in ICRU Report No. 45 (21).
Of the five types of commercially available d–T generators, which were used in clinical trials to treat significant numbers of patients, four were of a type that employed some form of sealed tube in which a mixed deuterium– tritium beam was accelerated to an energy of 200–250 keV and used to bombard a tritiated rare earth target (titanium, erbium, or scandium). The characteristics of these four machines are given in Table 4. The Haefely device produced the highest dose rate with the longest average tube life of 300 h and was installed in Heidelberg and Mu¨ nster. The operation of the Philips and Elliot tubes are described by Broerse et al. (42). A Philips machine was installed in Amsterdam and the Elliot devices were used in Glasgow and Manchester. An account of the construction of the Haefely machine is given by Schmidt and Rheinhold (43) while a detailed appraisal of its clinical operation can be found in the work of Ho¨ver et al. (44). The University of Pennsylvania D–T generator was built by the Cyclotron Corporation (Berkeley, CA).
The fifth commercial unit, installed in Hamburg, was produced as a collaboration between AEG in Germany and Radiation Dynamics Inc. (RCI) in the United States. The machine used a pure deuterium beam accelerated to 500keV incident on a replaceable rotating tritiated titanium target (45). The source and target design were improved by incorporating an analyzed deuterium beam (to remove molecular D2þ beam components) and a larger target (46). With these improvements a dose rate of 0.12–0.13 Gy/min was achieved.
PRACTICAL FAST NEUTRON THERAPY FACILITIES
In fast neutron radiation therapy the need for state-of-the- art neutron facilities, which allow neutron treatments to be delivered with precision and sophistication equivalent to that used in modern conventional X-ray therapy, is well recognized. Modern trends in X-ray therapy are toward conformal therapy with multiple static fields, multileaf collimators, three-dimensional (3D) treatment planning and most recently (IMRT). All these tools must be available for neutron radiation therapy if effective randomized phase III clinical trials are to be completed to compare the two modalities.
An important aspect of this problem is beam penetration. The problem with neutron beams is that it is not possible to increase the mean energy of the neutrons to a point at which the neutron beams have percentage depthdose characteristics that are equivalent to modern high energy (15–25 MV) photon beams, since as the neutron beam energy increases, the average LET of the beam decreases. If the average LET is decreased too far, the radiobiological advantage of the neutron beam will be significantly diluted (e.g., RBE tends to decrease and neutron beam advantages associated with hypoxia decrease, the radiosensitivity variation within the cell cycle tends to that of low LET radiations). Hence, there is a trade-off between beam penetration and LET effect. This trade-off can be seen in Fig. 8, which illustrates how the effective LET (y1 ) of the neutron beam decreases as the mean neutron energy (En) increases.
NEUTRON BEAM THERAPY |
61 |
The requirement that neutron beams should be at least equivalent to 4 MV photon beams (Table 2) arises in part from this trade-off. Of the 34 facilities listed in this Table 4, only 10 satisfied this penetration requirement. Of the 6 operational facilities 4 satisfy the requirement and the most penetrating beams at the Ithemba Laboratory in South Africa and Fermi Laboratory in the United States, produced by the p(66)Be reaction, are equivalent to an 8- MV photon beam. If all the requirements of Table 1 are considered and in addition a multileaf or multirod collimator for producing irregularly shaped fields is made mandatory, then only three of the operational facilities meet all the requirements. These are at the University of Washington in Seattle, the Ithemba Laboratorty in South Africa and at Harper Hospital, Wayne State University in Detroit. The fact that the neutron beams are less penetrating than the 15–25 MV photon beams that are commonly used for treating deep-seated tumors may not be a problem. In a treatment planning comparison of 3D conformal neutron and photon radiotherapy for locally advanced adenocarcinoma of the prostate, Forman et al. (47) showed that the dose–volume histograms for gross tumor, rectal, and bladder volumes treated with neutrons and photon beams are not significantly different. Wootton (29) suggested that neutron beams with a Z50 of >15 cm are required, and that for the d–Be reaction to be useful in this case, an incident deuteron energy of 61 MeV would be required. Forman’s data, however, indicate that a Z50 of 13.6 cm is adequate for producing acceptable dose distributions for the treatment of pelvic tumors.
In the late 1970s, economic considerations led to the choice of the p–Be reaction as the neutron source for a new generation of hospital-based high-energy proton cyclotrons for clinical trials in the United States, because deuteron producing conventional cyclotrons and the associated bending magnet system required to produce rotational beams were too costly. These machines were installed at the MD Anderson (MDA) Hospital in Houston, at the University of California Los Angeles, and at the University of Washington in Seattle (Table 4). Since this time the development of a compact superconducting deuteron cyclotron for neutron radiation therapy by Henry Blosser and his associates at the National Superconducting Cyclotron Laboratory at Michigan State University has had a significant impact on the technology of neutron therapy. This superconducting facility (25,48) has many innovative features. The accelerator weighs 25 Mg (25 tons), 10 times less than a conventional 50 MeV deuteron cyclotron. The unit has an internal beryllium target and is mounted between two large rings (4.3 m outer diameter) in order to provide for 3608 rotation around the treatment couch. A 25 Mg counterweight mounted on the rings acts as a primary beam stop, which reduces the required thickness of the shielding walls. The total rotating mass is 60 Mg (60 tons). Figure 11 is a schematic of the cyclotron and gantry. Figure 12 shows a section through the median plane of the cyclotron indicating its’ main components. The unit does not require a separate bending magnet system to produce an isocentric beam and it can be installed in a single shielded room. With no beam extraction or elaborate bending magnet system, the operation is
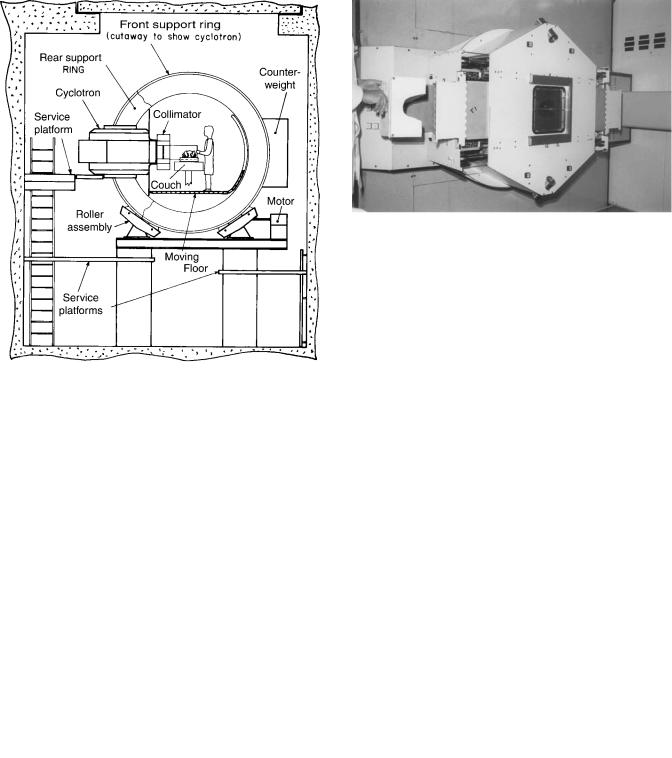
62 NEUTRON BEAM THERAPY
Figure 11. A schematic of the superconducting cyclotron mounted on the rotating gantry at the Wayne State University Facility. Reproduced with permission from Maughan et al., Med. Phys. 1994;21:781.
Figure 12. Schematic section through the median plane of the superconducting cyclotron, showing the following features Y ¼ magnet yoke, MC ¼ magnet superconducting coil, PT ¼ magnet hill pole tip, IW ¼ cryostat inner wall, OW ¼ cryostat outer wall, CL ¼ magnet coil electrical leads, CS ¼ cryogen supply and gas return lines, D ¼ radio frequency system dees, BT ¼ internal beryllium target, VL ¼ target vacuum lock, VW ¼ beam chamber vacuum window, and C ¼ neutron beam collimator. Reproduced with permission from Maughan et al., Med. Phys. 1994;21:780.
Figure 13. A photograph of the multirod collimator. One-half of the polystyrene foam form used to push the rod array into the desired shape is visible on the left. Reproduced with permission from Maughan et al., Med. Phys. 1994;21:781.
considerably simplified. The unit also incorporates a unique multirod collimator for producing irregularly shaped fields (49), which conform accurately to the tumor volume (Fig. 13). This facility has been in routine clinical use since March of 1992, and up to the end of 2002, 1800 patients have been treated. Close to 10,000 individual treatment fields have been routinely treated in a single year making this the busiest and most efficient neutron therapy facility in the world.
DISCUSSION AND CONCLUSIONS
Neutron therapy has been demonstrated to be superior to conventional therapy in the treatment of salivary gland tumors, some tumors of the paranasal sinuses and other head and neck sites, soft tissue sarcomas, chondrosarcomas, osteosarcomas, advanced adenocarcinoma of the prostate, and inoperable and recurrent melanoma (17). For a range of other sites, further investigation is necessary to establish the efficacy of neutron therapy; these sites include pancreas, bladder, rectum, esophagus, uterine cervix, and brain.
However, in spite of these successes, neutron therapy appears to be in decline with only six centers actively treating patients (three in the United States and one each in Germany, France, and South Africa). The emphasis on precision radiation therapy has resulted in the development of intensity modulated radiation therapy techniques in conventional X ray therapy. These techniques allow for highly conformal dose delivery, maximizing the dose to the tumor volume and minimizing the dose to the surrounding normal tissues. There is also a considerable increase in the number of proton beam therapy centers, using the unique energy deposition patterns associated with proton beams to achieve even greater conformality than is achievable with IMRT.
In Europe and Asia, there is interest in developing 12C ion beams for radiation therapy. These developments are spurred by the superior results achieved with neutron therapy in the cases outlined above. Heavy ion beams,
such as 12C beams, are high LET beams, which combine the biological advantages of neutrons with the dose distribution advantages of protons. Such beams are extremely expensive to produce. The application of intensity modulated radiation therapy techniques in neutron therapy (IMNT) could improve the conformality of neutron therapy. Compact superconducting cyclotrons with computer controlled multileaf collimators, which allow IMNT to be deliv-
ered, could be an attractive and less expensive alternative to 12C therapy.
The superconducting technology could be applied to designing a compact 60–70 MeV gantry mounted proton cyclotron to provide a beam with better depth dose characteristics than the existing Wayne State University cyclotron. The possibility of building a compact conventional 50 MeV proton cyclotron in a similar configuration to the superconducting deuteron cyclotron has been suggested (Jongen, unpublished data). A computer controlled MLC is at present under construction at Wayne State University with the intention of using it to implement IMNT (50). Such advances in neutron therapy technology are important if it is to achieve its full potential and remain competitive with the other radiation therapy modalities (i.e., conventional X rays and electrons, protons, and heavy ions).
In the >80 years since its discovery in Cambridge by James Chadwick, the neutron has found an important place in radiation therapy research, and much has been done to improve the means of neutron production and delivery.
BIBLIOGRAPHY
1.Chadwick J. The existence of a neutron. Proc R Soc London, Ser A 1932;136:629–708.
2.Cockroft JD, Walton ETS. Experiments with high velocity positive ions. I.-The disintegration of elements by high velocity protons. Proc R Soc London, Ser A 1932;137:229–242.
3.Gray LH, Read J, Wyatt JG. A neutron generator for biological research. Br J Radiol 1940;147:82–94.
4.Stone RS. Neutron therapy and specific ionizations. Am J Roentgenol 1948;59:771–779.
5.McNally NJ, Maughan RL, de Ronde J, Roper MJ. Measurements of some radiobiological and physical properties of neutrons produced by a 4-MV Van de Graaff accelerator. Rad Res 1982;89:227–237.
6.Sheline GE, Phillips TL, Field SB, Brennan JT, Raventos A. Effects of fast neutrons on human skin. Am J Roentgenol 1971;111:31–41.
7.Thomlinson RH, Gray LH. The histological structure of some human lung cancers and possible implications for radiotherapy. Br J Cancer 1955: 9:539–549.
8.Howard A, Pelc SR. Synthesis of deoxyribonucleic acid in normal and irradiated cells and its relation to chromosome breakage. Heredity 1953;6 (suppl): 261–273.
9.Sinclair WK, Morton RA. X-ray sensitivity during the cell generation cycle of cultured Chinese hamster cells. Rad Res 1966;29:450–474.
10.Withers HR, Mason K, Reid BO. Response of mouse intestine to neutrons and gamma rays on relation to dose fractionation and division cycle. Cancer 1974;34:39–47.
11.Battermann JJ, Breur K, Hart GAM, VanPeperzeal HA. Observations on pulmonary metastases in patients after single doses and multiple fractions of fast neutrons and cobalt-60 gamma rays. Eur J Cancer 1981;17:539–548.
NEUTRON BEAM THERAPY |
63 |
12.Griffin TW, Pajak TF, Laramore GE, Duncan W, Richter MP, Hendrickson FR. Neutron vs photon irradiation of inoperable salivary gland tumors: results of an RTOG-MRC cooperative study. Int J Rad Oncol Biol Phys 1988;15:1085–1090.
13.Russell KJ, Caplan RJ, Laramore GE, Burnison CM, Maor MH, Taylor ME, Zink S, Davis LW, Griffin TW. Photon versus fast neutron external beam radiotherapy in the treatment of locally advanced prostate cancer: results of a randomized trial. Int J Radiat Oncol Biol Phys 1994;28:47–54.
14.Laramore GE, Krall JM, Thomas FJ, Russell KJ, Maor MH, Hendrickson FR, Martz KL, Griffin TW. Fast neutron radiotherapy for locally advanced prostate cancer: final report of an RTOG randomized clinical trial. Am J Clin Oncol 1993;16: 164–167.
15.Forman JD, Yudelev M, Bolton S, Tekyi-Mensch S, Maughan
R.Fast neutron irradiation for prostate cancer. Cancer Metastasis Rev 2002;12:131–135.
16.Wambersie A, Auberger T, Gahbauer RA, Jones DTL, Potter R.
Achallenge for high-precision radiation therapy: the case for hadrons. Strahlenther Onkolog 1999;175 (Suppl II): 122–128.
17.IAEA Report TECDOC-992, Nuclear data for neutron therapy: Status and future needs, Vienna: International Atomic Energy Agency, 1997.
18.National Cancer Institute Request for Proposal NCI-CM- 97282. Clinical Neutron Therapy Program 1979.
19.Knoll GF. Radiation Detection and Measurement. 2nd ed. New York: Wiley; 1989.
20.Cross WG, Ing H. Neutron spectroscopy. In: Kase KR, Bja¨rngard BE, Attix FH, editors. The Dosimetry of Ionizing Radiation. Volume 2, Orlando: Academic Press; 1987. pp. 91–167.
21.ICRU Report No. 45, Clinical neutron dosimetry part I: determination of absorbed dose in a patient treated with external beams of fast neutrons, Bethesda, International Commission on Radiation Units and Measurements, 1989.
22.ICRU Report No. 46, Photon, electron, proton and neutron interaction data for body tissues, Bethesda, International Commission on Radiation Units and Measurements, 1992.
23.Rossi HH, Rosensweig W. A device for the measurement of dose as a function of specific ionization. Radiology 1955;64: 404–441.
24.ICRU Report No. 36, Microdosimetry. Bethesda, International Commission on Radiation Units and Measurements, 1983.
25.Maughan RL, Yudelev M. Physical characteristics of a clinical d(48.5) þ Be neutron therapy beam produced by a superconducting cyclotron. Med Phys 1995;22:1459–1465.
26.August LS, Theus RB, Shapiro R. Stripping theory analysis of thick target neutron production for D þ Be. Phys Med Biol 1976;21:931–940.
27.Meulders J-P, Leleux P, Macq PC, Pirart C. Fast neutron yields and spectra from targets of varying atomic numbers bombarded with deuterons from 16 to 50 MeV. Phys Med Biol 1975;20:235–243.
28.Smathers JB, Otte VA, Smith AR, Almond PR. Fast neutron dose rate vs. energy for the d-Be reaction—a reanalysis. Med Phys 1976;3:45–47.
29.Wootton P. Neutron therapy facilities and their specification. Radiat Protection Dosim 1988;23:349–355.
30.Lone MA, Ferguson AJ, Robertson BC. Characteristics of neutrons from Be targets bombarded with protons, deuterons and alpha particles. Nucl Instrum Methods 1981;189:515–525.
31.Shaw JE, Kacperek A. Fast neutron beams, in Central Axis Depth Dose Data for Use in Radiotherapy: 1996. Br J Radiol 1996; (Suppl 17): 97–104.
32.Pihet P, Gueulette J, Menzel HG, Grillmaier RE, Wambersie
A.Use of microdosimetric data of clinical relevance in neutron therapy planning. Radiat Protection Dosim 1988;23:471–474.
33.Kellerer AM, Rossi HH. The theory of dual radiation action. Curr Top Radiat Res Q 1972;8:85–158.