

Neutron Scattering in Biology - Fitter Gutberlet and Katsaras
.pdf13
Protein Adsorption and Interactions
at Interfaces
J.R. Lu
13.1 Introduction
Protein adsorption at interfaces is a complicated molecular process occurring in many technological applications [1, 2]. The need to manipulate protein adsorption mainly comes from two strands of interest. There is a range of technological processes where protein adsorption is undesired. In bioseparation and purification, for example, protein deposition can block membrane pores, leading to the fast decline of permeate flux and the halt of the separation process. Protein adsorption is also a major source for cross-contamination of protein related diseases (e.g. prions) through reusable medical devices. Thus removal of surface-deposited blood proteins on reusable medical devices is a major challenge requiring extensive knowledge of the interfacial interaction between surface-bound blood protein and surfactant. In contrast to the undesired protein deposition, protein adsorption is strongly encouraged in many biomedical and biotechnological applications. Examples include biosensors such as the fertility test system working on the principle of surface immobilization of bioactive proteins and their specific recognition of hCG, a hormonal protein. In these cases, however, it is the specific protein recognition that is desired. Furthermore, the performance of the biosensors strongly hinges on the structural conformations of surface immobilized proteins. Protein interaction with biomaterials also implicates the success of the integration of cardiovascular implants and the progress of tissue engineering [3, 4].
A number of physical techniques have been developed to reveal di erent aspects of information from adsorbed protein layers, concerning the adsorbed amount and structural conformations [5–8]. These include X-ray reflection, surface plasmon resonance spectroscopy (SPR), spectroscopic ellipsometry (SE), FTIR-ATR, and the more recently developed infrared-visible sum frequency generation (SFG) vibration spectroscopy [9]. Techniques such as small angle neutron scattering (SANS), circular dichorism (CD), and NMR are very appropriate for revealing useful information about proteins adsorbed on particulate surfaces [10–14]. The combined use of these techniques has provided
266 |
J.R. Lu |
a rich list of information about the vast amount of details relating to adsorbed protein layers. There are, however, some common drawbacks of existing techniques. For example, they are largely insensitive to a single protein layer and ine ective for performing in situ measurements under water. Furthermore, they cannot distinguish water from polypeptides inside the protein layer. These limitations can be well alleviated by neutron reflection.
In the past five years, we have explored the feasibility of application of neutron reflection in studying protein adsorption and the interfacial interactions between protein and surfactant [15–19]. These studies have been carried out at the air–water and solid–water interfaces. The neutron reflection work has revealed new structural features from protein layers adsorbed under di erent surface and solution conditions and the patterns of interactions between di erent proteins and surfactants. As protein adsorption and interactions between proteins and protein-binding species such as lipid, peptide, anesthetic are of strong interest both fundamentally and technologically, the exploratory experiments we have undertaken so far will have a profound impact to the future exploitation of this technique in a wide range of biointerfacial studies.
In this chapter, a number of recently studied protein systems will be used to demonstrate the typical structural information that can be revealed from neutron reflection. Lysozyme has been mainly used as a model protein because it has well defined globular structure and stability, and many studies have already been carried out to characterize its adsorption. The adsorption of proteins on the surface of water will be shown first to illustrate how structural information can be optimized from selective application of isotopic contrasts of the solvent. Protein adsorption at the solid–solution interface will then be shown to demonstrate how di erent surface chemistry a ects the deformation and unfolding of protein molecules. Finally, examples of surfactant binding to proteins adsorbed at the solid–solution interface will be given to show neutron’s strength in studying interfacial mixtures.
13.2 Neutron Reflection and Concept
of Isotopic Contrast Variation
The technical advantage of neutron reflection is well illustrated in its ability in revealing useful structural information at the solid–solution interface. Under this condition, the deposited protein layer is buried; it is also heavily mixed with water and often less than 100 ˚A in the overall layer thickness. Although many optical techniques can perform the measurement, their sensitivity to the structure and composition of the protein layer is very limited. Because of the di culties associated with the direct measurement under water, it is a widely adopted practice to try to estimate the adsorbed amount at the air– solid interface instead. The associated sample rinsing, drying, and treatments such as staining may alter the amount and biophysical state of the adsorbed protein. The results measured from the dry surface may have little correlation with the in situ structure and composition at the solid–solution interface.
13 Protein Adsorption and Interactions at Interfaces |
267 |
Another important feature from neutron reflection is its ability to distinguish individual components across the interface through partial deuterium labeling, making it a unique tool for revealing the in situ structural profile of individual components.
In our previous studies of interfacial adsorption of surfactants and synthetic polymers, we demonstrated that neutron reflection was capable of detecting volume fraction distribution of any species present along the surface normal direction [15, 16]. When applied with selective isotopic substitution, the technique is sensitive to a given species across the interfacial layer with depth resolution at the level of 1–2 ˚A. Unlike synthetic polymers, proteins are not easily deuterated and this limits isotopic contrast variation to either the solvent or the support surface in the case of solid–solution interface. The concern arises as to how much useful information can be derived from neutron reflection under such circumstance.
An important structural feature of protein molecules is their secondary and tertiary structures. The key issue is whether neutron reflection can provide any, useful structural information that is indicative of conformational changes arising from either interfacial adsorption or from binding and complexation with another compound, e.g., coenzyme. The examples to be shown in the following will focus on addressing this issue. Lysozyme adsorption on the surface of water will be first shown to illustrate how the choice of isotopic contrast can lead to the optimal derivation of structural information. The measurement of lysozyme adsorption at the air–water interface allows us to address two very fundamental issues. First, we would like to know if the adsorption gives rise to deformation or unfolding given that air is a hydrophobic solvent. The adsorption of lysozyme onto the polarized surface may deteriorate the globular framework although lysozyme is very robust. Second, lysozyme has a rather hydrophobic outer surface with an uneven distribution of charged groups. It is interesting to know if the whole adsorbed molecule is staying afloat or immersed in the aqueous solution.
To address the first issue, we have selected an H2O and D2O mixture containing 8.1 vol% D2O. This mixed water has a zero scattering length and is called null reflecting water (NRW). When neutron reflectivity is measured at the air–NRW interface, the only specular signal comes from the adsorbed protein layer [20, 21].
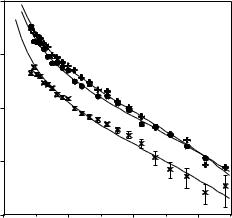
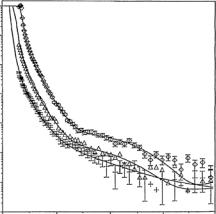
Figure 13.1 shows the reflectivity profiles measured at three di erent lysozyme concentrations, all at pH 7. It can be seen from Fig. 13.1 that the level of the reflectivity increases with increasing concentration, indicating a clear correlation with surface adsorbed amount (surface excess). While the profiles corresponding to the two low lysozyme concentrations are parallel, the third one decays faster indicating a much thicker layer formation at the highest concentration. Although the common approach to extract quantitative information from the measured reflectivity is to perform model fitting based on the optical matrix formula, a useful alternative is via kinematic approach and structural information is then obtained through model fitting to the partial structure factors [15, 16].
268 |
J.R. Lu |
|
1E-3 |
|
|
|
|
1E-4 |
|
|
|
Reflectivity |
1E-5 |
|
|
|
|
|
|
|
|
|
1E-6 |
|
|
|
|
1E-7 |
0.04 |
0.08 |
0.12 |
|
0.00 |
|||
|
|
Momentum transfer (Å−1) |
|
|
Fig. 13.1. Lysozyme adsorption on the surface of null reflecting water (NRW) at 10−3 (×), 0.1 (•) and 1 (+) g dm−3 at pH 7
In the kinematic approximation, neutron reflectivity (R) can be analytically related to area per molecule (A) and layer thickness (τ ). If lysozyme adsorption forms a uniform layer on the surface of NRW, this relationship can be expressed as
hppQ2 = |
RQ4 |
= |
4 |
sin2( |
Qτ |
), |
(13.1) |
16π2bp2 |
A2τ 2 |
2 |
where hpp denotes the partial structure factor for protein and Q is the momentum transfer and is equal to 4π sin θ/λ (where θ is the beam incidence angle and λ is the wavelength). Since changes in A and τ a ect the level and shape of reflectivity di erently the model fitting to the measured reflectivity profiles leads to a reasonably reliable decoupling of the two parameters. The continuous lines shown in Fig. 13.1 represent the best uniform layer fits obtained from Eq. 13.1. The results show that at the lowest concentration the lysozyme layer is about 30 ˚A thick and is consistent with the formation of sideways-on monolayer and the lysozyme molecule is adsorbed with its short axis perpendicular to the surface. This is consistent with the area per molecule of 2800 ˚A2 and is greater than the required minimum of 1350 ˚A2. At the intermediate concentration the layer increases to 34 ˚A. This is accompanied by the decrease of A to 1300 ˚A2 and is within the experimental error comparable to the limiting value for sideways-on adsorption. These changes together with the electrostatic repulsion within the layer suggest the possible tilting of the lysozyme toward headways-on adsorption, that is the molecules adsorbed with its long axis perpendicular to the surface. At the highest concentration of 1 g dm−3, the layer is 47 ˚A thick and is comparable to the long axial
13 Protein Adsorption and Interactions at Interfaces |
269 |
length of the globular structure, indicating that the molecules adopt an entirely headways-on conformation. The area per molecule is 950 ˚A2 and is close to the limiting value of 900 ˚A2 required for headways-on adsorption. These results suggest a progressive transition of conformation of adsorbed lysozyme molecules with increasing bulk concentration.
A common concern in the data analysis of neutron reflectivity is the sensitivity of the model fit to the shape of the layer distribution. It is unlikely that the true protein layer distribution in this case follows the exact uniform layer model. However, the data may not be of su ciently high quality to distinguish one shape from another. It is possible that the lysozyme layer resembles a Gaussian layer distribution more closely. Under the Gaussian model, Eq. 13.1
becomes |
RQ2 |
− |
Q2σ2 |
. |
|
|
|
|
|||||
hpp = |
|
= Γ 2 exp |
|
(13.2) |
||
16π2bp2 |
8 |
|||||
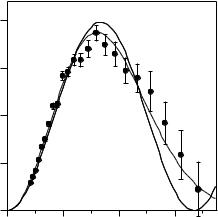
Figure 13.2 compares the best Gaussian model fit from Eq. 13.2 with that calculated from Eq. 13.1 based on the uniform layer model. Clearly, the Gaussian model represents the measured data better over the entire Q range. This is in contrast to the lower values calculated from the uniform layer model over the higher Q range. The better representation from the Gaussian model is reasonable given that the packing density in the middle of the lysozyme is likely to be higher than the two edges.
To address the second issue of the extent of immersion of the layer, reflectivity profiles were also measured in D2O and a mixed D2O and H2O in the ratio of 1:1. Under these conditions, the reflectivity contains contributions from the protein layer, the water interface and the interference between the
|
2.0E-9 |
|
|
|
|
1.5E-9 |
|
|
|
2 |
|
|
|
|
(Q)Q |
1.0E-9 |
|
|
|
pp |
|
|
|
|
|
|
|
|
|
h |
|
|
|
|
|
5.0E-10 |
|
|
|
|
0.0E+0 |
|
|
|
|
0.00 |
0.04 |
0.08 |
0.12 |
|
|
Momentum transfer/(Å−1) |
||
Fig. 13.2. Comparison of the best uniform layer model fit (continuous line) and the best Gaussian model fit (broken line)
270 |
J.R. Lu |
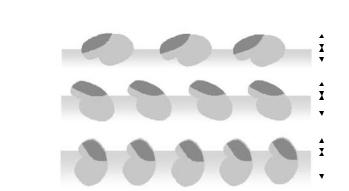
two, thereby providing unique information about the relative location between the two distributions. It is worthwhile to note that under the 1:1 mixed water, the scattering length density of the water phase (ρw) is 2.9 × 10⁻⁶ ˚A−2 and is almost identical to that of lysozyme. Thus the portion of lysozyme layer immersed in water is indistinguishable from the water subphase. The measurement under this condition provides a unique sensitivity to the portion of the layer staying out of the water in the airside. This isotopic contrast together with the simultaneous measurements under NRW and D2O o ers a reliable determination of the extent of layer immersion and lysozyme conformation at a given solution condition. The outcome of this study is depicted in Fig. 13.3 where the shaded background indicates the surface of water. This study shows that the surface adsorption of lysozyme has not resulted in the breakdown of its globular framework and that in contrary to previous assumption the adsorbed layer is only partially immersed in water. Figure 13.3 also shows that the degree of its immersion is also dependent on surface conformation and packing. The shade area on the back of lysozyme molecules as indicated in Fig. 13.3 denotes the more hydrophobic region where less charge groups are present. Over the low surface concentration, it is plausible that this side stays out of water but under the high-surface packing this region is forced into water.
13.3 Adsorption of Other Proteins at the Air–Water
Interface
The neutron reflection from lysozyme adsorption o ered a useful experimental methodology for revealing molecular features relating to surface adsorption of
(a) |
|
|
15Å |
|
|
||
|
|
15Å |
|
|
|
||
|
|
||
1x10⁻³ g/L |
|
|
|
(b) |
|
10Å |
|
|
|||
|
24Å |
||
|
|||
1x10⁻¹ g/L |
|
8Å |
|
|
|||
(c) |
|
||
|
|||
|
|||
|
39Å |
||
|
|||
1g/L |
|
||
|
|
||
|
|
||
Fig. 13.3. Schematic representation of the change of orientation and packing of lysozyme molecules at the air–water interface with bulk concentration. Note that the darkend edges represent the surface of water and the shaded patch on the back of lysozyme donates the region where less charge groups are found
13 Protein Adsorption and Interactions at Interfaces |
271 |
other proteins. We have carried out a systematic assessment of human serum albumin HSA and bovine serum albumin BSA adsorption and found that over a wide concentration range these proteins adopt sideways-on adsorption with their short axial length projected normal to the surface [22, 23]. Both molecules have a short axial length close to 40 ˚A. Below 1 g dm−3, the adsorbed layers are between 25 and 40 ˚A thick and are reasonably well represented by a uniform layer model, indicating a strong deformation upon surface adsorption. However, no indication of further structural deterioration leading to the structural characteristics of polypeptide adsorption was detected.
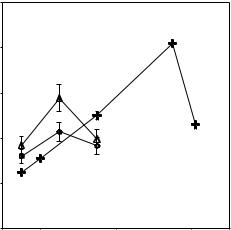
An interesting common feature of surface adsorption of proteins is their pH dependence. This feature is shown in Fig. 13.4 for lysozyme, BSA, and HSA. Maximal surface excess occurs at their respective isoelectric points (IP) at which the net charge within the protein molecule is zero [21–23]. This shows that the lateral charge repulsion plays an important role in governing the total amount of adsorption. As the solution pH is shifted away from the IP, the adsorbed amount goes down, but the rate of decrease varies with the size and stability of the protein. This clearly reflects the apparent “damping” e ect arising from the structural flexibility of larger but less rigid proteins.
13.4 Adsorption at the Solid–Water Interface: The E ect of Surface Chemistry
The bare silicon oxide is hydrophilic with contact angle close to zero. As its weak negative charge over the normal pH range does not cause any major
|
5.0 |
|
|
|
4.0 |
|
|
) |
|
|
|
2 |
|
|
|
(mg/m |
3.0 |
|
|
excess |
2.0 |
|
|
Surface |
|
|
|
|
|
|
|
|
1.0 |
|
|
|
0.0 |
8 |
12 |
|
4 |
||
|
|
pH |
|
Fig. 13.4. The general trend of pH dependent adsorption HSA (o), BSA (∆), and lysozyme (+) at a fixed protein concentration of 1 g dm−3
272 J.R. Lu
complication, the SiO2 surface has been used as a standard to check the reproducibility of adsorption. These experiments rely on the polishing of optically flat silicon oxide surface with a layer of native oxide layer of 12–15 ˚A thick and at the same time to regenerate the surface hydrophilicity [24]. From these SiO2 surfaces, we have been able to anchor self-assembled monolayers (SAM) bearing terminal CH3, NH2, COOH, and phosphorylcholine (PC) groups using silane chemistry. Using the high-structural resolution of neutron reflection, it was possible to control layer uniformity and density by fine-tuning the surface coating conditions. This approach of combining surface coating with stringent surface characterization allows to reproduce high-quality SAM layers with different terminal functions and is in contrast to the vast literature work in this area where organic monolayers are often poorly formed due to the lack of adequate characterization technique. In the contribution by Gutberlet and L¨osche in this volume further approaches to establish and refine organic layer-coated interfaces for studying structure and interaction with proteins are considered.
Figure 13.5 shows the neutron reflectivity measured at the hydrophilic SiO2–solution interface at 1 g dm−3 lysozyme and pH 7 under (a) D2O, (b) the solution contrast matched to a scattering length density (ρ) of 4.0 ×10⁻⁶ ˚A−2 (CM4) and (c) contrast matched to silicon, with ρ = 2.1 × 10⁻⁶ ˚A−2 (CMSi) [25, 26]. The adsorbed layer is highlighted from di erent water contrasts and the combined measurements clearly improve structural sensitivity. Simultaneous fitting of all the reflectivity profiles gives a two-layer model with 30 ˚A each. The inner layer contains more protein than the outer layer and the total adsorbed amount is around 3.7 mg m−2. Lysozyme has an approximate
Reflectivity
0
−1
−2
−3
−4
−5
−6
0.04 |
0.08 |
0.12 |
0.16 |
Momentum transfer/(Å−1)
Fig. 13.5. A two-layer fit to the reflectivity profiles at pH 7 in the presence of 1 g dm−3 lysozyme: (a) ( ) D2O, (b) (∆) CM4 (ρ = 4 × 10⁻⁶ ˚A−2), (c) (+) CMSi
(ρ = 2.1 × 10⁻⁶ ˚A−2). The continuous lines were calculated using surface-adsorbed- amount of 3.6 mg m−2; τ1 = τ2 = 30 ˚A
13 Protein Adsorption and Interactions at Interfaces |
273 |
dimension of 30 × 30 × 45 ˚A3, and the formation of the two 30 ˚A layers at the interface suggests the adoption of two sideways-on molecular sublayers. Other information obtained from this work supports the retaining of globular entity of the protein after adsorption.
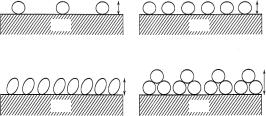
An important characteristic of the adsorbed protein layer is the extent of reversibility with respect to its solution concentration and pH. Hysteresis can be caused by many contacts between protein and the surface [27,28]. Although the fraction of segments in contact with the surface may be small and typically less than a few percent, the adsorption energy can easily be in excess of 100 kJ mol−1 because of the large total number of contacts. Thus, irreversible adsorption is not necessarily associated with denaturation of the protein. Since lysozyme is robust in bulk solution over a wide pH range, we have measured the e ect of pH on the adsorbed lysozyme structure [25,26]. The e ects of pH on lysozyme adsorption at the hydrophilic SiO2–water interface are schematically shown in Fig. 13.6. The surface coverage decreases with decreasing pH as a result of increased repulsion between the molecules inside the monolayer and this increased level of repulsion is also reflected in the reduced adsorption. The model depicts the formation of a sideways-on bilayer at pH 7 and at the higher bulk concentration, but only monolayer adsorption occurs at pH 4. This trend indicates a strong e ect of electrostatic repulsion within the protein layer.
In comparison with the adsorption at the solid–solution interface, the adsorption at the air–water interface as described previously may be treated as a model for assessing the interfacial e ect in the absence of the interference from the solid surface. We recall that at pH 7, lysozyme adsorption progressively changes from sideways-on to end-on conformation as the bulk protein concentration increases [20, 21]. The changeover clearly enables the surface to accommodate more protein molecules. The end-on monolayer gives a thickness of 45 ˚A, but such a change is not observed at the silica–water interface at the high coverage at pH 7. It should be noted that neutron reflection is sensitive to the di erence between 30 and 45 ˚A. The conformational di erence appears
(a) |
pH4 |
pH7 |
|
30Å |
30Å |
|
SiO2 |
SiO2 |
(b) |
35Å |
60Å |
|
|
|
|
SiO2 |
SiO2 |
Fig. 13.6. Schematic diagram to illustrate the variation of surface coverage and structural conformation of lysozyme adsorbed at the silica–water interface with so-
lution pH and bulk concentration. The lysozyme concentrations are (a) 0.03 g dm−3 and (b) 1 g dm−3
274 |
J.R. Lu |
to lie in the interaction with the solid substrate, but the subtlety is more likely to arise from the fine balance between the lateral interaction within the protein layer and the interaction with the surface. At both interfaces, proteins retain their globular framework.
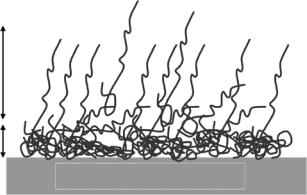
The e ect of surface hydrophobicity was assessed using the SiO2 surface chemically anchored with a dense and well-defined monolayer of octadecyltrichlorosilane (OTS). Partial labeling to the OTS layer (e.g., using C6H13C12D24SiCl3) was found to help highlight the protein layer [29]. At the hydrophobed solid–solution interface, lysozyme adsorption was found to be irreversible to solution pH. In all cases, the interfacial layers were well represented by two main regions, a dense layer of 12–15 ˚A on the inner surface containing some 80% polypeptide and an outer di use layer of 50–80 ˚A containing some 20% polypeptide. The inhomogeneous distributions of the polypeptides, as shown schematically in Fig. 13.7, clearly indicate the unfolding of the globular framework of lysozyme caused by the strong interaction with the support substrate. Similar trend was also observed for BSA.
To assess the e ect of surfaces with intermediate hydrophobicity, a SiO2 surface grafted with C15OH was used to perform the same protein adsorption [30]. The advancing contact angle (θa) for the hydroxy surface was 53◦ and was intermediate between bare silicon oxide (ca. 0◦) and OTS (ca. 110◦). In many polymeric hydrogels, monomers with short alkyl chains bearing hydroxyl groups are readily incorporated to facilitate the water uptake, which is essential for many biomaterials applications such as contact lenses. It is thus useful to examine how this type of surface implicates protein adsorption. It was found that the amount of lysozyme adsorbed was substantially reduced in comparison with the bare SiO2 and OTS surfaces. However, an interesting observation was the formation of a dense but rather uniform protein layer of some 20 ˚A around 1 g dm−3 lysozyme concentration, indicating
80 A
15 A
Hydrophobic OTS substrate
Fig. 13.7. Schematic diagram to illustrate the distribution of unfolded lysozyme at the hydrophobic OTS–water interface.