

Neutron Scattering in Biology - Fitter Gutberlet and Katsaras
.pdf254 C.F. Majkrzak et al.
incoherent background. Unfortunately, a Soller collimator or analyzer crystal produces transmission and reflectivity losses for the specular signal, which typically range between 20% and 50%. Therefore, proper analysis of the signal to noise ratio, including e ciency, counting statistics, and error propagation considerations, is required for the proper use of these devices.
Signal Enhancement
To improve the signal to noise ratio, it can be important to boost the signal, as well as reducing the background. One method of signal enhancement that has proven useful in the study of single lipid bilayer systems is to deposit a Au layer, about 100 ˚A thick, onto a Si substrate. Then the film of interest is a xed to the gold layer: e.g., an alkane thiol layer followed by a phospholipid layer, with a D2O reservoir as a backing [40]. Because the reflectivity can be calculated for a model of such a system, it can be relatively straightforward to determine a feasible combination of the film of interest and signal boosting layers, or surrounding media, that significantly increase the sensitivity of the measurement.
12.3.8 Multilayer Samples: Secondary Extinction and Mosaic
In discussing the theoretical treatment of multilayer reflectivity within the Born approximation, it is implicit that the reflectivity is su ciently low that the reflectivity of a given reflection order is proportional to the square of the number of bilayers M , as we derived above. However, in practice, multilayer samples of lipid bilayers actually form structures similar to mosaic crystals, having an angular distribution of coherently scattering blocks, each consisting of a stack of bilayers. This angular distribution typically is centered about the mean surface normal of the substrate, with the normal of an individual block perpendicular to the plane of the lipid bilayers in that stack. As the incident beam penetrates such a sample, its intensity can be diminished by successive reflections from various stacks, so that a given reflection peak intensity no longer is proportional to M 2. This troublesome e ect, called secondary extinction [5,29,41,42], introduces further complications into the multilayer analysis. It is necessary to recognize and take into account secondary extinction when it occurs so that an error is not made in determining relative reflection peak intensities. Recently, multibilayers of biofilm materials have been made with a well-defined, relatively small number of bilayer repeats which are appropriate for analysis using the dynamical theory outlined in Sect. 12.2.1 [43].
12.3.9 Data Collection Strategies for Time-Dependent Phenomena
In measuring specular reflectivity from thin film systems which may undergo structural changes with time, specular scans must be performed over a given range of Q in a time less than that required for any significant changes to
12 Membranes in Biology by Neutron Reflectometry |
255 |
occur. This can be directly determined by superimposing reflectivity plots for successive scans; successive runs can be added together to improve statistical accuracy once equilibrium has been achieved. Whether the film under study exhibits time-dependent behavior or not, it is prudent to perform rocking curves in between specular or other scans, such as background, to verify correct alignment of the sample.
12.4 Phase Determination Techniques
Earlier in the chapter we discussed the connection between the phase of the complex reflection amplitude and the uniqueness of SLD profiles. Here we continue discussion of phase-sensitive specular reflectometry techniques, outlining practical methods for determining the phase of reflection for a film of interest using reflectivity measurements of composite film structures, i.e., film sandwiches composed of the “unknown” film adjacent to a reference layer or to a known surrounding medium. These methods have been recently reviewed in depth [11].
12.4.1 Reference Films
Figure 12.16a illustrates the measurements which are performed to determine the SLD profile of a film, in this case a Cr/Au layer deposited on a Si substrate. The reference layer consists of a ferromagnetic Fe layer with a magnetization which is saturated in the plane of the film. For a polarized neutron in the “+” spin state (one of two possible spin eigenstates), the SLD of the Fe layer is a sum of two parts, one associated with the nuclear interaction and the other with the magnetic potential which exists between the magnetic moments of the neutron and the Fe atoms. In contrast, a neutron polarized in the “−” state sees a SLD which is the di erence of the nuclear and magnetic components. By measuring two reflectivity data sets, one with a beam of neutrons in the “+” spin state and the other in the “−” state, plotted in Fig. 12.16a, the imaginary part of the reflection amplitude for the the Cr/Au film, can be determined uniquely, exactly, and independently at each Q [48]. The result is shown in Fig. 12.16b. The imaginary part of the reflection amplitude can then be inverted by a first principles calculation [26, 46, 47]. (More formally, either Re r(Q) or Im r(Q) su ces for most of the SLD profiles of interest to biology.) The result of inverting Im r(Q) of Fig. 12.16b is also shown in the figure. The SLD profile so obtained is unique, to the extent allowed by the finite wavevector range over which the original reflectivity data was collected. In solving for Im r(Q) of the unknown, two roots of a quadratic equation are obtained, only one of which is physical [25, 48]. The physical branch Im r(Q) can be determined, in principle, because Im r(Q) must be a continuous function of Q with known behavior at the origin, viz., Im r(Q) ← 0 from negative values for an overall positive SLD. However, it can happen in practice that the separation of the two

256 C.F. Majkrzak et al.
(a)1
|
|
|
1.2e-05 |
|
0.1 |
|
|
|
|
) |
8e-06 |
|
0.01 |
2− |
|
|
(Å |
|
|
|
|
|
|
|
|
ρ |
4e-06 |
|
|
|
|
2 |
0.001 |
|
|
(Q)I |
|
|
|
0.0001 |
|
|
|
IR |
|
|
|
|
|
|
|
|
1e-05 |
Q , z |
|
|
|
|
|
|
k |
k |
|
|
1e-06 Au |
|
|
Si
Fe
Si substrate
1e-070 0.05 0.1 0.15
Q (Å−1)
(b)0.15
4
) −2 Å
Fe" " |
|
|
Au |
Si |
|
Fe"−" |
|
100 |
200 |
z (Å) |
|
0.2 0.25 0.3
Au
Im r(Q)
0.1
0.05
0
−0.050
−6 ρ(10
2
Si
0
40 80 120 180 z (Å)
x 10
0.05 0.1 0.15 0.2 0.25 0.3
Q (Å−1)
Fig. 12.16. Diagram illustrating the measurements which are performed to determine the SLD profile of an “unknown” film, in this case a Cr/Au layer deposited on a Si substrate (a). By measuring two reflectivity data sets the imaginary part of the reflection amplitude for the “unknown” film of interest, in this example the Cr/Au layers, can be determined uniquely at each value of Q; the result is shown in (b). The upper right corner inset of (a) shows the SLD profiles corresponding to independent fits of the reflectivities for the two composite film systems. The imaginary part of the reflection amplitude can then be inverted by a first principles calculation, as discussed in the text, the result of which is also shown in (b). (after Figs. 12.2 and 12.3 of [48])
branches is problematic, especially for noisy data. The use of three reference layers eliminates this problem – and in fact, was the first of the exact reference techniques for specular reflection [22, 23, 49] – but three references are di cult to achieve using a single magnetic layer. Furthermore, in any finite reference layer method for phase determination, the entire SLD density profile of each reference layer used must be known with an accuracy commensurate with the spatial resolution desired in the sample film profile. And of course, magnetic references, in particular, require the availability of polarized neutron beams.
12 Membranes in Biology by Neutron Reflectometry |
257 |
12.4.2 Surround Variation
A reference method closely related to that employing di erent layers of finite thickness, as described above, involves varying the surrounding media, fronting or backing. This “variation on a theme” has the important advantage that only two constant SLD values, for either the fronting or backing, are required to obtain Re r(Q) corresponding to the sample film, independently at each Q, and without branch ambiguities [24], since, the resulting surround variation equations are linear. One approach that has been successfully employed involves depositing the sample film on two di erent substrates, e.g., Al2O3 and Si, simultaneously and under identical conditions [27]. Care must be taken to limit any di erences between the two samples which could be present, such as the presence of a native oxide layer on the Si or a layer of di erent SLD on the Al2O3 due to the e ects of surface polishing.
A less cumbersome approach employs a single sample and an adjacent liquid reservoir of variable SLD. Figure 12.17a contains a schematic of a surround variation method for phase determination in which the backing medium SLD can have (at least) two values, in this particular example that of D2O and Si-(SLD) matched water – i.e., an H2O and D2O mixture with approximately38% D2O by volume. Figure 12.17 also shows the corresponding composite reflectivity curves for these two backing media adjacent to the Cr/Fe/Au/alkane thiol film indicated in the upper right hand corner of the figure. This is similar to the film structure of Fig. 12.16, except that the Fe “+” and “−” layers are now treated as part of the “unknown” film. Included in Fig. 12.17a is Re r(Q) for the unknown film, one in which the SLD of the saturated magnetization of the ferromagnetic Fe layer is that seen by a spin “+” state neutron beam. Last, Fig. 12.17b shows the SLD profile obtained by direct inversion of the Re r(Q) of Fig. 12.17a. For comparison, the SLD profile obtained for the “−” state neutron beam is also shown [45]. Note the consistency of the two results; the Au layer SLD is virtually identical in both sandwich structures, the one with the Fe “+” layer and the other with the Fe “−” film.
Given the importance and ubiquity of aqueous solutions in the study of biomembranes, the method of choice in phase-sensitive reflectivity measurements would very likely be variation of the backing medium using a suitable fluid, except for one crucial concern. If the fluid di erentially penetrates the adjacent film of interest, then the reference measurement is destined to fail, since an essential premise of the technique is that the film of interest be invariant to the change in references. This restriction therefore precludes the use of variation by D2O /H2O substitution if water penetrates the membrane, which indeed is known to occur. This problem can be solved if an aqueous solution could be found in which a suitable solute is the agent of SLD variation without interfering with the film: possibly, for example, a sugar in D2O , where sugar molecules – of variable concentration – do not penetrate or modify the film, whether or not the constant D2O component is integral to the film. This would indeed be a “sweet solution” for surround variation in some problems.

258 C.F. Majkrzak et al.
(a)
|
0.5 |
|
0.4 |
|
0.3 |
(Q) |
0.2 |
r |
|
Re |
0.1 |
|
Lab (air)
Si fronting
Fe
Au
alkane thiol H2O/D2O backing
0 |
|
|
x 10 |
|
|
|
|
|
|
|
|
−0.1 |
|
|
|
|
|
−0.20 |
0.05 |
0.1 |
0.15 |
0.2 |
0.25 |
|
|
|
Q (Å−1) |
|
|
(b) |
14 |
|
|
0.2 |
|
|
|
|
|
|
|
12 |
|
|
0.1 |
|
|
|
|
|
|
|
|
|
r |
0 |
|
|
|
|
|
|
|
|
|
Im |
|
|
|
|
|
|
|
|
10 |
|
|
|
|
|
|
|
Fe+ |
|
|
|
|
−0.1 |
|
|
|
|
|
||
) |
|
|
|
|
|
|
|
|
||
|
|
|
|
|
|
|
|
|
|
|
−2 |
8 |
|
|
−0.2 |
|
|
|
|
|
|
Å |
|
|
|
|
|
|
|
|
|
|
−6 |
6 |
|
|
0.02 |
0.04 |
0.06 |
0.08 |
0.1 |
0.12 |
0.14 |
alkanethiol |
|
|
|
Q (Å−1) |
|
|
|
|||
ρ(10 |
2 |
|
|
|
|
Au |
|
|
Fe− |
|
|
4 |
|
|
|
|
|
|
|
|
|
|
0 |
|
|
|
|
|
|
|
|
|
1
0.1
0.01
0.001
0.0001
1e-05
1e-06
1e-07
0.3
Reflectivity
0 20 40 60 80 100 120 140 160 180 200 z (Å)
Fig. 12.17. Schematic representation of a surround variation method for phase determination in which the backing medium SLD can have (at least) two values, in this particular example that of D2O and Si-SLD-matched water (a). (a) shows plots of the corresponding composite reflectivity curves for these two backing media SLD values adjacent to the Cr/Fe + /Au/alkane-thiol film; note that this is similar to the film structure of Fig. 12.16 except that the Fe “+” layer is now treated as part of the “unknown” film. (a) also shows Re r(Q) for the “unknown” film, one in which the SLD of the saturated magnetization of the ferromagnetic Fe layer is that seen by a spin “+” state neutron beam. Last, (b) shows the SLD profile obtained by direct inversion of Re r(Q) of (a). For comparison, the SLD profile obtained for the “−” state neutron beam is also shown. (after Figs. 12.1 and 12.2 of [45])
12.4.3 Refinement
The formal inversion methods alluded to earlier begin with a Fourier transform of Re r(Q) and thus require this information at all values of Q for exact implementation. Thus, the resulting SLD profiles are distorted by unavoidable data truncation, the e ect decreasing systematically with increasing Qmax. This means that the ρ(z|Qmax) obtained by inverting Re r(Q|Qmax) will not exactly reproduce Re r(Q|Qmax) without additional refinement. Useful
12 Membranes in Biology by Neutron Reflectometry |
259 |
approaches to this problem [12, 18, 51] take ρ(z|Qmax) as a starting point for model independent fitting procedures designed to accept only spatial detail consistent with the spatial resolution, l = π/Qmax. The resulting refinement, say ρ˜(z|Qmax), e ectively represents the most that can be said about the veridical ρ(z) at the given resolution.
Only the real part of the reflection amplitude, Re r(Q), is necessary to obtain the SLD profile by first-principles inversion for most films of interest, as mentioned in our discussion of surround variation in Sect. 12.4.2. Now the same information which gives Re r(Q) also predicts Im r(Q), but only up to a quadratic branch ambiguity, similar to that discussed in Sect. 12.4.1 for the technique using two finite references layers. This ambiguity is of no concern to obtaining ρ(z), but the ancillary, if incomplete, knowledge of Im r(Q) that also results from surround variation happens to be a useful diagnostic of film quality, because of a seemingly arcane mathematical property of r(Q). It turns out that for a perfect but arbitrary film of thickness L, the spectrum of Im r(Q) must possess a more-or-less uniform sequence of zeros near multiples of Q = 2π/L, suggestive of the Kiessig fringes seen in the reflectivity, as described in Sect. 12.3.2 [45]. On the other hand, Re r(Q) need display these zeros only if the film is perfectly centrosymmetric. So, in fact, the Kiessig fringes observed in |r(Q)|2 normally are not the manifestation of zeros in r(Q) but rather of Im r(Q) alone. In physical terms, these zeros are a property of coherent reflection from laterally homogeneous film and are readily detectable even in the presence of branch ambiguities. The absence of zeros, i.e., the presence of branch “splittings” in Im r(Q), thus is a strong indication that the film under study is defective in these terms.
For example, as discussed in Sect. 12.3.2, if a film is laterally inhomogeneous on a scale large compared to the neutron coherence length, then the measured specular reflectivity is an average of areally weighted reflectivities from the separate inhomogeneous components, as given in Eq. 12.20. In this case, there is no single SLD profile associated with the measured reflectivity, and any attempt to extract one, whether by inversion or fitting techniques, will produce unphysical results. The absence of Im r(Q) splittings, beyond those consistent with noise e ects, is a good indication of acceptable film quality [27].
12.5 An Illustrative Example
To illustrate the application of neutron reflectometry to the study of biofilms, we consider the recent structural investigation of a hybrid bilayer membrane (HBM) and its interaction with melittin [40]. In this particular study, specular neutron reflectometry was used to probe the interactions of the peptide toxin, melittin, with supported bilayers of phospholipid (d54-dimyristoyl phosphatidycholine or dDMPC) and octadecanethiol (HS(CH2)17CH3) or thiahexa(ethylene oxide) alkane (HS(C2H4O)6(CH2)17CH3 or THEO-C18) on gold. This supported lipid bilayer consisting of adjacent “leaflets” of alkanethiol and phospholipid forms a model biomimetic membrane. The primary
260 C.F. Majkrzak et al.
objectives of the study were to locate the position and orientation of the melittin within the membrane and also to determine whether the ethylene oxide moieties are hydrated when the HBM is in contact with water. Sample preparation and other details of the experiments and analysis can be found in the original work [40].
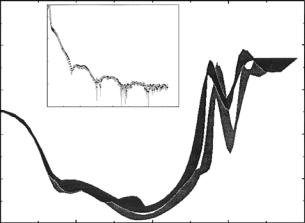
Figure 12.18 shows the SLD profiles of the THEO-C18/dDMPC HBMs next to a D2O reservoir with and without melittin, as obtained from modelindependent fitting of the corresponding reflectivity data shown in the inset [40]. Note Qmax ≈ 0.73 ˚A−1, corresponding to a spatial resolution about
0.5nm.
In order to verify that profiles so obtained were physically meaningful,
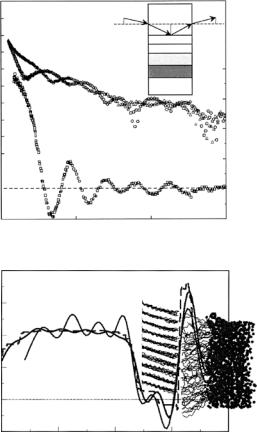
phase-sensitive neutron reflectivity measurements were performed [27] on an almost identical pair of samples: self-assembled THEO-C18 on a Cr/Au metallic bilayer, predeposited on Si and Al2O3 single crystal substrates, followed by the dDMPC layer. In this case, the Si and Al2O3 substrates served as two different fronting media, with a common backing of Si SLD-matched water, for collection of the pair of composite reflectivity data sets shown in Fig. 12.19. Re r(Q) for the common film sandwich determined from that reflectivity data by the surround variation solution is also shown in the figure, along with a schematic for the phase-sensitive reflectivity measurements [27]. Figure 12.19 shows the ρ(z) obtained by first-principles inversion of the Re r(Q) using the techniques of Sect. 12.4.2. This unique solution is compared to the prediction
) −2 cm
10 (10r
9.0
|
|
10−1 |
|
7.0 |
Reflectivity |
10−3 |
|
CD2 |
|||
|
|||
|
|
||
|
|
10−5 |
5.010−7
10−9
|
0.0 |
0.2 |
0.4 |
0.6 |
0.8 |
|
3.0 |
|
|
Q (Å−1) |
|
|
|
|
|
|
|
|
|
|
|
S |
|
|
|
|
|
1.0 |
|
|
|
|
Lipid |
|
|
|
|
CH2 |
headgroup |
|
|
|
|
|
|
|
|
|
|
Ethylene- |
|
|
CH2/CD2 |
|
|
−1.0 |
oxide |
|
|
|
|
|
|
|
|
100.0 |
120.0 |
140.0 |
|
60.0 |
|
80.0 |
|
|||
z (Å)
Fig. 12.18. SLD profiles of the THEO–C18/dDMPC HBMs described in the text next to a D2O reservoir with and without melittin (darker shaded thick curve) as obtained from model-independent fitting of the corresponding reflectivity data (filled symbols without melittin) plotted in the inset [40]. (The Cr/Au metal layers, Cr, 20 ˚A thick, and Au, 65 ˚A thick, on Si, are not shown.) Note that Qmax ≈ 0.73 ˚A−1, corresponding to a spatial resolution about 0.5 nm
12 Membranes in Biology by Neutron Reflectometry |
261 |
of a molecular dynamics simulation [31]. The close similarity of the SLD profiles of Fig. 12.18 (without melittin) and Fig. 12.19, gives confidence in the results.
The neutron reflectivity study described above indicates that melittin strongly perturbs the phospholipid headgroup region, but also a ects the
Log R(Q)
) −2 Å −6 (10r
0
−1 −2 −3 −4 −5 −6 −7 −8
0
8
6
4
2
0
−20
Si-Al2O2
fronting
Lab (air)
Cr
Au alkanethiol
lipid Si-matched water backing
0.1 0.2
Q (Å−1)
SAM
Au Cr
0.08 |
r(Q)Re |
|
0.06 |
||
|
||
0.04 |
|
0.02
0.00
−0.02
0.3
Lipid
Water
50 |
100 |
150 |
200 |
z (Å)
Fig. 12.19. Phase-sensitive neutron reflectivity measurements performed on a selfassembled THEO-C18 layer on a Cr/Au metallic bilayer, pre-deposited on Si and Al2O3 single crystal substrates, followed by a dDMPC layer (top). Re r(Q) for the common film sandwich determined from that reflectivity data is shown in the lower part, along with a schematic for the phase-sensitive reflectivity measurements in the upper right corner (details of the neutron reflectivity measurements and analysis are given in [27]). The SLD profile obtained by first-principles inversion (solid curve with pronounced oscillations in the Au/Cr region due in part to truncation of the data at Qmax) of the Re r(Q) is shown below [27]. This unique solution is compared to the prediction of a molecular dynamics simulation (other solid curve) [31]
262 C.F. Majkrzak et al.
alkane chain region of the bilayer. Among other findings [40], these results demonstrate the utility of neutron reflectometry in determining subnanometer structural changes in biomimetic membranes caused by biologically relevant molecules.
References
1.B. Alberts, D. Bray, J. Lewis, M. Ra , K. Roberts, J.D. Watson, in The Cell, 3rd ed. (Garland Publishing, New York, 1994)
2.S.K. Sinha, E.B. Sirota, S. Garo , H.B. Stanley, Phys. Rev. B 38, 2297 (1988)
3.R. Pynn, Phys. Rev. B 45, 602 (1992)
4.S. Krueger, Cur. Opin. Coll. & Interface Sci. 6, 111 (2001)
5.G.E. Bacon, in Neutron Di raction, 3rd ed. (Oxford University Press, London, 1975)
6.J. Penfold, R.K. Thomas, J. Phys.: Condens. Matter 2, 1369 (1990)
7.T.P. Russell, Mater. Sci. Rep. 5, 171 (1990)
8.X-ray and Neutron Reflectivity: Principles and Applications, ed. by J. Daillant, A. Gibaud (Springer, Berlin, 1999)
9.C.F. Majkrzak, Acta Physica Polonica A 96, 81 (1999)
10.C.F. Majkrzak, J. Kwo, M. Hong, Y. Yafet, D. Gibbs, C.L. Chien, J. Bohr, Adv. Phys. 40, 99 (1991)
11.C.F. Majkrzak, N.F. Berk, U. Perez-Salas, Langmuir 19, 7796 (2003)
12.N.F. Berk, C.F. Majkrzak, Langmuir 19, 7811 (2003)
13.E. Merzbacher, Quantum Mechanics, 2nd ed. (Wiley, New York, 1970)
14.N.F. Berk, C.F. Majkrzak, unpublished
15.M. Born, E. Wolf, in Principles of Optics, (Pergammon Press, Oxford, 1987), p. 51
16.C.F. Majkrzak, N.F. Berk, Physica B 336, 27 (2003)
17.J.F. Ankner, C.F. Majkrzak, SPIE Proc. 1738, 260
18.N.F. Berk, C.F. Majkrzak, Phys. Rev. B 51 11296, (1995)
19.G. Fragneto, R.K. Thomas, A.R. Rennie, J. Penfold: Science 267, 657 (1995)
20.W. Leslauer, J.K. Blasie, Acta Cryst. A 27, 456 (1971)
21.M.K. Sanyal, S.K. Sinha, A. Gibaud, K.G. Huang, B.L. Carvalho, M. Rafailovich, J. Sokolov, X. Zhao, W. Zhao, Europhys. Lett. 21, 691 (1993)
22.C.F. Majkrzak, N.F. Berk, Phys. Rev. B 52, 10827 (1995)
23.V.O. de Haan, A.A. van Well, S. Adenwalla, G.P. Felcher, Phys. Rev. B 52, 10831 (1995)
24.C.F. Majkrzak, N.F. Berk, Phys. Rev. B 58, 15416 (1998) (Erratum Phys. Rev. B 60, 16211 (1999))
25.R. Lipperheide, J. Kasper, H. Leeb, Physica B 248, 366 (1998)
26.K. Chadan, P.C. Sabattier, Inverse Problems in Quantum Scattering Theory
(Springer, New York, 1989)
27.C.F. Majkrzak, N.F. Berk, S. Krueger, J.A. Dura, M. Tarek, D. Tobias, V. Silin, C.W. Meuse, J. Woodward, A.L. Plant, Biophys. J. 79, 3330 (2000)
28.C.F. Majkrzak, N.F. Berk, D. Gibbs, in Magnetic Multilayers, ed. by L.E. Bennett, R.E. Watson (World Scientific, Singapore, 1994), p. 299
29.M.C. Wiener, S.H. White, Biophys. J. 59, 162 (1991)
12 Membranes in Biology by Neutron Reflectometry |
263 |
30.J.K. Blasie, B.P. Schoenborn, G. Zaccai, in Neutron Scattering for the Analysis of Biological Structures, Brookhaven Symposia in Biology No. 27 (BNL50453) (NTIS, Springfield, VA, 1976), p. III-58
31.M. Tarek, K. Tu, M.L. Klein, D.J. Tobias, Biophys. J. 77, 964 (1999)
32.C.F. Majkrzak, Physica B 221, 342 (1996)
33.R. Gaehler, J. Felber, F. Mezei, R. Golub, Phys. Rev. A 58, 280 (1998)
34.S.K. Sinha, M. Tolan, A. Gibaud, Phys. Rev. B 57, 2740 (1998)
35.H.J. Bernstein, F.E. Low, Phys. Rev. Lett. 59, 951 (1987)
36.R. Golub, S.K. Lamoreaux, Phys. Lett. A 162, 122 (1992)
37.H. Rauch, S.A. Werner, Neutron Interferometry (Clarendon Press, Oxford, 2000)
38.A. Zeilinger, R. Gaehler, C.G. Shull, W. Treimer, in AIP Conference. Proceedings of Neutron Scattering, ed. by J. Faber (AIP, 1982), p. 93
39.A. Steyerl, K.A. Steinhauser, S.S. Malik, N. Achiwa, J. Phys. D, Appl. Phys. 18, 9 (1985)
40.S. Krueger, C.W. Meuse, C.F. Majkrzak, J.A. Dura, N.F. Berk, M. Tarek, A.L. Plant, Langmuir 17, 511 (2001)
41.M.J. Yeager, in Neutron Scattering for the Analysis of Biological Structures, Brookhaven Symposia in Biology No. 27 (BNL50453) (NTIS, Springfield, VA, 1976), p. VII-77
42.D.L. Worcester, in Neutron Scattering for the Analysis of Biological Structures, Brookhaven Symposia in Biology No. 27 (BNL50453) (NTIS, Springfield, VA, 1976), p. III-37
43.U. Mennicke, T. Salditt, Langmuir 18, 8172 (2002)
44.K.-M. Zimmermann, M. Tolan, R. Weber, J. Stettner, A.K. Doerr, W. Press, Phys. Rev. B 62, 10377 (2000)
45.C.F. Majkrzak, N.F. Berk, V. Silin, C.W. Meuse, Physica B 283, 248 (2000)
46.P.E. Sacks, Wave Motion 18, 21 (1993)
47.N.F. Berk, C.F. Majkrzak, J. Phys. Soc. Jpn 65, Suppl. A 107, (1996)
48.C.F. Majkrzak, N.F. Berk, Physica B 267–268, 168 (1999)
49.C.F. Majkrzak, N.F. Berk, J.A. Dura, S.K. Satija, A. Karim, J. Pedulla, R.D. Deslattes, Physica B 248, 338 (1998)
50.J.M. Cowley, in Di raction Physics (North Holland, Amsterdam, 1990), p. 131.
51.C.F. Majkrzak, N.F. Berk, Appl. Phys. A 74, S67 (2002)
52.R.G. Nuzzo, F.A. Fusco, D.L. Allara, J. Am. Chem. Soc. 109, 2358 (1987)