

Neutron Scattering in Biology - Fitter Gutberlet and Katsaras
.pdf10 Structure and Kinetics of Proteins |
193 |
(a) |
(b) |
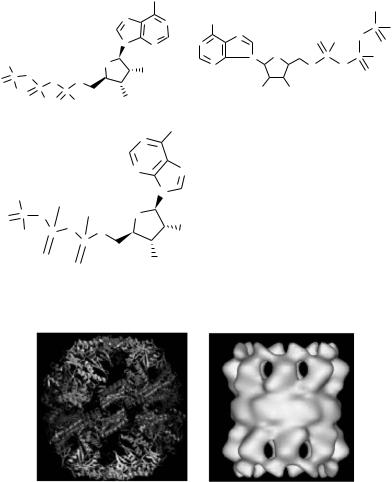
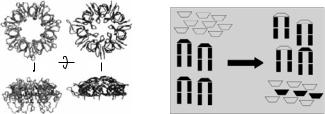
Fig. 10.2. Structures of the GroEL in complex with the co-chaperonin GroES (bound on one side of the GroEL cylinder), (a) Envelope reconstruction based on SANS data [7], (b) X-ray crystallographic data (Protein Data Bank entry: 1AON)
environmental conditions such as pH or ionic strength [31]. Beyond this approach, reaction intermediates can be stalled by introducing ligand substitutes that block the further reaction pathway. In special cases the reaction can be slowed down by cooling or by using viscous solutes, and the reaction intermediates can be investigated.
A typical approach for the substitution of a ligand is the exchange of adenosine triphosphate (ATP) by a nonhydrolysable equivalent (see Fig. 10.3). Such substitutes bind in many cases as specifically to the protein and can facilitate a structural change in the same way as ATP. However, the subsequent secession of the triphosphate during the hydrolysis reaction is inhibited. Thus, these kinetically stalled structures are reaction intermediates just before the hydrolysis reaction takes place.
10.4.1 Trapping of Reaction Intermediates:
The (αβ)-Thermosome
The trapping approach was used for the investigation of a chaperonin from the archaebacterium Thermoplasma acidophilum. The thermosome is a member of the chaperonin family (see Section 10.3.2) It consists of two di erent subunits (α and β) that are alternating in an eightfold ring. Two of these rings bind back-to-back forming the typical double donut structure of the chaperonins. The ADP-bound form facilitates the binding of the misfolded substrate protein. ADP is replaced by ATP and the subsequent hydrolysis of ATP to ADP triggers the refolding process. The thermosome exists in at least two di erent conformations; an open cylindrical and a closed ball-like structure were observed by protein crystallography [32] and cryo-electron microscopy [33, 34], respectively (see Fig. 10.4). The two structures are considered as reaction intermediates in the reaction cycle of the chaperonin. The open conformation corresponds to the substrate acceptor state and the closed state to one of maybe several refolding intermediates.
194 M.W. Roessle et al.
|
(a) |
|
|
|
|
N |
|
(b) |
|
|
|
|
|
|
|
|
|
|
|
|
|
o |
|
|
|
|
|
|
|
|
|
|
|
|
|
|
|
|
|
N |
|
|
N |
N |
|
|
|
|
|
|
|
|
|
|
|
|
P S |
||
|
|
|
|
|
|
|
|
|
|
||
|
|
|
|
|
|
|
|
|
|
|
|
|
Na+ |
|
|
|
|
|
|
N |
|
o o |
o |
|
|
|
N |
|
N |
|
N |
|
o |
||
|
Na+ |
|
|
|
|
|
|
o |
|
P o |
|
|
|
|
o |
|
|
|
N |
P |
|||
|
o |
|
|
o |
|
|
N |
|
o |
o |
|
|
P o |
|
|
|
|
|
|
|
|
o |
|
o |
o |
o |
|
|
|
|
|
|
|
||
P |
|
|
|
|
|
o |
o |
|
|||
|
|
|
|
|
|
|
|
|
|||
|
o o |
P |
o |
o |
|
|
|
|
|
||
|
|
o o |
|
|
|
|
|
|
|
||
|
(c) |
|
|
|
|
|
|
N |
|
|
|
|
|
|
|
N |
|
|
|
|
|
|
NN
o |
|
o |
|
N |
o P |
H |
o |
o |
|
N |
|
|||
o |
|
o |
||
o |
P |
o |
||
|
|
|
P |
|
|
o |
o |
|
o |
|
|
|
|
Fig. 10.3. (a) ATP and substitutes: (b) ATP-γS, (c) AMP-PNP
Fig. 10.4. Structures of the thermosome as derived by protein crystallography and cryo-electron microscopy
The energy gained in the ATP hydrolysis reaction is mainly used for triggering the chaperonin into a new reaction intermediate where the refolding of the substrate protein takes place. The SANS investigation of the reaction intermediates was facilitated by using di erent ligand substitutes and conditions. From other chaperonins such as the GroEL/GroES system from E. coli it is known that the structure of the reaction intermediates depends on the nucleotide bound to the protein. In contrast to the GroE system the thermosome does not possess a co-chaperonin. Thus, the necessary closing of the refolding vessel must be accomplished by the di erent domains of the
10 Structure and Kinetics of Proteins |
195 |
thermosome. The SANS approach with trapping the reaction intermediates can be used in this case for stepping through the reaction.
The ATP-binding structure was observed by mimicking ATP with its nonhydrolysable analogue AMP-PNP, whereas the subsequent hydrolysis step was investigated by adding ADP together with an excess of phosphate to the thermosome. The phosphate-ADP condition drives the protein back to the state shortly after the hydrolysis reaction where the phosphate is no longer covalently bound, but still not ejected from the binding site. In order to probe the temperature dependence of the nucleotide-driven structural changes the experiments were performed by scanning di erent temperatures and nucleotides. Since the thermosome is found in an archea, which can stand high temperatures, a temperature range up to 50◦C was chosen. These extreme experimental parameters are easily accessible to small-angle scattering.
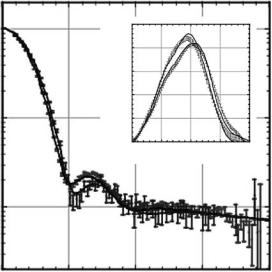
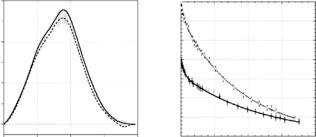
The scattering curves corresponding to the closed and open states of the thermosome are shown in Fig. 10.5. The di erence of the two states can be clearly distinguished by SANS. The experiments were performed on protonated thermosome in a bu er containing D2O in order to enhance the scattering signal-to-noise ratio. As can be seen in Fig. 10.1, the contrast of natural protein is highest in D2O, and at the same time, the incoherent scattering from D2O is significantly lower than from H2O.
The results listed in Table 10.2 show the transition of the open thermosome conformation to the closed state upon the ATP hydrolysis. Only at 50◦C, the
I(q) normiert
1
0.1
P(r) normiert
0.025
0.02
0.015
0.01
0.005
0
0 50 100 150 200
r/Å
0.01
0 |
0.05 |
0.1 |
0.15 |
0.2 |
|
|
q/Å−1 |
|
|
Fig. 10.5. Experimental data for the open and closed thermosome structure
196 M.W. Roessle et al.
Table 10.2. Conformation of the thermosome under di erent nucleotide conditions at 50◦C
nucleotide |
conformation |
AMP-PNP |
closed |
ADP-AlF |
open |
ADP-Pi |
closed |
ADP |
open |
Pi (control) |
open |
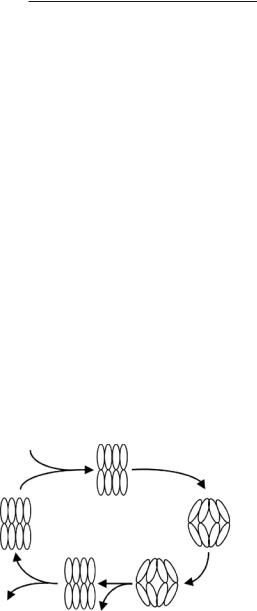
thermosome a closed thermosome-ATP structure was observed, i.e., the thermosome behaved like GroE, while at lower temperatures, thermosome-ATP remained in an open conformation. It would be very di cult to observe this important finding with another method than solution scattering. Based on the structural data of this archebacterial chaperonin the individual reaction intermediates of the complete reaction cycle were identified [34, 35]. The proposed reaction cycle is shown the next Fig. 10.6.
The comparison of these results together with biochemical data and structures found by cryo-EM allowed to round o the understanding of the thermosome ATPase activity cycle, and the ADP-Pi state was found to be the rate-limiting step of the reaction.
10.4.2 Quasi-static Analysis of Reaction Kinetics–The Symmetric
GroES–GroEL–GroES Complex
A standard method for the investigation of reaction kinetics are steady-state titration experiments in which the amount of formed reaction product is measured depending on the concentration of one reaction partner [36]. This
Activated thermosome ATP
ATP
Thermosome ATP
Thermosome
Thermosome ADP
ADP
Pi |
Thermosome ADP+Pi |
Fig. 10.6. Proposed reaction cycle for the thermosome upon nucleotide binding and hydrolysis [34]
10 Structure and Kinetics of Proteins |
197 |
approach can also be used in SANS, simply by measuring the overall scattering power, which is proportional to the molecular mass of the scattering particle (see Sect. 10.2).
However, much more information can be obtained by taking advantage of the di erent contrast of protonated and deuterated proteins. Let us look at the formation of the symmetric chaperonin complex GroEL–GroEL–GroES, a reaction intermediate that is found in the presence of high concentrations of ATP [37]. Although the physiological relevance of the symmetric complex for substrate folding is not proven, it is interesting for the study of the cooperative interactions of the GroE/nucleotide system
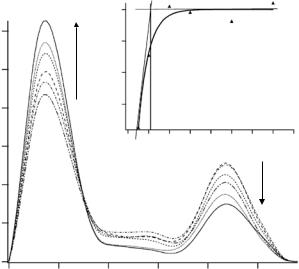
For the steady-state titration analysis, ATP was substituted by its nonhydrolysable analogue AMP-PNP. In order to override the anticooperativity of the GroEL the concentration of ANP-PNP was in a 100-fold excess with respect to GroEL. Under these conditions the second GroEL ring is switched into the GroES acceptor state. Protonated GroEL was matched by 40% D2O, and the concentration of perdeuterated GroES was increased stepwise. Figure 10.7 shows the p(r) functions derived from the scattering data.
As described above, only the deuterated GroES protein contributes to the scattering signal. Thus, the first maximum in the p(r) function is due to the increasing amount of GroES; it stems from all distances within single, bound or unbound, GroES molecules. Besides this dominant maximum a smaller
P (r)
(a.u.) |
1.0 |
|
|
||
(normalized) |
0.8 |
|
|
0.9 |
|
-EL-ES/EL |
0.7 |
|
ES |
||
|
||
C |
|
1.5 |
2.0 |
2.5 |
3.0 |
3.5 |
4.0 |
4.5 |
5.0 |
5.5 |
CGroES / CGroEL
area A GroES
area B
GroES - GroSE
0 |
50 |
100 |
150 |
200 |
250 |
|
|
|
r (Å) |
|
|
Fig. 10.7. Formation of the symmetrical GroES–GroEL–GroES complex. With increasing GroES concentration the amount of symmetric complex increases

198 M.W. Roessle et al.
peak at 210 ˚A indicates the binding of a second GroES to the opposite side of the GroEL cylinder; it is due to all distances linking a volume element in one GroES molecule to a volume element of another GroES at a fixed position at the opposite end of a GroEL molecule. This signal can be used to derive kinetic data for the formation of the symmetric GroES–GroEL–GroES complex. Since the integral of the p(r) function is directly related to the molecular mass, the integral of the peak at 210 ˚A reflects the amount of formed symmetrical complex. The integral of the first maximum can be used for normalization. The data can be fitted by solving the equation for a reaction over an activated complex:
GroES + GroEL = GroES–GroEL = GroES–GroEL–GroES
In order to solve the di erential equation of this reaction one can assume the following conditions:
–In the presence of a high amount of AMP-PNP every GroEL has bound at least one GroES
–For cEL:cES ≤ 1 all GroES is bound to GroEL in the asymmetric or symmetric complex
Under these assumptions the time-dependent concentrations of the symmetric complex are determined by the two di erential equations [36]:
cEL = casym.comp + csym.comp, |
(10.3) |
||||
cES = casym. comp + 2 · csym. comp + cfree ES. |
(10.4) |
||||
By defining a dissociation constant KD |
|
|
|
||
KD = |
k−1 |
= |
csym. comp cES |
, |
(10.5) |
|
|||||
|
k1 |
casym. comp |
|
||
the equation has to be solved for casym. comp, the parameter derived from the analysis of the peak integral:
casym. comp = 12 cES + 12 KD − cEL + cELcES + 14 c2ES + 12 cESKD + 14 KD.
(10.6)
The data fit is shown in Fig. 10.4 (right-hand side).
A value of 2 × 10⁻⁷ M is derived for KD, corresponding to a rather stable binding of the second GroES to GroEL. The analysis of the tangential behavior of the fit function allows one to determine the binding ratio of GroEL and GroES. The crossing point at a ratio of 1:2 indicates that no excess of GroES is necessary for the formation of the symmetric complex. It is interesting to note that during the expression of the chaperonins in the cell GroEL and GroES are expressed exactly in this ratio.
10 Structure and Kinetics of Proteins |
199 |
10.4.3 Chasing Experiments (Slow Kinetics)
An elegant way of employing the contrast matching technique is materialized in so-called “chasing” experiments. GP31 a protein found in the bacteriophage T4 [38], is able to substitute itself for GroES in bacteria and to bind in its place to one end of the GroEL cylinder. Despite a low sequence homology the two high-resolution crystal structures available for GP31 and GroES are rather similar. Like the co-chaperonin GroES, GP31 consists of seven identical subunits arranged in a ring. GP31 has a larger molecular weight (12 kDa; GroES 9 kDa), and the elongated flexible loops of GP31 could help to enlarge the refolding cavity after binding to the GroEL cylinder. The replacement of GroES by GP31 is maybe necessary for the folding of GP23, an important protein for the assembly of the T4 phage head that folds only in the presence of GP31 into its active conformation. In Fig. 10.8 a comparison of GroES and GP31 exhibits the di erent structures derived by high-resolution protein crystallography.
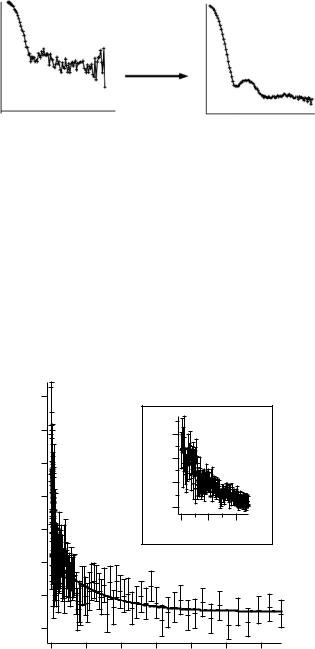
Chasing can be observed when an excess of partially deuterated GroES is added to GroEL that is prebound with GroES or GP31 in a bu er solution containing an excess of ADP and that matches the scattering-length density of the partially deuterated GroES, rendering the latter “invisible” (see Fig. 10.9). Varying the relative concentration of GroES and GP31 allows one to determine their binding constants, since the scattering intensity of the sample decreases with time, as the apparent scattering mass of the H-GroEL–D-GroES complex is lower than that of the initial H-GroEL–H-GroES or H-GroEL–H-GP31 [41].
The data can be fitted with a double-exponential revealing two di erent dissociation constants (see Fig. 10.9). For the fast reaction a value of 1.3 × 10⁻³ s−1 for the chasing of protonated GroES by deuterated GroES (control) and 4.9 × 10⁻⁴ s−1 for the corresponding GP31 experiment. The second constants were 2.3 × 10⁻⁵ s−1 for the chasing of GP31 by GroES and 3.9 × 10⁻⁵ s−1 for the control. The double exponential behavior indicates two di erent reaction mechanisms. First, in the fast reaction the real chasing of
Fig. 10.8. Crystal structures of GP31 (outer left) [39] from phage T4 in comparison with GroES (inner left) [40]. The “chasing” principle is shown at the right picture (see text)
200 M.W. Roessle et al.
p(r)*1000 (a.u.)
6
5
4
3
2
1
0
sqrt (I(0)) (a.u.)
0 |
50 |
100 |
150 |
200 |
|
|
r (Å) |
|
|
1.07
1.06
1.05
1.04
1.03
1.02
1.01
1
0 |
5 |
10 |
15 |
20 |
|
|
t/h |
|
|
Fig. 10.9. Pair-distance distribution function of protonated GroEL and protonated GP31 with partially deuterated GroES in 80% D2O (left), and data fitted with double-exponential (right)
bound GroES or GP31 by invisible GroES takes place. The already chased GroES or GP31 starts to compete with the invisible GroES. This competition slows down the apparent dissociation constant and can be described by a second exponential decay function. The di erent dissociation constants in the fast process indicate a higher stability of the GroEL –GP31 complex than the native GroEL –GroES assembly. GP31 is necessary for the folding of GP23, a special protein in the phage cycle one can argue that the higher stability of the GroEL –GP31 complex indicates an enhanced folding rate of the GP23 in the phage-infected bacteria. These higher stability and binding a nity are facilitated by the di erent binding sites of GP31 and GroES to the interface of GroEL.
10.4.4 Time Resolved Small-Angle Neutron Scattering
Since the advent of third-generation synchrotron sources (e.g., ESRF, APS, Spring 8) time resolved small-angle scattering (TR-SAS) was used successfully for solution scattering of biological macromolecules. In general, the time resolved small-angle scattering technique is not restricted to X-rays, but the limiting quantity is the flux of scattered particles. While third-generation synchrotron sources produce a flux of 5 × 10¹² ph s−1 (at λ = 1 ˚A), the SANS instrument D22 at the Institut Laue-Langevin in Grenoble, France, provides a neutron flux of 3 ×10⁷ s−1 cm−2 (λ = 8 ˚A, collimation length 4 m). The flux can be significantly higher if smaller proteins are to be examined, because then shorter collimation lengths and/or wavelengths can be used. Another di erence between TR-SAXS and TR-SANS is the size of the neutron and X-ray beams. The beam size at the SAXS beamline ID02 of the ESRF is 0.6 × 0.2 mm2 while the beam size of D22 is 55 × 40 mm2. For the optimal use of these neutron beam parameters a flat cell has to be employed, and the experiment has to be repeated several times.
|
|
10 |
Structure and Kinetics of Proteins |
201 |
|
A |
open to air |
B |
C |
open to air |
|
|
|
|
|
|
|
buffer |
|
buffer |
buffer |
|
|
reservoir |
reservoir |
reservoir |
|
||
|
|
|
vacuum |
vacuum |
|
|
|
|
pump |
pump |
|
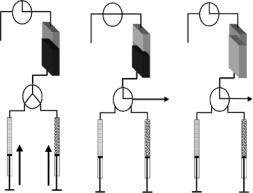
Fig. 10.10. Schematic design of a stopped flow apparatus for time resolved small angle neutron scattering: (A) mixing and filling step; (B) rinsing step with bu er/washing solution; (C) emptying of the cell for the next experiment
These special geometrical constrains of the TR-SANS approach have to be considered for the experimental setup. In Fig. 10.10 a schematic design of a stopped-flow apparatus is shown. It takes into account that – unlike the thin flow-through capillaries for X-ray scattering – the flat cell has to be emptied and rinsed after every experiment by separate steps. For proper rinsing two valves can be employed that allow first to empty the cell with a vacuum pump and second to switch to a washing step.
The rinsing and emptying steps ensure the same starting conditions for every new mixing experiment and do not use sample volume for emptying as used in TR-SAXS experiments where due to the use of thin flow-through capillaries the remaining sample is pulled out by next sample volume. However, in order to minimize the consumption of protein the exposure times of one time frame were restricted to a minimum of 1 s, and averaging over ten independent experiments led to su cient statistics of the scattering data (see Fig. 10.11).
Frequently, the large di erence in the scattering-length density between protonated and deuterated protein is used such that the scattering contribution of the protonated protein moiety in a complex is made equal to zero (at zero angle), while the deuterated protein is still (well) visible. Another option in TR-SANS is to enhance the signal for the protein–protein interaction by performing scattering experiments of H-protein and fully deuterated protein in 99% D2O bu er.
In this experiment, the protonated protein has a strong negative scattering contrast while the deuterated protein has a positive contribution [30]. The interference cross-term of the scattering in this case is also negative, so that the radius of gyration of the H-GroES–D-GroEL complex is smaller than that of a homogeneous (protonated or deuterated) GroEL–GroES complex.
202 M.W. Roessle et al.
I(q) a.u.
1
0.1
0.01
0.05 0.10 0.15 q (Å−1)
10 x averaged
|
4 |
|
|
3 |
|
|
2 |
|
|
1 |
|
a.u. |
7 |
|
4 |
||
|
6 |
|
|
5 |
|
) |
3 |
|
I(q |
||
2 |
0.1
7
6
5
4
0.05 0.10 0.15 q (Å−1)
Fig. 10.11. Neutron scattering intensities of a single experiment and the averaging over 10 independent experiments
The decrease of the Rg value with time can be used to follow the binding reaction of the two proteins. This stratagem is safer than following an increase of intensity that can also be due to aggregation. In Fig. 10.12 the time dependence of radius of gyration for the binding of H-GroES to D-GroEL in the presence of a high concentration (30 mM) of the nonhydrolysable ATP analogue AMP-PNP is shown. Under these conditions the symmetric GroES– GroEL–GroES complex is formed. The time progression can be fitted to a double exponential function, indicating the successive binding of the second GroES molecule to GroEL.
|
50 |
|
|
|
|
|
|
|
|
48 |
|
|
[Å] |
48 |
|
|
|
|
|
|
|
|
|
|
||
|
|
|
|
|
|
|
|
|
|
46 |
|
|
radiusofgyration |
44 |
|
|
|
gyration[Å] |
|
|
|
|
|
|
||
|
|
|
40 |
|
|
|
||
44 |
|
|
36 |
|
|
|
||
|
|
|
|
|
|
|||
|
|
|
|
|
|
|
||
of |
42 |
|
|
|
|
log time [s] |
|
|
radius |
|
|
|
|
|
|||
40 |
|
|
|
|
|
|
|
|
|
|
|
|
|
|
|
|
|
|
38 |
|
|
|
|
|
|
|
|
36 |
|
|
|
|
|
|
|
|
0 |
500 |
1000 |
1500 |
2000 |
2500 |
3000 |
|
|
|
|
|
time [s] |
|
|
||
Fig. 10.12. Time dependence of the radius of gyration for the formation of the symmetric GroEL–(GroES)2 complex [30]