

Neutron Scattering in Biology - Fitter Gutberlet and Katsaras
.pdf6 High-Angle Neutron Fiber Di raction |
91 |
Fig. 6.5. High-angle neutron fiber di raction patterns recorded from a sample of A-DNA as the water in the sample is exchanged by D2O (top left pure H2O to bottom right pure D2O). This set of pictures illustrates the consequences of hydrogen incoherent scattering and the major benefits of deuterium exchange
92 V.T. Forsyth et al.
"Strip" detector (4 wide)
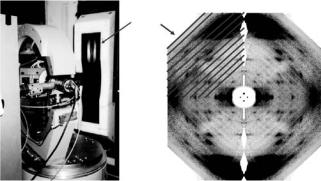
Fig. 6.6. Left: The D19 di ractometer, showing Eulerian cradle, sample environment, and position sensitive detector. Right: A neutron fiber di raction pattern recorded from DNA using the D19 di ractometer. Individual detector acquisitions are indicated on the pattern to illustrate how data from the di ractometer are mapped into a continuous reciprocal space image
been to construct a complete and continuous di raction pattern by mapping individually recorded data segments into reciprocal space. Figure 6.6 shows a neutron fiber di raction pattern recorded from a DNA sample and shows graphically how this is mapped from individual single detector acquisitions.
6.5 Nucleic Acids
DNA in its natural habit is a filamentous molecule, with a high degree of regularity over a large length scale. It has been known for decades that water is of critical importance in maintaining this regularity and furthermore that variation of hydration around DNA causes major conformation changes in the double helix. Natural, “mixed-sequence” DNA can be drawn into aligned fibers and has been shown to adopt three main conformations, which have been called A, B, and C. For synthetic DNA polymers containing repetitive base-pair sequences, two further conformations called D-DNA and Z-DNA can be observed. The Z conformation is the only one of these five major DNA conformations that has a left-handed helical sense. Given appropriate conditions of ionic strength, reversible transitions between these structures can be induced simply by varying the relative humidity of the sample environment. This structural polymorphism in DNA is summarized in Figs. 6.7 and 6.8.
The biological significance of these DNA structures is not fully understood. However, it would be surprising if the ability of DNA to adopt these markedly di erent structures were not exploited in biological function. Further support for the biological significance of these structures comes from studies that confirm the presence of the B and the Z forms of DNA in vivo and that change to the Z form causes a number of functionally significant e ects [20–24]. A variety
6 High-Angle Neutron Fiber Di raction |
93 |
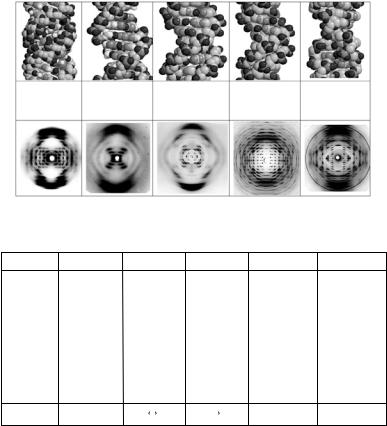
A-DNA |
B-DNA |
C-DNA |
D-DNA |
Z-DNA |
Right-handed |
Right-handed |
Right-handed |
Right-handed |
Right-handed |
11 base-pairs/turn |
10 base-pairs/turn |
9.3 base-pairs/turn |
8 base-pairs/turn |
12 base-pairs/turn |
pitch=28.2 A |
pitch=34 A |
pitch=31 A |
pitch=24.2 A |
pitch=43 A |
Fig. 6.7. The five major conformations of DNA, their helix parameters and their X-ray fiber di raction patterns
NATURAL |
ALTERNATING |
ALTERNATING |
ALTERNATING HOMOPOLYMER HOMOPOLYMER |
||
DNA |
A-T |
G-C |
G-m5C |
G-C |
A-T |
A-T
T-A
A-T
"Random" T-A sequence A-T T-A A-T T-A A-T T-A
C 
 A
A 
 B D
B D
 B
B
G-C |
G − m5C |
||||
C-G |
m5C - G |
||||
G-C |
G − m5C |
||||
C-G |
m5C - G |
||||
G-C |
G − m5C |
||||
C-G |
m5C - G |
||||
G-C |
G − m5C |
||||
C-G |
m5C - G |
||||
G-C |
G − m5C |
||||
C-G |
m5C - G |
||||
Z |
|
B |
A |
|
Z |
|
|
||||
G-C |
A-T |
G-C |
A-T |
G-C |
A-T |
G-C |
A-T |
G-C |
A-T |
G-C |
A-T |
G-C |
A-T |
G-C |
A-T |
G-C |
A-T |
G-C |
A-T |
AB
Fig. 6.8. Summary of the structures adopted by various DNA sequences. The middle section of the diagram shows the sequence repeat in the DNA. The lower section shows the structures adopted and the transitions that occur
of proteins that bind to B, Z, A, and D type conformations have been identified [25–28], and there is a substantial amount of work that implicates a number of repetitive DNA sequences in regulatory processes. Whatever the biological importance of these structures, there is clearly great interest in understanding structural aspects relating to their stability as well as those that mediate transitions between them. In this respect, X-ray and neutron fiber methods have genuinely complementary roles. Modern synchrotron X-ray sources have su cient flux to allow the study of DNA structural transitions in real time. As a good examples of this Fig. 6.9 shows the D↔B transition in synthetic DNA having a regular alternating adenine-thymine (A-T) repeat. The transition, first described by Mahendrasingam et al. [29] and Forsyth et al. [30] occurs through a stereochemical pathway in which the pitch of the DNA changes from the 24 ˚A characteristic of the D conformation to the
94 V.T. Forsyth et al.
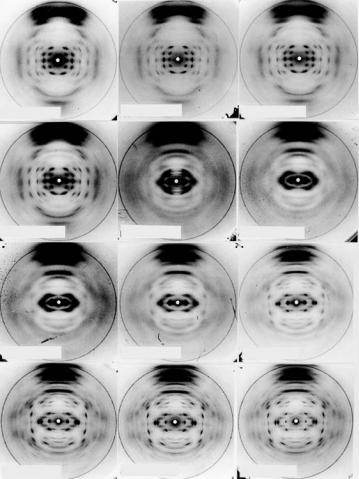
(a) RH=51.4% |
(b) RH=54.8% |
(c) RH=80.0% |
(d) RH=83.2% |
(e) RH=85.4% |
(f) RH=86.8% |
(g) RH=89.5% |
(h) RH=92.9% |
Fig. 6.9. Selected X-ray fiber di raction patterns recorded during the water driven transition between the D and the B conformations of DNA. The data were recorded at the Daresbury SRS
34 ˚A characteristic of B-DNA. Figure 6.10 shows a further example involving the A–Z transition in an alternating G-C sequence in which the cytosine residues are methylated at the 5 position. More recent work on the transition between the A and the B forms is in progress [31].
The examples given above illustrate two aspects of DNA structure that may be important in biological function. First they illustrate cooperativity in DNA polymorphism – both transitions occur through a process during which substantial regions of the samples change in a highly cooperative way. Second, both transitions further emphasize the critical role that water plays in determining DNA structure and therefore the importance of establishing the location of water around each DNA structure and also during structural changes. X-ray di raction studies have provided high-resolution information on hydration around the A, B, and Z conformations in oligonucleotide single crystals, with particular emphasis on local sequence dependence variation. In contrast, neutron fiber di raction provides information on hydration at lower resolution (typically about 3 ˚A) but which relates to the regularity and cooperative properties of the long polymer molecule. The two methods therefore provide highly complementary information.
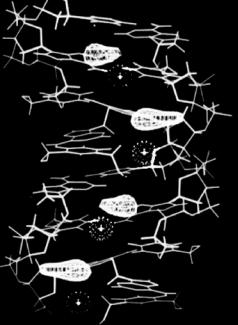
The first neutron di raction experiments on DNA fibers were carried out on D-DNA [8, 9] at the Institut Laue Langevin in Grenoble, France. These experiments demonstrated the power of isotopic replacement of light by heavy water and allowed Fourier synthesis methods to be used to image the location of water around the D form of the DNA double helix (Fig. 6.11). Of particular significance in this work was the presence of water in the minor groove and its relationship to stabilizing cations that had been located by X-ray di raction studies of isomorphous derivatives of D-DNA.
Similar work to that described for the D conformation of DNA has been carried out on the A and the B conformations [10, 32–34]. In the first study
6 High-Angle Neutron Fiber Di raction |
95 |
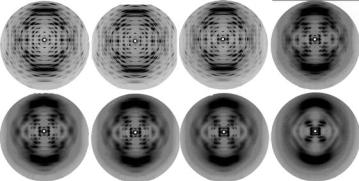
(a) 66% RH |
(b)75% RH |
(c) 86% RH |
(d) 92% RH |
(e) 98% RH |
(f ) 100% RH |
(g) 98% RH |
(h) 92% RH |
(i) 86% RH |
(j) 75% RH |
(k) 66% RH |
(l) 44% RH |
Fig. 6.10. Di raction patterns recorded during the transition between the A and the Z conformations of the DNA polymer poly [d(G-m5C)]
of A-DNA, hydrogenated material was used. The Fourier maps obtained showed a number of features that had been observed in previous X-ray di raction studies of oligonucleotide single crystal – most notably water molecules located between successive phosphate oxygen atoms along the major groove (see Fig. 6.12).
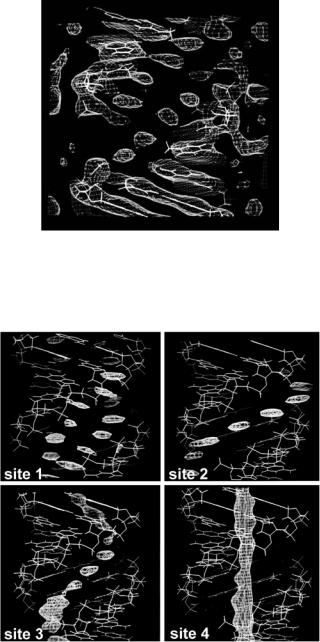
In later studies, more detail was provided by Shotton et al. [35] who used perdeuterated DNA to study hydration in A-DNA. The DNA was obtained from E. coli cells grown in D2O with a deuterated carbon source. Figure 6.13 summarizes the main results from this study. Four main sites were located:
96 V.T. Forsyth et al.
Fig. 6.11. Di erence Fourier synthesis map showing the distribution of ordered water in the minor groove of the D conformation of DNA, and the relationship between these features and cation positions located in the groove through the use of heavy atoms derivatives of D-DNA in X-ray fiber di raction studies
(a) a site located in the major groove at equal distances from neighboring phosphate oxygen atoms. This site was noted previously in the neutron study of hydrogenated A-DNA; (b) a site located at the opening of the major groove at equal distances from phosphates on either strand; (c) a site also located at the center of the major groove, but at a smaller radius; (d) a feature running down the “hollow” center of the molecule within possible hydrogen bonding distance to base edge atoms. This feature could not be completely interpreted as a result of the sequence averaging of the base pairs.
The structure of A-DNA is such that the base-pairs are displaced some 5 ˚A from the helix axis, creating a molecule which has a clear central hole when viewed along the length of the molecule. The central column of water described above and seen in Fig. 6.13d is located within this hole. Its apparent continuity and close relationship with the DNA was described by Shotton et al. [32]. It is clear that this column of hydration would have to be broken during a transition to the B form, where the base-pairs are located centrally on the helix axis. Fuller et al. [36] have suggested that the column may be significant in understanding the hydration-driven transition between the A
6 High-Angle Neutron Fiber Di raction |
97 |
Fig. 6.12. A 2Fo − Fc Fourier map of the A conformation of DNA showing a string of water molecules along the major groove, bridging phosphate oxygen atoms
(a) |
(b) |
(c) |
(d) |
Fig. 6.13. The results of neutron fiber di raction analysis showing the four ordered water sites in A-DNA [35]
98 V.T. Forsyth et al.
and the B forms of the double helix, and that its continuity in A-DNA and disruption in B-DNA may be related to the cooperativity observed in the transition.
6.6 Cellulose
Cellulose exists in a number of di erent forms depending on its origin and on the way in which it is treated. During the last few years a number of studies have been published in which X-ray fiber di raction data have been combined with neutron fiber di raction data collected on instrument D19 at the ILL to yield novel information that in all likelihood would never have been derived using X-ray di raction alone. The significance of these studies has recently been summarized by Jarvis [37], who while noting the basic simplicity of cellulose, also emphasizes the importance of hitherto unsolved questions relating to the side-by-side packing of the molecules in their di erent forms – packing e ects where hydrogen-bonding is of key importance. In all of the recent fiber di raction work carried out, X-ray data, typically to atomic resolution, has been recorded and used to determine the location of the “non-hydrogen” atoms in the cellulose structure. However, even at this resolution these workers were not able to determine hydrogen atom positions from their electron density maps [38], and used neutron fiber di raction data to study hydrogen bonding interactions in these structures. The first study using this approach was that of cellulose II, where Langan et al. [39] were able to discriminate between two competing models and to unambiguously determine the hydrogen bonding network in this structure. Figure 6.14 shows a 2Fo − Fc Fourier synthesis map in which the observed amplitudes were measured from cellulose II samples in which the OH groups had been replaced by OD through a process of mercerization with NaOD.
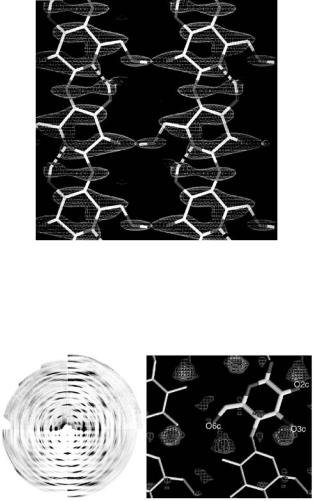
In later studies, the same group of workers carried out detailed analyses of the cellulose Iβ [40], and cellulose Iα [41] using high resolution X-ray and neutron fiber di raction data. The neutron analyzes were critical in establishing the nature of the hydrogen bonding in each structure and in attempting to understand the conversion between the two forms. Figure 6.15a shows the neutron fiber di raction patterns recorded both from a normal hydrogenated sample of cellulose Iβ (yielding structure factor amplitudes Fh) and from an analogous sample in which the OH groups had all been replaced by OD (yielding structure factor amplitudes Fd). Figure 6.15b shows a di erence Fourier map computed from these data using coe cients (Fd − Fh), with phases calculated from the best X-ray refined model for the carbon and oxygen atom positions.
These results, combined with the synchrotron X-ray results, define the structure of all atoms including hydrogen, at atomic resolution. They highlight the well-defined nature of the intramolecular O3,. . .,O5 hydrogen bonding, and show that the hydrogen bonding involving the O2 and O6 atoms is disordered, imparting some stability to the sheet structure of cellulose Iβ .
6 High-Angle Neutron Fiber Di raction |
99 |
Fig. 6.14. 2Fo − Fc Fourier synthesis map in which observed amplitudes (Fo) were extracted from neutron data recorded from deuterated cellulose (mercerized with NaOD). This density map illustrates the presence of a network of hydrogen bonds that is di erent from that inferred by previous X-ray di raction work (see Langan et al. [39])
(a) |
(b) |
Fig. 6.15. (a) High-angle neutron fiber di raction patterns recorded from cellulose Iβ using the D19 di ractometer. The image is split into four quadrants - the left ones relating to the hydrogenated cellulose and the right ones relating to the deuterated cellulose. In each case the corresponding quadrants on the bottom show simulations of the fitted intensities. The meridian (fiber axis) is vertical. (b) Section of the (Fd − Fh) di erence Fourier map, showing the position of the deuterium atoms associated with the O3, O2, and O6 (see Figs. 6.4 and 6.5 in Nishiyama et al. [40])
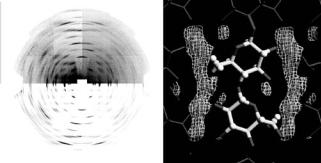
Neutron results from the analogous study of cellulose Iα are shown in Fig. 6.16. Again, two highly aligned and crystalline samples were produced, one hydrogenated, and one deuterated. The neutron data were again recorded using the D19 di ractometer at the ILL (Fig. 6.16a). The analysis followed
100 |
V.T. Forsyth et al. |
|
|
(a) |
(b) |
|
OD |
OH |
Fig. 6.16. (a) High-angle neutron fiber di raction patterns recorded from cellulose Iα using the D19 di ractometer. As with Fig. 6.15a, the image is split into four quadrants, the left ones relating to the hydrogenated cellulose and the right ones relating to the deuterated cellulose, with the corresponding quadrants on the bottom show simulations of the fitted intensities. (b) Section through the (Fd −Fh) di erence Fourier map, showing the position of the deuterium atoms associated with the O3, O2, and O6 (see Figs. 6.4 and 6.5in Nishiyama et al. [41])
essentially the same procedure as described for cellulose Iα, with di erence Fourier maps calculated using the coe cients (Fd − Fh) and phases derived from the best X-ray refined model. Figure 6.16a shows an (Fd −Fh) di erence Fourier map for the Iα structure.
The neutron analysis of cellulose Iα shows, as for the Iβ structure, that the O3,. . .,O5 hydrogen bond is single and well-defined, and that the hydrogen atoms associated with the O2 and O6 atoms are found in a number of partially occupied positions, with occupancies that are notably di erent in the two forms.
These definitive models for cellulose Iα and Iβ and their hydrogen bonding networks have shed light on a number of issues relating to the stability of cellulose and likely pathway followed in converting from one to the other. In each structure the hydrogen bonding within the individual chains has been confirmed, and new information on the way in which inter-chain interactions occur has been revealed. As noted by Jarvis [37], these studies also describe a packing configuration that implies the involvement of an ordered arrangement of weak C −H, . . .,O hydrogen bonds between sheets of cellulose chains. Along with hydrophobic interactions between sheets, this may explain the nature of sheet stacking in cellulose. This type of combined X-ray and neutron approach has also recently been applied to cellulose IIII [42].
6.7 Conclusions and Future Prospects
The work reviewed in this chapter illustrates the genuine complementarity of X-ray and neutron di raction methods in the study of biological systems.