

Neutron Scattering in Biology - Fitter Gutberlet and Katsaras
.pdf244 C.F. Majkrzak et al.
lateral homogeneities much greater than the neutron coherence length, then the much shorter wavelength neutron beam can “see” it too. However, a film
may appear visibly homogeneous while still behaving as if coh |
<< |
xy |
and |
xy |
|
|
|
thus acting as an inhomogeneous collection of reflectors. |
|
|
|
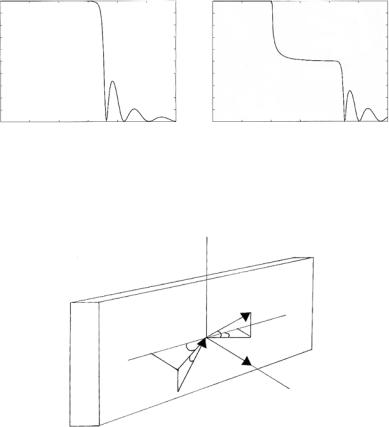
Now consider the specific case in which regions of two di erent SLDs are distributed within the plane of the film as shown in Fig. 12.10a, b. If the linear dimensions of the area of either SLD is much smaller than the in-plane projection of the neutron coherence length, as schematically represented by the straight line in Fig. 12.10a, then the neutron wave e ectively averages over the SLDs of the two regions; i.e., the measured specular reflectivity is that for the areally weighted average, as plotted in Fig. 12.11a. However, if the linear dimensions of either SLD component are much larger than the in-plane coherence length, the measured reflectivity is the incoherent sum of two areally weighted reflectivities, as in Eq. 12.20, each corresponding to one region of SLD, as plotted in Fig. 12.11b (assuming equal weightings). This suggests that use of samples with known in-plane SLD distributions, such as might be fabricated by lithographic techniques, could be used to infer neutron coherence lengths independently, to some degree, of the incoherent instrumental resolution.
12.3.4 Q-Resolution for Specular Reflectivity, Assuming an Incoherent Beam
It is instructive and practical to consider the common situation where the wave packets are well approximated by ideal plane waves (wave packets having a very narrow distribution of wavevectors), so that resolution in fact is dominated by an incoherent distribution of mean wavevectors. The instrumental Q-resolution for specular reflection is then determined by applying the simple laws of geometrical optics for reflection and refraction to the reflecting guide, the mosaic crystal monochromator (for which Bragg’s law is also imposed), the pair of slits preceding the sample, and the surface of the sample itself (since the flatness of the sample also a ects the measured value of Q).
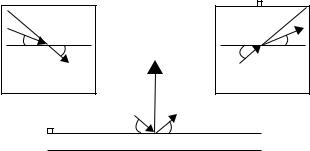
Figure 12.12 resolves the incident and reflected wavevectors, ki and kf , respectively, into their rectangular components. From the diagram we can write
(a)
Coherencelength
(b) |
Coherencelength |
|
small-scale heterogeneity laterally averages SLD profile |
large-scale heterogeneity laterally averages reflectivity |
||
|
|
|
|
Fig. 12.10. Schematic representation of neutron coherence length and in-plane dimensions of homogeneous sample areas
12 Membranes in Biology by Neutron Reflectometry |
245 |
(a)
Reflectivity
1 |
|
|
|
|
|
|
(b) |
|
|
|
|
|
Qc |
|
|
0.9 |
|
|
|
|
|
|
|
0.8 |
|
|
|
|
|
|
|
0.7 |
|
|
|
|
|
|
|
0.6 |
|
|
|
|
|
|
|
0.5 |
|
|
|
|
|
|
|
0.4 |
|
|
|
|
|
|
|
0.3 |
|
|
|
|
|
|
|
0.2 |
|
|
|
|
|
|
|
0.1 |
|
|
|
|
|
|
|
0 |
0 |
0.005 |
0.01 |
0.015 |
0.02 |
0.025 |
0.03 |
Q (Å−1)
Reflectivity
1
0.9
0.8
0.7
0.6
0.5
0.4
0.3
0.2
0.1
00
Qc2
Qc1
0.005 |
0.01 |
0.015 |
0.02 |
0.025 |
0.03 |
Q (Å−1)
Fig. 12.11. Specular reflectivity: (a) corresponding to picture in Fig. 12.10a; and (b) corresponding to picture in Fig. 12.10b. It is assumed that the two di erent SLDs cover equal areas in both cases
y
|
|
|
|
|
|
a |
|
kf |
X |
|
f |
|
|
|
q |
|
|
|
|
|
|
|
|
|
i |
q |
|
|
|
|
f |
|
|
|
|
a |
|
|
|
|
|
|
|
|
|
i |
|
|
|
|
|
Z |
||
|
Q = k |
− k |
i |
|
|
f |
|
||
ki
Fig. 12.12. Incident and reflected neutron wavevectors resolved into their respective rectangular components
kµx = k cos αµ cos θµ, |
|
kµy = k sin αµ, |
(12.21) |
kµz = k cos αµ sin θµ, |
|
where µ = i, f and k = 2π/λ. For specular reflection θi = θf , and, given that α typically is at most a few degrees, the expression for Q (i.e., Q = −Qz = ki−kf , as defined in Sect. 12.1) reduces, to a good approximation, to the familiar
Q = 2k sin θ . |
(12.22) |
In terms of wavelength λ and the grazing angle θ, the fractional uncertainty in Q then is
δQ |
= |
δλ |
+ |
|
δθ |
, |
(12.23) |
||
|
|
|
|
|
|
||||
Q |
|
|
λ |
tan θ |
|||||
|
|
|
|
|
|||||

246 C.F. Majkrzak et al.
which, for the typically small angles in reflectivity experiments, is approximately
δQ |
≈ |
δλ |
+ |
δθ |
, |
(12.24) |
||
|
|
|
|
|
||||
Q |
λ |
|
θ |
|||||
since tan θ ≈ sin θ ≈ θ. As mentioned earlier, the angular divergences of the beam impinging on the monochromator crystal and the monochromator’s mosaic distribution are normally significantly greater than the divergence defined by the slits which determine δθ. In this case, the fractional wavelength uncertainty is nearly independent of θ, and the two contributions to the fractional uncertainty in Q can be taken to be independent, so that
δQ |
≈ |
δλ |
|
2 |
+ |
δθ |
|
2 |
(12.25) |
|
|
|
|
|
|
. |
|||||
Q |
λ |
|
θ |
|||||||
Usually in specular reflectivity measurements, the slits preceding the sample are opened proportionally with θ, once the sample has fully intercepted the entire width of the incident beam, so that δQ/Q (as well as the “footprint” of the beam on the sample) remain approximately constant with θ and Q (in the small angle approximation). A typical value of δQ/Q is 0.025.
12.3.5 Measurement of the Reflectivity
To obtain the specular reflectivity, the reflected intensity is first measured as a function of wavevector Q – at a continuous source, by varying the incident angle θ at fixed wavelength and using Eq. 12.22 – up to a maximum value Qmax at which the signal to noise ratio S/N becomes prohibitively low. Background from incoherent scattering within the sample, substrate, or surrounding media, as well as from external sources must be measured and then subtracted from the measured reflected intensity. The resultant signal next must be divided by the incident beam intensity (which is also a function of θ if the slits are opened with increasing reflection angle). Corrections to the reflectivity spectrum also must be applied at values of Q below which the sample does not fully intercept the width of the incident beam (the so-called “footprint” correction). Finally, at least in principle, the instrumental resolution function needs to be deconvolved from the measured reflectivity data, when the resolution correction is significant enough to warrant it. However, in practice deconvolution is a mathematically problematic operation on finite data sets. In the following sections, some of the practical aspects of data reduction are discussed.
Sample Alignment
In order to obtain quantitatively accurate reflectivity data, proper sample alignment is essential. The procedure for accomplishing this is straightforward
12 Membranes in Biology by Neutron Reflectometry |
247 |
but can be complicated by substrates deformed from perfect flatness. The goal is to align the sample surface such that it is parallel to and bisects the width of the incident beam, viewed as a ribbon. (It is presumed that the centers of the beam and sample surface coincide.) A rough orientation of the sample can be obtained optically by translating the reflecting surface close to the center of the beam defined by the slit apertures and rotating the sample to be parallel with the beam. Any angular tilt of the sample away from vertical, about the horizontal axis of the incident beam, can be eliminated either using a laser beam reference or even a mechanical plumb line.
Then, the detector can be set at zero scattering angle (for specular reflection, the detector is always positioned at a scattering angle twice the reflection angle of the beam relative to the sample surface) with the pair of slits preceding the sample set so that the horizontal divergence is relatively tight, of the order of a minute of arc. The slit immediately following the sample can be set wide enough to accept the entire divergent width of the beam, but the last slit before the detector should be set to a width comparable to that of the first two slits in order to be sensitive to rotations of the sample. The sample is then translated across the incident beam in a scan in which the transmitted intensity is measured at each step. Once the translational position of the interface is located the sample is rotated in θ at this position with the detector still at zero scattering angle. The occurrence of a central peak corresponds to the position of the sample face being approximately parallel to the incident beam; regions of minimum intensity on either side correspond to the incident beam being reflected by the surface of the sample at a finite scattering angle (and, therefore, away from the detector which is at zero scattering angle). The twostep procedure just described can be repeated iteratively until convergence.
With the nominal zero of the sample angle θ defined, the sample can be rotated to a finite angle corresponding to a Q of 0.005 ˚A−1 (θ ≈ 0.1o for λ = 4.75 ˚A) with the detector at twice that angle (slit apertures unchanged). Now a sequence of three scans can be performed: a rotation of the sample in theta (about the vertical axis through the sample surface), referred to as a “rocking” curve; a translation of the sample through the incident beam; an angular tilt of the sample about a horizontal axis through the center of the sample surface. This sequence of scans is performed iteratively until convergence of the sample rotation (to a peak position in θ that occurs at half the scattering angle), translation, and tilt angle are each achieved. This process can also be carried out at negative reflection and scattering angles, which corresponds to the beam being incident from within the substrate (which is possible for the case of a single crystal Si substrate which is highly transparent to neutrons). Although no critical angle for total reflection may exist in going from the denser (Si) medium to air for certain films on the surface, the reflectivity is typically high enough.
A flat sample surface should result in a smoothly shaped rocking scan curve resembling a Gaussian with a FWHM close in value to the angular divergence defined by the pair of slits upstream. Any significant deviation
248 C.F. Majkrzak et al.
from this (assuming that the tilt was properly optimized), especially manifest as asymmetric or multiple peak shapes, is indicative of a non-flat sample surface. As already discussed, a non-flat surface results in a broadened Q- resolution which must be accounted for. If the broadening is acceptable, in terms of resolution, precaution must still be taken that the slits downstream of the sample open su ciently to fully accept the increased divergence of the specularly reflected beam on its path to the detector. This can be accomplished in a straightforward manner by measuring the reflected intensity at a given θ as a function of slit opening until a plateau is achieved. If a critical angle exists for the sample being examined, also a longitudinal scan (i.e., the specular θ– 2θ scan) can be performed. If the sample is long enough, a plateau is reached below the critical angle, where the reflectivity is practically unity.
Geometrical Beam Footprint Correction
If the sample is not long enough to fully intercept the width of the incident beam, at lower reflection angles, then a decreased reflectivity is measured. If the sample has a critical angle, θc, above the point at which the surface intercepts the full width of the incident beam, then the correction below that point is trivial; the reflectivity simply is defined as unity for 0 < θ ≤ θc. However, if a critical angle is too small or nonexistent, then another sample of the same size, but with a critical angle that lies above the point of full interception, can be measured under identical conditions to obtain the proper geometrical scaling as a function of glancing angle. However, if the sample is not flat enough, an accurate footprint correction may not be achievable.
12.3.6 Sample Cell designs
Material Fronting Medium and Beam “Side” Entry
Taking advantage of the near transparency to neutrons of Si, sapphire, or quartz single crystals, the reflectivity of films deposited on such substrates can be measured with a beam incident upon the film from within the substrate. This makes it possible for a film of interest to be in contact with a neutron-attenuating aqueous reservoir or other fluid medium, as shown in the following subsection on cell design. In practice, incidence from within a substrate typically requires the beam to enter through a surface of the substrate perpendicular to the film, i.e., through a side of the crystal, as shown in Fig. 12.13. The beam incident from vacuum on the left enters the fronting medium (single crystalline Si, for example) through a face which is perpendicular to the plane of the film. The regions about the side boundary face and the film surface (schematically indicated in the figure by the rectangular perimeters in the figure) are assumed to be su ciently separated that the neutron wave packet does not interact with both interfaces simultaneously.
|
12 Membranes in Biology by Neutron Reflectometry |
249 |
||||||
|
|
|
|
|
|
|
|
|
k |
|
Fronting |
|
q |
k |
|
||
q |
|
|
||||||
M |
|
|
|
|
|
|
M |
|
q |
|
Q |
|
Z |
|
|
q |
|
|
|
|
|
|
||||
|
|
|
|
|
|
|||
M |
|
|
|
|
|
M |
|
|
|
|
ki |
kf |
|
|
|
||
Vacuum |
|
q |
q |
|
Vacuum |
|
||
|
|
|
|
|
||||
|
|
Film |
|
|
|
|
||
|
|
|
|
|
|
|
|
|
|
|
Backing |
|
|
|
|
||
|
|
|
|
|
|
|
|
|
Fig. 12.13. Side-entry geometry typically employed in the case of a beam incident through material (non-vacuum fronting)
As described in Sect. 12.1, for vacuum fronting, the value of the wavevector transfer 2kz in specular reflection, as measured in the laboratory, satisfies
2kz = |kf − ki| = 2kM sin θM = 2k0z = Q . |
(12.26) |
Here the subscript M denotes quantities measured on the instrument in the laboratory, as indicated in Fig. 12.13 (since, for vacuum, there is no side interface to cross through). On the other hand, for nonvacuum fronting, a refractive bending occurs as the neutron crosses the side boundary, which, from Snell’s law, is
sin θM = nf sin θ, |
(12.27) |
where nf is the refractive index of the fronting medium
|
|
|
|
|
|
|
|
− kM2 |
|
||||
nf = 1 |
|
4πρf |
, |
(12.28) |
||
|
|
|||||
where ρf = ρI. The index of refraction is not to be confused with nIz , defined in Eq. 12.4. Using Eq. 12.27, the value of kz inside the fronting medium then is
kz = k sin θ = kMnf |
sin θM |
= kM sin θM . |
(12.29) |
|
|||
|
nf |
|
|
The value of kz in the fronting is the value kMz measured on the instrument by measuring θM and by computing kM = 2π/λ. However, according to the 1D description in Eq. 12.1, for a given k0z , the wavevector incident on the film is kI of Eq. 12.4, as if side entry of the incident beam had not occurred. Therefore, to adapt Eq. 12.1 to side entry, its wavevector parameter k0z , or the corresponding Q, must be identified in terms of the measured kz , as given in Eq. 12.29. With Eqs. 12.4 and 12.29
250 C.F. Majkrzak et al.
|
|
|
|
|
|
|
2π sin θM |
|
|
||
kzI = k02z − 4πρf = |
, |
|
|||||||||
|
|
λ |
|
||||||||
so that, solving for k0z , |
|
|
|
|
|
|
|
||||
|
|
|
|
|
|
|
|
|
|
||
Q = 2k0z = |
|
sin θ |
2 |
|
|
||||||
4π |
M |
+ 16πρf . |
|||||||||
|
|||||||||||
|
λ |
|
|||||||||
(12.30)
(12.31)
Therefore, for nonvacuum fronting and with side entry, in comparing the reflectivity measured at an angle θM to a reflectivity calculated for a model SLD profile, the value of Q at which the theoretical expression for r(Q) (or |r(Q)|2) must be computed is given by Eq. 12.31.
Sample Cell Designs with Liquid Reservoirs
In the study of biomimetic films, it is often required that the film be in contact with an aqueous reservoir. As already discussed, the high transparency of neutrons through single crystalline materials such as Si, Al2O3, and SiO2 make it possible to construct fluid cells in which the single crystal serves both as substrate and fronting medium for the neutron beam. In principle, the design of a fluid cell is straightforward but, as is discussed in the following section, contributions to the background from the media surrounding the film can be the predominant factor which limits the maximum Q at which the reflectivity can be measured and consequently, the spatial resolution of the SLD depth profile.
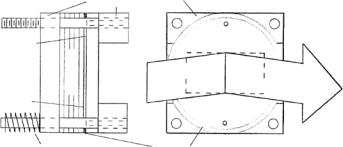
Figure 12.14 shows face and end-on views of a liquid cell that has evolved as a standard piece of equipment for reflectivity measurements. The single crystal fronting and backing are assembled from 7.62 cm diameter discs of various thicknesses. Under the correct conditions, such a cell, in which the incident, transmitted, and reflected neutron beams in the vicinity of the sample are entirely within the single crystal media, typically allows maximum Q in the range Qmax ≈ 0.3 ˚A to Qmax ≈ 0.4 ˚A. The single crystal discs are normally polished on one side. The thickness of the reservoir next to the film is defined
|
aluminum support |
|
reservoir |
outlet |
|
silicon |
||
sapphire |
|
incident beam |
film |
inlet |
|
|
compression spring |
gasket |
|
reflected beam
Fig. 12.14. Schematic views, face-on and end-on, of fluid reservoir cell used in neutron reflectivity measurements as described in detail in the text
12 Membranes in Biology by Neutron Reflectometry |
251 |
by an annular gasket (e.g., nitrile or other similarly impervious material). This dimension can be as small as about 25 m without any significant e ect on the measured film reflectivity from the face of the backing crystal, but for reservoirs that are too thin, the possibility of coherent contributions from the face of the backing crystal needs to be considered. Fluid is introduced through a hole (e.g., ultrasonically drilled through the single crystal Si or Al2O3 and of diameter 1–2 mm) near the bottom of the backing disc; a similar hole diametrically opposed at the top of the disc serves as an outlet. A cylindrical “top hat” made of aluminum can be placed around the sample and the volume surrounding the cell filled with argon gas, which scatters neutrons significantly less than air. Brass or copper heating/cooling blocks can be attached to the aluminum cell frame at top and bottom. Temperature control (over a range from about −10◦C to 80◦C) can be maintained by a combination of fluid flow through the blocks and electrical resistance heater cartridges.
It is di cult to overemphasize the importance of using substrates that have been polished smooth and flat and of maintaining flatness in the compressed sandwich of the cell. A root mean square (RMS) roughness about 3–5 ˚A is obtainable and desirable since this ultimately limits the spatial resolution in the measured SLD depth profile. Flatness, on the other hand, as commonly used, is associated with in-plane areas comparable to or greater than the coherence length (of order micrometers); the normals to these areas should not deviate more than about 0.01o from the nominal direction. As discussed earlier, deviations from perfect flatness also degrade the e ective instrumental Q-resolution for specular reflection measurements.
For a lipid bilayer on a Au film (thickness ≈100 ˚A) deposited on a 0.5 mm thick Si substrate and placed next to a D2O reservoir of thickness ≈25 m (in this case defined by a gasket and another 0.5 mm Si crystal as backing), specular neutron reflectivities have been measured for Qmax = 0.73 ˚A−1 [40].
If the sample film can be exposed to a humid atmosphere instead of an aqueous reservoir (e.g., water vapor in Ar), then it is advantageous for reduction of background to deposit the film of interest on a thin (e.g., 0.5 mm) single crystalline substrate. The humidity can be controlled either by saturated salt solutions or mechanical humidity generators.
12.3.7 Sources of Background
Normally, a single lipid bilayer membrane is itself a negligible source of incoherent scattering background. For a well-shielded instrument, external sources of background can also be relatively insignificant. The major contribution to the background in a specular reflectivity measurement most often originates in the media surrounding the film which is exposed to an incident beam that can be relatively intense at larger Q-values, where the slits are opened wide. For polycrystalline substrates, even though the wavelengths are often long enough that no Bragg scattering can occur (e.g., aluminum at λ = 5.0 ˚A), small angle scattering from the crystal grains, as well as incoherent and inelastic scattering, can contribute. Single crystalline substrates can produce
252 C.F. Majkrzak et al.
a significant amount of incoherent and inelastic scattering, as well, but are usually preferred to polycrystalline or amorphous (e.g., glass) materials. If the substrate contains a neutron absorber, e.g., boron in pyrex glass, the scattering that contributes to the background can be reduced, although the presence of significant absorption requires that the substrate be used only as a backing medium and that an imaginary component of the scattering length density for the substrate be taken into account in the analysis of the measured reflectivity. In any event, one way to judge the potential of a substrate for producing background, absent absorption, is to measure its transmission. Away from the critical angle, specular reflection falls rapidly with Q, at least as fast as Q−4 at large Q. Thus, at large Q, most of the beam should be transmitted through the backing with a transmission close to unity. Measuring a reduced value of the transmission, say, about 0.85 for a Si single crystal substrate 7.5 cm thick, implies that a substantial number of non-reflected neutrons are scattered elsewhere, some fraction of which enter the detector as background.
In addition to substrates, an aqueous reservoir adjacent to the sample film can also contribute a substantial amount of incoherent background, especially if it contains H2O . Where possible, it is advantageous to use D2O in place of ordinary water and to minimize the reservoir thickness. Note that single scattering of a neutron from a hydrogen nucleus is most often an incoherent event, resulting in an angularly isotropic distribution of scattered radiation.
Even when it is possible to use a thin single crystalline substrate, the air surrounding the sample which is intercepted by the incident and transmitted beams and simultaneously viewed by the detector can be a substantial source of background. This background can be eliminated by placing the sample in an evacuated chamber or by replacing the air with He or Ar gas, which scatter significantly less than nitrogen and oxygen.
Background Measurement
To measure the background at a given Q, the detector angle 2θ is set close to the specular condition but o set far enough to miss the specular signal. The amount of o set for given slit openings and beam width can be determined by performing a transverse scan along a direction perpendicular to the film normal (z-axis) and with the horizontal width of the aperture in front of the detector su ciently tight; a rocking curve is normally a satisfactory approximation. Note, in particular, that non-specular reflection is not background, which is more or less isotropic, but is scattering from in-plane variations in SLD in the sample. As discussed earlier, the observation of significant non-specular scattering requires proper evaluation of the validity of the use of the one-dimensional specular scattering theory. Figure 12.15 is a plot of intensity vs. rocking angle θ at a fixed scattering angle for a metallic Ni/Ti multilayered sample having a relatively large number of interfaces with roughnesses

12 Membranes in Biology by Neutron Reflectometry |
253 |
(Counts/6min)
10
log
4
2
0 |
|
|
|
0.0 |
0.5 |
1.0 |
1.5 |
q (2q=1.5)
Fig. 12.15. Plot of intensity vs. rocking angle (θ) at a fixed scattering angle for a multilayer Ni/Ti sample with significant in-plane SLD variations, as described in the text
that could be correlated from one layer to another, thereby manifesting some degree of three-dimensional order.
Background Suppression
In our discussion above, we already mentioned that background can be suppressed by using thin single crystal substrates to support the film and to replace the surrounding air with vacuum, He, or Ar gas. It was also mentioned how the pair of slits downstream of the sample have no e ect on the specular reflectivity measured from a flat sample. Instead, the slits following the sample act to discriminate the specular-reflected signal from scattering having a wider angular divergence. However, it can happen that the distance between the two slits which define the incident beam angular divergence is greater than that for the pair of slits which precede the detector. In such a case, opening the slits after the sample just enough to allow the full width of the specularly reflected beam through to the detector can result in a wider angular acceptance than that defined by the incident beam slits. Consequently, more of the isotropic incoherently scattered background is allowed into the detector. To remedy this, a set of parallel channels, called a “Soller” collimator, can be used to accept a wider beam at a narrower angular divergence more closely matched to that of the incident beam. Either a Soller collimator with reflecting partitions or one with nonreflecting, absorbing walls can be employed for the purpose.
Alternatively, a mosaic crystal with an appropriate angular distribution of mosaic blocks can be used to discriminate against a more widely divergent