


4
Quantifying cell kill and cell survival
MICHAEL C. JOINER
4.1 |
Concept of clonogenic cells |
41 |
4.9 |
The problem with targets |
48 |
4.2 |
Clonogenic assays |
42 |
4.10 |
The linear-quadratic model |
49 |
4.3 |
Cell survival curves |
43 |
4.11 |
The lethal–potentially lethal (LPL) |
|
4.4 |
Assays for the survival of clonogenic cells |
44 |
|
damage model |
50 |
4.5 |
Comparison of assays |
46 |
4.12 |
Repair saturation models |
51 |
4.6 |
Describing relationships between cell |
|
4.13 |
The linear-quadratic-cubic model |
52 |
|
survival and radiation dose |
47 |
4.14 |
Low-dose hyper-radiosensitivity |
53 |
4.7 |
A note on radiation response at the |
|
Key points |
54 |
|
|
molecular level |
47 |
Bibliography |
54 |
|
4.8 |
Target theory |
47 |
Further reading |
55 |
|
|
|
|
|
|
|
4.1 CONCEPT OF CLONOGENIC CELLS
As explained in Chapter 13, Section 13.2, the maintenance of tissue size and therefore of tissue function in the normal renewal tissues of the body depends upon the existence of a small number of primitive ‘stem cells’ – cells that have the capacity to maintain their numbers while at the same time producing cells that can differentiate and proliferate to replace the rest of the functional cell population. Stem cells are at the base of the hierarchy of cells that make up the epithelial and haemopoietic tissues.
Carcinomas are derived from such hierarchical tissues, and our ability to recognize this in histological sections derives from the fact that these tumours often maintain many of the features of differentiation of the tissue within which they arose. Well-differentiated tumours do this to a greater extent than anaplastic tumours. It follows that not all the cells in a tumour are neoplastic stem cells: some have embarked on an irreversible process of differentiation. In addition, carcinomas contain many cells that make up the stroma
(fibroblasts, endothelial cells, macrophages, etc.). Stem cells thus may constitute only a small proportion of the cells within a tumour.
When a tumour regrows after non-curative treatment, it does so because some neoplastic stem cells were not killed. Radiobiologists have therefore recognized that the key to understanding tumour response is to ask: How many stem cells are left? (if we can eradicate the last neoplastic stem cell then the tumour cannot regrow). It is almost impossible to recognize tumour stem cells in situ, and therefore assays have been developed that allow them to be detected after removal from the tumour. These assays generally detect stem cells by their ability to form a colony within some growth environment. We therefore call these ‘clonogenic’ or ‘colony-forming’ cells – cells that form colonies exceeding about 50 cells within a defined growth environment. The number 50 represents five or six generations of proliferation. It is chosen in order to exclude cells that have a limited growth potential as a result of having embarked on differentiation, or having been sublethally damaged by therapeutic treatment.
42 Quantifying cell kill and cell survival
After exposure to radiation, damaged cells do not die immediately and they may produce a modest family of descendants. This is illustrated in Fig. 4.1. The growth of single mouse L-cells was observed under the microscope and one selected colony was irradiated with 200 röntgens of X-rays at the four-cell stage (Trott, 1972). The röntgen is an old radiation unit, roughly equivalent to 1 cGy. Subsequent growth was carefully recorded and in the figure each vertical line indicates the lifetime of a cell from birth at mitosis to its subsequent division. The two irradiated cells on the left and the right of this figure produced continuously expanding colonies, although some daughter cells had long intermitotic times. The other two irradiated cells fared badly: they underwent a number of irregular divisions, including a tripolar mitosis. But note that at the end of the experiment cells are present from each of the original four cells: the difference is that two produced expanding colonies and the other two did not. The first two were ‘surviving clonogenic cells’ and the other two are usually described as ‘killed’ by radiation, since their regrowth is probably unimportant for clinical outcome. It would be more precise to say that two of the cells lost their proliferative ability as a result of irradiation.
Some cells fail to undergo even one division after irradiation. Interphase cell death occurs in many cell types at very high radiation doses, and at conventional therapeutic dose levels it is characteristic of lymphoid cells and some cells in the intestinal crypts. Although interphase cell death and apoptosis are related concepts (see Chapter 3, Section 3.3) they are not synonymous for the same process. But the conventional radiobiological view is that it is loss of reproductive integrity that is the critical response to irradiation (either
200 R
Figure 4.1 Pedigree of a clone of mouse L-cells irradiated with a dose of 200 R (i.e. röntgens) at the four-cell stage, illustrating the concept of surviving and non-surviving clonogenic cells. From Trott (1972), with permission.
in tumour or normal-tissue cells): this occurs within a few hours of irradiation through damage to the genome, and the subsequent metabolic and death processes are ‘downstream’ of this event.
4.2 CLONOGENIC ASSAYS
Clonogenic assays have formed the basis of cellular response studies in tumours, and in some normal tissues. The basic idea is to remove cells from the tumour, place them in a defined growth environment and test for their ability to produce a sizeable colony of descendants. Many types of assay have been described; we illustrate the principle by a simple assay in tissue culture that is analogous to a microbiological assay.
A single-cell suspension of tumour cells is prepared and divided into two parts. One part is irradiated, the other kept as an unirradiated control. The two suspensions are then plated out in tissue culture under identical conditions, except that since we anticipate that radiation has killed some cells we will have to plate a larger number of the irradiated cells. We here envisage plating 100 control cells and 400 irradiated cells. After a suitable period of incubation the colonies are scored (Fig. 4.2). There are 20 control colonies, and we therefore say that the plating efficiency was 20/100 0.2. The plating efficiency of the treated cells is lower: 8/400 0.02. We calculate a surviving fraction as the ratio of these plating efficiencies:
Surviving fraction PEtreated 0.02 0.1
PEcontrol 0.2
Control |
Treated |
Figure 4.2 Illustrating the principle of measuring a cell surviving fraction.
Cell survival curves 43
thus correcting for the efficiency with which undamaged clonogenic cells are detected and for the different numbers of cells plated. Surviving fraction is often given as a percentage (10 per cent in this case).
The above description started with a suspension of tumour cells. In order to measure in vivo cell survival we take two groups of experimental tumours (often subcutaneously implanted tumours in mice), irradiate one and keep the other as a control; then, some time after irradiation, we make cell suspensions from both groups and plate them out under identical conditions as before. The difference here is that the cells are irradiated under in vivo conditions.
Although colony assays have formed a central place in tumour radiobiology they are not without artefacts. Bearing in mind that the numbers of cells plated will often differ between control and treated cultures, a key question is whether colony counts increase linearly with the number of cells plated. If they do not, then this will lead to errors in cell survival. The colonies in Fig. 4.2 have been drawn to illustrate a feature of colony assays that was mentioned in the previous section. Irradiation
1.0
fraction |
ED50 |
Surviving |
0.5 |
|
|
|
|
|
|
|
ED90 |
|
|
|
|
0 |
1 |
2 |
3 |
4 |
5 |
6 |
7 |
8 |
9 |
10 |
0 |
||||||||||
|
|
|
Radiation dose (Gy) |
|
|
|
||||
(a)
not only reduces the colony numbers, it also increases the number of small colonies. Some of these small colonies may represent clones that eventually die out; others may arise from cells that have suffered non-lethal injury that reduces colony growth rate. Unless they reach the accepted cutoff of 50 cells they will not be counted, although their implications for the evaluation of radiation effects on tumours may be worthy of greater attention (Seymour and Mothersill, 1989).
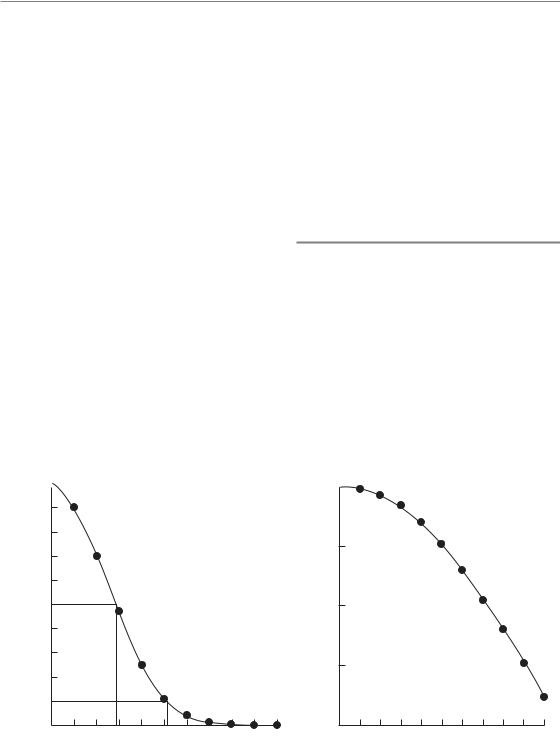
4.3 CELL SURVIVAL CURVES
A cell survival curve is a plot of surviving fraction against dose (of radiation, cytotoxic drug or other cell-killing agent). Figure 4.3a shows that when plotted on linear scales the survival curve for cells irradiated in tissue culture is often sigmoid: there is a shoulder followed by a curve that asymptotically approaches zero survival. To indicate the sensitivity of the cells to radiation we could just read off the dose that kills say 50 per cent of the cells. This is sometimes called the ED50 (i.e. effect dose 50 per cent). Sometimes ED90 is used. In doing
1.0
0.1
0.01
0.001
0.0001
0 |
1 |
2 |
3 |
4 |
5 |
6 |
7 |
8 |
9 |
10 |
Radiation dose (Gy)
(b)
Figure 4.3 A typical cell survival curve for cells irradiated in tissue culture, plotted (a) on a linear survival scale.
(b) The same data plotted on a logarithmic scale.

44 Quantifying cell kill and cell survival
this we need make no assumptions about the shape of the curve.
There are two reasons why cell survival curves are more usually plotted on a logarithmic scale of survival:
1.If cell killing is random then survival will be an exponential function of dose, and this will be a straight line on a semi-log plot. Section 4.8 explains this in detail.
2.A logarithmic scale more easily allows us to see and compare the very low cell survivals required to obtain a significant reduction in tumour size, or local tumour control.
Such a plot is illustrated in Fig. 4.3b. The shapes of radiation survival curves and ways of describing their steepness are dealt with later in this chapter.
Note that, for the data shown in Fig. 4.3, radiation doses above 5 Gy reduce the survival of clonogenic cells to below 10 per cent. Measurement of radiosensitivity in terms of the parameter D0 (see Section 4.8) is made on the exponential part of the survival curve, which in this case is above 5 Gy. These measurements are therefore made in a dose range where the surviving fraction is very low. Such D0 values are relevant to the problem of exterminating the last few clonogenic cells, but if the cell population contains cells of differing radiosensitivity these values may not be typical of the radiosensitivity of the bulk of the tumour cell population.
4.4 ASSAYS FOR THE SURVIVAL OF CLONOGENIC CELLS
Many techniques have been described for detecting colony formation by tumour cells and thus for measuring cell survival. They almost all require first the production of single-cell suspensions. This is usually not straightforward, because tumour tissues differ widely in the ease with which they can be disaggregated. Enzymes such as trypsin, collagenase and pronase are often used and some tissues can be disaggregated mechanically.
Such techniques can also be used for the assay of colony-forming cells in normal tissues, especially the haemopoietic tissues that can easily be sampled and made into cell suspensions. In addition, a variety of in situ assays for normal-tissue
stem cells have been described (Potten, 1983). The following are some of the principal assays that have been used for tumour cells.
In vitro colony assays
Some tumour cells grow well attached to plastic tissue culture dishes or flasks. Others can be encouraged to do so by first laying down a feeder layer of lethally irradiated connective-tissue or tumour cells. For cells that have been established as an in vitro cell line this often works well but for studies on tumour samples taken directly from patients or animals it is commonly observed that normaltissue fibroblasts grow better than the tumour cells and overgrow the cultures.
An alternative is to thicken the growth medium with agar or methylcellulose. This inhibits the growth of anchorage-requiring cell types, but many epithelial cells will still grow. A widely used assay of this type is that of Courtenay and Mills (1978) for human tumour cells. Agar cultures are grown in 15-mL plastic tubes overlaid with liquid medium that can regularly be replenished. The addition of rat red blood cells to the agar was found to promote the growth of a number of human tumour cell types. An important feature of the Courtenay–Mills assay was the use of a low oxygen tension (a gas phase of 90 per cent nitrogen, 5 per cent oxygen and 5 per cent carbon dioxide), which enhanced the plating efficiency of human tumour cells.
Spleen colony assay
Till and McCulloch (1961) showed that, when mouse bone marrow cells were injected intravenously into syngeneic recipients that had received sufficient whole-body irradiation to suppress endogenous haemopoiesis, colonies were produced in the spleen which derived from the stem cells in the graft. The colonies varied in morphology (erythroid, granulocyte or mixed) and these stem cells are therefore termed pluripotent. Their precise identity was not known and they are therefore often called colony-forming units (CFUs).
Using this assay, Till and McCulloch obtained the

Assays for the survival of clonogenic cells 45
first survival curve for bone marrow cells and found it to be very steep. The spleen colony assay has also been used for some types of mouse lymphoma cells.
Lung colony assay
This is analogous to the spleen colony assay and is applicable to any transplanted mouse tumour that readily forms colonies in the lung following intravenous injection of a single-cell suspension. The cloning efficiency can often be increased by mixing the test cells with an excess (c. 106 per injection) of lethally irradiated tumour cells or plastic microspheres, which perhaps act by increasing the trapping of injected tumour cells in the lung. Not all the tumour cells grow: a few colonies per thousand tumour cells injected would be regarded as satisfactory. Although colonies are formed throughout the lung, they are usually scored only on the lung surface. The method was developed by Hill and Stanley (1975) on two experimental tumours and they give further experimental details.
Limiting-dilution assay
This is a non-cloning assay that was used in early radiation cell survival studies and which for some experimental tumours has the advantage of high sensitivity. The principle of the method is to prepare a suspension of tumour cells and to make a large number of subcutaneous implants into syngeneic animals, covering a range of inoculum sizes and if possible spanning the level of 50 per cent tumour takes. The animals, usually mice, are then observed for a long enough period to record nearly every tumour that can grow from a singlecell implant. Take-rate is plotted against inoculum size and the point of 50 per cent takes is interpolated; this is usually called the ‘TD50’ cell number. The experiment is performed simultaneously on treated cells and control cells and the surviving fraction is given by the ratio of the TD50 values. The addition of an excess of lethally irradiated cells improves the take-rate; using this manoeuvre
Steel and Adams (1975) found a TD50 of 1–3 cells for the Lewis lung tumour and were thus able to
measure cell survival down to 10 6. The method only works well in the absence of an immune response against the tumour grafts, which is a relatively uncommon situation especially with chemically and virally induced tumours.
Short-term in vitro assays
The need to develop in vitro assays that yield a quicker result than a true clonogenic assay arises from the interest in prediction of tumour response to treatment (see Chapter 23). A variety of assays have been proposed but their reliability and reproducibility have often been a limit to their clinical usefulness. Three common pitfalls are:
1.Biopsy samples of human tumours contain both tumour cells and normal connective tissue cells; both may grow under the assay conditions and it may be difficult to distinguish colony formation by tumour cells.
2.If the method requires the production of sin- gle-cell suspensions, great care must be taken to exclude cell clumps, as these may preferentially give rise to scorable colonies.
3.Radiation-killed cells take time to die (e.g. Fig. 4.1) and in a short-term assay they may be confused with genuine surviving tumour cells; therefore, the method may not easily distinguish between radiosensitive cells and cells that die rapidly after irradiation.
Many basic principles underlying the prediction of tumour response are dealt with in the book edited by Chapman et al. (1989). Non-clonogenic assays for tumour cells include the following.
THE MICRONUCLEUS TEST
Tumour cells are cultured in the presence of cytochalasin-B, which blocks cytokinesis, creates binucleate cells, and thus allows nuclei that have undergone one post-treatment division to be identified. Micronuclei can be scored as small extranuclear bodies. Their frequency increases with radiation dose and gives a measure of radiation sensitivity (Streffer et al., 1986). The reliability of the method is limited by the fact that

46 Quantifying cell kill and cell survival
diploid, polyploid and aneuploid cells may differ in their tolerance of genetic loss and therefore of micronucleus formation.
CELL GROWTH ASSAYS
A variety of methods have been used to measure the growth of cultures derived from treated and control tumour specimens, and thus to derive a measure of radiosensitivity or chemosensitivity. Incorporation of radioisotopes such as 3H-thymidine has been widely used. A tetrazolium salt, 3-(4,5 dimethylthiazol-2-yl)-2,5-diphenyl tetrazolium bromide (MTT), is used to stain cell cultures and thus by a colorimetric assay to estimate the extent of growth (Carmichael et al., 1987; Wasserman and Twentyman, 1988). It can be used to evaluate growth in microtitre plates and with careful attention to technical factors it can yield a measure of radiosensitivity. The reagent 3-(4,5-dimethylthia- zol-2-yl)-5-(3-carboxymethoxyphenyl)-2-(4- sulfophenyl)-2H-tetrazolium (MTS) is a development of MTT and forms soluble formazans upon bioreduction by the cells. This has the advantage that it eliminates the error-prone solubilization step which is required for the microculture tetrazolium assays which employ MTT (Goodwin et al., 1995). Such methods are vulnerable to the variable growth of fibroblasts, and for studies on leukaemic cells it may be preferable to stain the cells differentially and analyse the cultures microscopically (Bosanquet, 1991).
DNA DAMAGE ASSAYS
It is possible to measure DNA damage directly by antibody detection of foci of phosphorylated histone H2AX (γH2AX) in the cell nucleus, using image cytometry or flow cytometry. It has been found that the rate of γH2AX loss (a measure of DNA repair) correlates with cellular radiosensitivity measured with a clonogenic assay, although the relationship is by no means perfect (MacPhail et al., 2003). Moreover, the percentage of tumour cells that retain γH2AX foci 24 hours after single or fractionated doses of radiation appears to be an indicator of cellular radiosensitivity that might be useful in the clinic (Klokov et al., 2006).
Methods using precise cell counting
The methods described so far involve the plating of an aliquot of a cell suspension that on average will contain a known number of cells. The actual number of cells will vary according to Poisson statistics. For studies of the effects of low radiation doses (where the effects are small) greater statistical precision can be achieved by knowing exactly how many cells have been plated. This has been done using two main methods (see Section 4.14). A fluorescence-activated cell sorter (FACS) allows counted numbers of cells to be plated into culture dishes (Durand, 1986). An alternative is to use a microscopic live cell recognition system (Marples and Joiner, 1993), which allows the spatial coordinates of plated cells to be recorded; subsequently the colony formation by each individual cell can be examined. Both of these methods give high precision in the initial region of a cell survival curve and their use led to the identification of low-dose hyper-radiosensitivity (HRS) (see Section 4.14).
4.5 COMPARISON OF ASSAYS
Intercomparison of the results of assays of cell survival can provide an important check on their validity. This information can be valuable at both a practical and a fundamental level. At the practical level, it is logical to check a rapid short-term assay against the results of a more laborious but more reliable clonogenic assay. The more general question is whether assay of cell survival in two different growth environments does actually identify the same population of surviving tumour cells. It is usually cell survival in situ in the patient or in the experimental animal that we seek to determine, and to subject tumour cells to extraction procedures and to artificial growth environments might well produce artefacts. It is therefore reassuring that some careful comparisons between clonogenic assays in vitro, in the mouse lung and by subcutaneous transplantation have demonstrated good agreement for mouse tumours (Steel and Stephens, 1983).

Target theory 47
4.6 DESCRIBING RELATIONSHIPS BETWEEN CELL SURVIVAL AND RADIATION DOSE
Research in experimental radiobiology covers studies at the cellular, animal and human levels. It deals at the fundamental level with the molecular, biochemical and biophysical nature of radiation damage. Descriptive models are a necessary part of radiobiology research: they provide a framework in which to analyse and compare data and ultimately to assist in building up consistent theories of radiation action both in vitro and in vivo. Models and mathematics are also sometimes necessary to relate experimental studies to clinical cancer treatment with the aim of improving therapy. In the following sections, we explain the most important models that are used to describe and analyse the relationship between cell survival and radiation dose.
4.7 A NOTE ON RADIATION RESPONSE AT THE MOLECULAR LEVEL
Radiation kills cells by producing secondary charged particles and free radicals in the nucleus which in turn produce a variety of types of damage in DNA. Evidence that damage to DNA is the primary cause of cell killing and mutation by radiation is set out in Chapter 2, Section 2.1. Each 1 Gy dose of low-linear energy transfer (LET) radiation produces over 1000 base damages, about 1000 initial single-strand breaks and approximately 20–40 initial double-strand breaks (DSBs). Some lesions are more important than others and radiation lethality correlates most significantly with the number of residual, unrepaired DSBs several hours after irradiation. If cell kill is modified by changing LET, oxygen level, thiol concentration or temperature, then for a fixed radiation dose only the number of DSBs reliably correlates with the change in cell kill. Single-strand breaks, base damage and DNA–protein crosslinks do not reflect the change in cell kill for all of these modifiers. The DNA DSB is therefore thought to be the most important type of cellular damage. Just one residual DSB (or ‘hit’) in a vital section of DNA may be sufficient to
produce a significant chromosome aberration and thus to sterilize the cell.
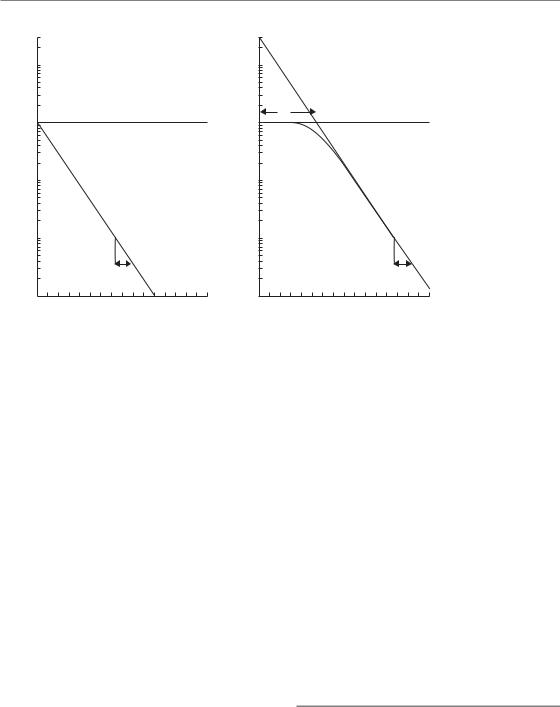
4.8 TARGET THEORY
A simple way of picturing how radiation might kill cells is the idea that there may be specific regions of the DNA that are important to maintain the reproductive ability of cells. These sensitive regions could be thought of as specific targets for radiation damage so that the survival of a cell after radiation exposure would be related to the number of targets inactivated. There are two versions of this idea that have commonly been used. The first version of the theory proposed that just one hit by radiation on a single sensitive target would lead to death of the cell. This is called singletarget single-hit inactivation, and it leads to the form of survival curve shown in Fig. 4.4a. The survival curve is exponential (i.e. a straight line in a semi-logarithmic plot of cell survival against dose). To derive an equation for this survival curve, Poisson statistics can be applied. The presumption is that during irradiation there are a very large number of hits on different cells taking place, but the probability (p) of the next hit occurring in a given cell is very small. Thus for each cell,
p(survival) p(0 hits) exp( D/D0 )
where D0 is defined as the dose that gives an average of one hit per target. A dose of D0 Gy reduces survival from 1 to 0.37 (i.e. to e 1), or from 0.1 to 0.037, etc. D/D0 is the average number of hits per target (and in this case per cell). This is the reason why (as in Fig. 4.7, later) a scale of cell survival is sometimes labelled ln(S): this is a scale of the natural logarithm of surviving fraction and it is also the equivalent number of ‘lethal lesions’ per cell.
In this example (Fig. 4.4a) D0 1.6 Gy. Straight survival curves of this sort are usually found for the inactivation of viruses and bacteria. They may also be appropriate in describing the radiation response of some very sensitive human cells (normal and malignant) and also the radiation response at very low dose rates (see Chapter 12, Section 12.3) and response to high LET radiations (see Chapter 6, Section 6.3). This type of
48 Quantifying cell kill and cell survival
|
|
|
|
|
|
|
n |
|
|
|
|
10 |
|
|
Single-target |
|
10 |
|
|
Multitarget |
|
|
|
|
|
|
|
|
|
|
||
|
|
|
|
single-hit |
|
|
|
|
single-hit |
|
|
1 |
|
|
|
|
1 |
Dq |
|
|
|
fraction |
|
|
|
|
|
|
|
|
||
|
|
|
|
|
|
|
|
|
|
|
Surviving |
0.1 |
|
|
|
|
0.1 |
|
|
|
|
|
|
|
|
|
|
|
|
|
||
|
0.01 |
|
|
|
|
0.01 |
|
|
|
|
|
|
|
D0 |
|
|
|
|
D0 |
|
|
0.001 |
4 |
8 |
12 |
16 |
0.001 |
4 |
8 |
12 |
16 |
|
|
0 |
0 |
||||||||
(a) |
|
Dose (Gy) |
|
(b) |
|
Dose (Gy) |
|
|||
Figure 4.4 The two most common types of target theory. (a) Single-target inactivation; (b)
multitarget inactivation.
‘single-target single-hit’ survival curve model is therefore actually valid outside of the ‘target theory’ framework. It describes the simple situation where if an individual cell receives an amount of radiation greater than D0 then it will die, otherwise it will survive.
For mammalian cells in general, their response to radiation is usually described by ‘shouldered’ survival curves. In an attempt to model this type of response, a more general version of target theory was proposed called multitarget single-hit inactivation. In this extended target idea, just one hit by radiation on each of n sensitive targets in the cell is required for death of the cell. The shape of this survival curve is shown in Fig. 4.4b. Again, the argument can be developed using Poisson statistics,
p(0 hits on a specific target) exp( D/D 0 )
Thus
p(survival) p(not all targets inactivated) |
|
|
1 (1 |
exp( D/D ))n |
(4.1) |
|
0 |
|
Figure 4.4b shows that multitarget single-hit survival curves have a shoulder whose size can be indicated by the quasi-threshold dose (Dq). This is related to n and D0 by the relation:
Dq D0 loge n |
(4.2) |
For the example in Fig. 4.4b, we have chosen n 30 and D0 1.6 Gy, giving Dq 5.4 Gy. Such multitarget survival curves have proved useful for describing the radiation response of mammalian cells at high doses, ‘off the shoulder’. They do not describe the survival response well at lower more clinically relevant doses.
Thus
p(specific target inactivated) 1 exp( D/D 0)
As there are n targets in the cell,
p(all n targets inactivated) (1 exp( D/D 0 ))n
4.9 THE PROBLEM WITH TARGETS
The derivation of simple cell survival relationships in terms of targets and hits, particularly the straight survival curve shown in Fig. 4.4a, is an intellectually attractive idea and it dominated radiobiological thinking for a long time. The term ‘D0’ is still in common usage. The key difficulty with this concept is
The linear-quadratic model 49
|
100 |
|
|
|
|
100 |
|
|
|
|
|
n |
|
|
|
|
|
|
|
|
|
|
10 |
|
|
|
|
10 |
|
|
|
|
fraction |
1 |
Dq |
|
|
|
1 |
|
αD |
|
|
|
|
|
|
|
|
|
||||
Surviving |
|
|
|
|
|
|
|
|
||
|
|
|
exp( |
1) |
|
|
βD 2 |
|
|
|
|
|
|
|
|
|
|
|
|||
|
0.1 |
|
|
|
|
0.1 |
|
|
|
|
|
|
|
|
|
|
|
High LET |
|
|
|
|
0.01 |
|
|
|
|
0.01 |
|
|
|
|
|
|
High LET |
|
|
|
|
α/ |
|
|
|
|
0.001 |
|
|
|
D0 |
0.001 |
|
|
|
|
|
|
|
|
|
|
|
|
|
||
|
0 |
4 |
8 |
12 |
16 |
0 |
4 |
8 |
12 |
16 |
(a) |
|
|
Radiation dose (Gy) |
|
(b) |
|
Radiation dose (Gy) |
|
|
|
|
|
|
|
|
|
|
|
|
||
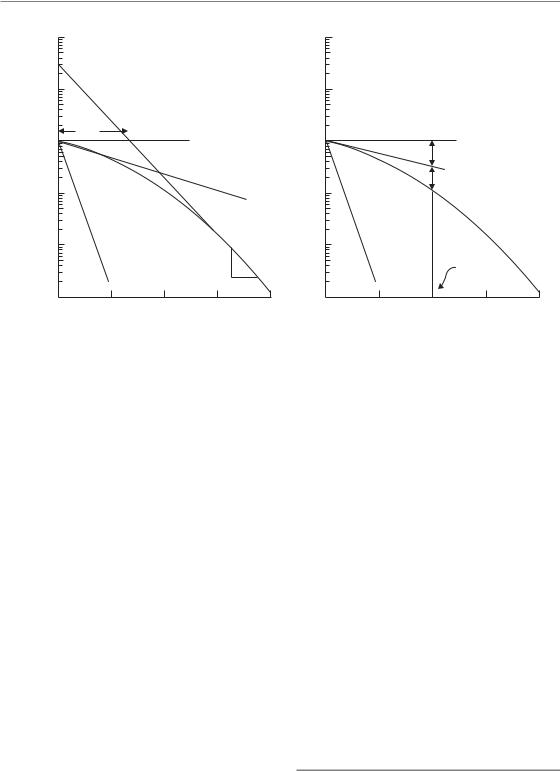
Figure 4.5 Models with non-exponential cell killing but a finite initial slope. (a) The two-component model and
(b) the linear-quadratic model.
that so far the specific radiation targets have not been identified for mammalian cells, despite considerable effort to search for them. Rather, what has emerged is the key role of DNA strand breaks and their repair, with sites for such DNA damage being generally dispersed throughout the cell nucleus (see Chapter 2). An obvious shortcoming of the multitarget model is that, as shown in Fig. 4.4b, it predicts a response that is flat for very low radiation doses. This is not supported by experimental data: there is overwhelming evidence for significant cell killing at low doses and for cell survival curves that have a finite initial slope. To take account of this, the multitarget model was adjusted by adding an additional single-target component. The resulting equation for the survival curve is called the two-component model:
p(survival) exp( D/D1)
(1 (1 exp( D(1/D0 1/D1)))n )
(4.3)
slope (i.e. the dose required in the low-dose region to reduce survival from 1 to 0.37). In this example, n 30 and D0 1.6 Gy, and D1 4.6 Gy. This type of curve now correctly predicts finite cell killing in the low-dose region but it still has the drawback that the change in cell survival over the range 0 to Dq occurs almost linearly. This implies that no sparing of damage should occur as dose per fraction is reduced below 2 Gy, which is usually not found to be the case either experimentally or in clinical radiotherapy (see Chapter 8, Figs 8.1 and 8.2; Chapter 10, Section 10.3). A way of overcoming this limitation would be to use a multitarget instead of single-target component as the initial slope. However, this would make the model far too complicated to be of much use in comparing survival responses. It would require at least four parameters, and would be of little value in helping to understand the fundamental mechanisms determining radiation effect.
4.10 THE LINEAR-QUADRATIC MODEL
This type of survival curve is illustrated in Fig. 4.5a. In addition to the parameters n, D0 and Dq, this curve also has a parameter D1, which fixes an initial
The continually downward bending form of a cell survival can simply be fitted by a second-order

50 Quantifying cell kill and cell survival
polynomial, with a zero constant term to ensure that SF 1 at zero dose. This is exactly the formulation that is termed the linear-quadratic (LQ) model. Although we can regard this as based on pure mathematics (i.e. the simplest formula which describes a curve), it has also been possible to attach radiobiological mechanisms to this model. The formula for cell survival is:
ln(S) αD βD2
p(survival) exp( αD βD2 ) |
(4.4) |
and the cell survival curve is drawn in Fig. 4.5b. Although the shapes of the LQ model and the complicated two-component model are superficially similar (compare Fig. 4.5a with Fig. 4.5b), the simple LQ formula gives a better description of radiation response in the low-dose region (0–3 Gy): LQ survival curves are continuously bending with no straight portion either at low or high radiation doses. The shape (or ‘bendiness’) is determined by the ratio α/β.
Since the dimensions of the parameters for α are Gy 1 and for β are Gy 2, the dimensions of α/β are Gy; as shown in Fig. 4.5b, this is the dose at which the linear contribution to damage (αD on the logarithmic scale) equals the quadratic contribution (βD2). The response of cells to densely-ionizing radiations such as neutrons or α-particles is usually a steep and almost exponential survival curve (see Fig. 6.2). As shown in Fig. 4.5, this would be explained in the two-compo- nent model by the ratio D1/D0 being near to 1.0, or in the LQ model by a very high α/β ratio.
As shown in Fig. 4.5, the LQ model does not have a D0 because the survival curve continuously bends downwards with increasing dose and so it is never completely straight. However, it is sometimes useful to be able to roughly convert between α, β and D0; for example, if comparing two sets of research findings which have each been described with the different models. The precise mathematical description of D0 is that it is the inverse of the first-order differential of ln(S) with respect to dose. Applying this definition to the LQ model gives D0 1/(α 2βD). This formula shows that, in the LQ model, the effective D0 is not constant, but decreases with increasing dose.
The LQ model is now in widespread use in both experimental and clinical radiobiology and generally works well in describing responses to radiation in vitro and in vivo. What could be its mechanistic justification? One simple idea is that the linear component [exp( αD)] might result from single-track events while the quadratic component [exp( βD2)] might arise from two-track events. This interpretation is supported by studies of the dose-rate effect (see Chapter 12, Section 12.3), which shows that as dose rate is reduced cell survival curves become straight and tend to extrapolate the initial slope of the high dose-rate curve: the quadratic component of cell killing disappears, leaving only the linear component. This would be expected, since at low dose rate sin- gle-track events will occur far apart in time and the probability of interaction between them will be low. Although this interpretation of the LQ equation seems reasonable, the nature of the interactions between separate tracks is still a matter of some debate. Chadwick and Leenhouts (1973) postulated that separate tracks might hit opposite strands of the DNA double helix and thus form a DSB. We now know that this is unlikely in view of the very low probability of two tracks interacting within the dimensions of the DNA molecule (diameter c. 2.5 nm) at a dose of a few grays. Interaction between more widely spaced regions of the complex DNA structure, or between DNA in different chromosomes, is a more plausible mechanism (see Chapter 2, Section 2.7).
4.11 THE LETHAL–POTENTIALLY LETHAL (LPL) DAMAGE MODEL
Curtis (1986) proposed the LPL model as a ‘unified repair model’ of cell killing. Ionizing radiation is considered to produce two different types of lesion: repairable (i.e. potentially lethal) lesions and non-repairable (i.e. lethal) lesions. The nonrepairable lesions produce single-hit lethal effects and therefore give rise to a linear component of cell killing [ exp( αD)]. The eventual effect of the repairable lesions depends on competing processes of repair and binary misrepair. It is this latter process that leads to a quadratic component in cell killing. As shown in Fig. 4.6, the model has
Repair saturation models 51
Viable cells |
|
|
|
|
(no lesions) |
|
Correct repair |
||
|
|
|
||
|
|
ηPL |
|
eL |
|
|
|
|
|
|
Lesions |
|
|
|
ηL |
produced |
|
Potentially lethal |
|
by irradiation |
|
|||
|
|
|
|
(i.e. repairable) |
|
|
|
|
lesions |
|
|
|
|
|
|
|
|
|
Binary misrepair |
|
|
|
|
|
Lethal lesions |
|
|||
|
|
e2PL |
||
(cell death) |
|
|
||
Figure 4.6 The ‘lethal–potentially lethal’ (LPL) damage model of radiation action.
two sensitivity parameters (ηL determines the number of non-repairable lesions produced per unit dose, and ηPL the number of repairable lesions). There are also two rate constants ( PL determines the rate of repair of repairable lesions, and 2PL the rate at which they undergo interaction and thus misrepair).
This model produces almost identical cell survival curves to the LQ equation, down to a survival level of perhaps 10 2. It can therefore be taken to provide one possible mechanistic interpretation of the LQ equation. It predicts that, as dose rate is reduced, the probability of binary interaction of potentially lethal lesions will fall and parameter values can be found that allow the model accurately to simulate cell survival data on human and animal cells irradiated at various dose rates (see Chapter 12, Sections 12.3 and 12.5).
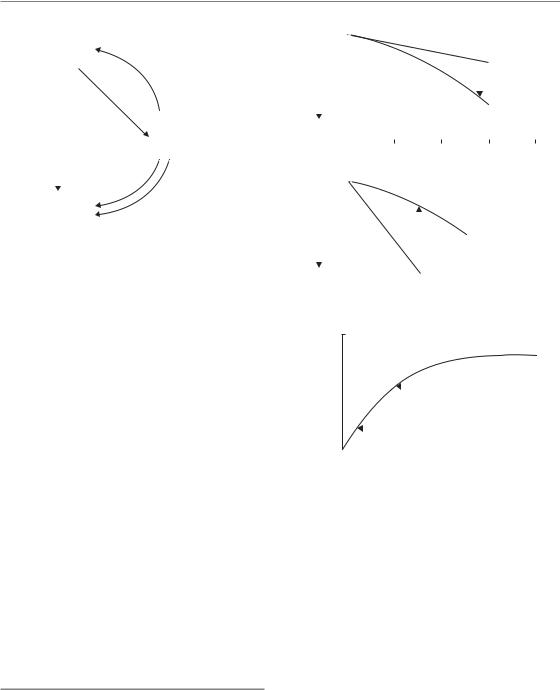
4.12 REPAIR SATURATION MODELS
Curtis’ LPL model is an example of a lesion-inter- action model which also incorporates repair processes. Figure 4.7a shows how this produces the downward-bending cell survival curve: the dashed curve indicates the component of cell killing that is due to single-track non-repairable lesions. It is the extra lethal lesions produced by
|
|
e S |
|
|
|
|
Single-track lesions |
||||||||
|
|
|
|
|
|
|
|
|
|
|
|
|
|
|
|
(number of |
|
|
|
|
|
|
|
|
Additional lesions |
||||||
lesions) |
|
|
|
|
|
|
|
|
|||||||
|
|
|
|
|
|
|
|
owing to interaction |
|||||||
|
|
|
|
|
|
|
|
|
|
|
|||||
|
|
|
|
|
|
|
|
|
|
|
or accumulation |
||||
|
|
|
|
|
|
||||||||||
|
|
|
|
|
|
|
|
|
|
||||||
|
|
|
|
|
|
|
|
|
|
|
of sublesions |
||||
|
|
|
|
|
|
|
|
|
|
|
|
|
|
|
|
|
|
|
|
|
|
|
|
|
|
|
|
|
|
|
|
|
(a) |
Radiation dose |
|||||||||||||
|
|
|
|
|
|
|
|
|
|
|
|||||
|
|
|
|
|
|
|
|
|
|
|
|
|
|
|
|
|
|
e S |
|
|
|
|
|
|
|
|
|
|
|
|
|
(number of |
|
|
|
|
|
|
|
|
|
|
|
|
|
||
lesions) |
|
|
|
|
Fewer lesions |
||||||||||
|
|
|
|
||||||||||||
|
|
|
|
|
|
|
|||||||||
|
|
|
Initial |
|
due to repair |
||||||||||
|
|
|
single-track |
|
|
|
|
|
|
|
|
|
|
||
|
|
|
|
|
|
|
|
|
|
|
|
|
|||
|
|
|
lesions |
|
|
|
|
|
|
|
|
|
|
||
|
|
|
|
|
|
|
|
|
|
|
|
|
|
|
|
|
|
|
|
|
|
|
|
|
|
|
|
|
|
|
|
|
(b) |
Radiation dose |
|||||||||||||
|
|
|
|
|
|
|
|
|
|
|
|||||
Totally saturated
of repair |
|
|
|
|
|
|
|
Partially saturated |
|||||
|
|
|
|
|
|
|
|||||||
|
|
|
|
|
|
|
|||||||
Velocity |
|
|
|
Totally unsaturated |
|||||||||
|
|
|
|||||||||||
|
|
|
|
||||||||||
|
|
|
|
||||||||||
|
|
|
|
|
|
|
|
|
|
|
|
|
|
|
|
|
|
|
|
|
Amount of damage |
||||||
(c)
Figure 4.7 The contrast between lesion-interaction models and repair-saturation models. (a) The ‘lethal–potentially lethal’ (LPL) model; (b) the effect of repair becoming less effective at higher radiation doses;
(c) the basic concept of repair saturation. Adapted from Goodhead (1985), with permission.
the binary interaction of potentially lethal lesions which give the downward-bending curve.
Another class of models are the repair saturation models, which propose that the shape of the survival curve depends only on a dose-dependent rate of repair. Figure 4.7b,c demonstrates this idea. Only one type of lesion and single-hit killing are postulated, and in the absence of any repair these lesions produce the steep dashed survival curve in Fig. 4.7b. The final survival curve (solid line) results from repair of some of these lesions; however, if the repair enzymes become saturated (Fig. 4.7c), there
52 Quantifying cell kill and cell survival
Table 4.1 Different interpretations of radiobiological phenomena by lesion-interaction and saturable-repair models
Observation |
Explanation Lesion interaction |
Repair saturation |
|
|
|
Curved dose–effect relationship |
Interaction of sublesions |
Saturation of capacity to repair sublesions |
Split-dose recovery |
Repair of sublesions (sublethal |
Recovery of capacity to repair sublesions |
|
damage repair) |
|
RBE increase with LET |
More non-repairable lesions |
High-LET lesions are less repairable |
|
at high LET |
|
Low dose rate is less effective |
Repair of sublesions during |
Repair system not saturating |
|
irradiation |
|
LET, linear energy transfer; RBE, relative biological effectiveneness.
Adapted from Goodhead (1985), with permission.
is not enough repair enzyme to bind to all damaged sites simultaneously and so the reaction velocity of repair no longer increases with increasing damage. Therefore at higher doses (more lesions), there is proportionally less repair during the time available before damage becomes fixed; this will lead to more residual damage and to greater cell kill. The mechanisms of fixation of non-repaired damage are not understood but they may be associated with the entry of cells carrying such damage into DNA synthesis or mitosis. It should be noted that an alternative ‘saturation’ hypothesis, leading to the same consequence, is that the pool of repair enzymes is used up during repair, so that at higher doses the repair system is depleted and is less able to repair all the induced damage.
Table 4.1 illustrates how the basic conceptual difference between the lesion accumulation/interaction models such as Curtis’ LPL and the dosedependent repair models affects the interpretation of some radiobiological phenomena (Goodhead, 1985). Both types of model predict linear-quadratic cell survival curves in the clinically relevant dose region. They also provide good explanations of split-dose recovery (see Chapter 7, Section 7.3), changing effectiveness with LET (see Chapter 6, Section 6.3) and the dose-rate effect (see Chapter 12, Section 12.2). At present, radiation scientists are uncertain whether lesion interaction or repair saturation really exist in cells but it may well be that molecular and microdosimetric studies will eventually determine which explanation (maybe both!) is correct.
4.13 THE LINEAR-QUADRATIC-CUBIC MODEL
The LQ model describes the cellular response to ionizing radiation extremely well at doses less than about 5–6 Gy and is the preferred model to use in this dose range. However, at higher doses the survival response of cells is often found to more closely resemble a linear relationship between ln(S) and dose, as described by the models based on target theory.
A simple way of adjusting the LQ model to account for the more linear response at higher doses is to add an additional term proportional to the cube of the dose, but opposite in sign to the linear and quadratic terms. This is termed the linear-quadratic-cubic, or LQC model:
ln(S) αD βD 2 γD3
p(survival) exp( αD βD2 γD3 )
(4.5)
A comparison of the LQ and LQC models is shown in Fig. 4.8. By taking the second-order differential of ln(S) with respect to dose, it can be shown that the survival curve can be straightened at dose DL by choosing γ β/(3DL). In the example of Fig. 4.8, the LQC curve becomes a straight line at a dose, DL, of 18 Gy.
As with the two-component model, a disadvantage of the LQC model is the addition of a third parameter, but because the LQC model is a
Low-dose hyper-radiosensitivity 53
|
100 |
|
|
|
|
|
|
|
|
|
|
|
|
|
|
|
|
|
|
|
|
|
|
|
|
|
|
|
|
|
10 |
|
|
|
|
|
|
|
|
|
|
|
|
|
|
|
|
|
|
|
|
|
|
|
|
|
|
|
|
|
10 |
|
|
|
|
|
|
|
|
|
|
|
|
|
|
|
|
|
|
|
|
|
|
|
|
|
|
|
|
fraction |
10 |
|
|
|
|
|
|
|
|
|
|
|
|
|
|
|
|
|
|
|
|
|
|
|
|
|
|
||
10 |
|
|
|
|
LQ |
|
|
|
|
|
|
|||
|
|
|
|
|
|
|
|
|
|
|||||
Surviving |
10 |
|
|
|
|
LQC |
|
|
|
|||||
|
10 |
|
|
|
|
|
|
|
|
|
|
|
|
|
|
10 |
|
|
|
|
|
|
|
|
|
|
|
|
|
|
|
|
|
|
|
|
|
|
|
|
|
|
|
|
|
10 |
|
|
|
|
|
|
|
|
|
|
|
|
|
|
|
|
|
|
|
|
|
|
|
|
|
|
|
|
|
10 |
|
|
|
|
|
|
|
|
|
|
|
|
|
|
|
5 |
10 |
15 |
20 |
|||||||||
|
0 |
|||||||||||||
Dose (Gy)
Figure 4.8 Cell survival modelled with the linearquadratic (LQ) or linear-quadratic-cubic (LQC) equations. In this example both equations model a cellsurvival response with surviving fraction at 2 Gy (SF2) equal to 0.5, and an α/β ratio of 3 Gy. The value of γ in the LQC model is given by γ β/(3DL), where DL is the dose at which the curve becomes straight; here this dose has been chosen to be 18 Gy.
simple polynomial it is nevertheless still more mathematically manageable than the target theory models. The LQC model is actually just a third-order polynomial approximation to Curtis’ LPL model, which also demonstrates a more linear relationship between –ln(S) and dose than predicted by the LQ model, at surviving fractions less than about 10 2.
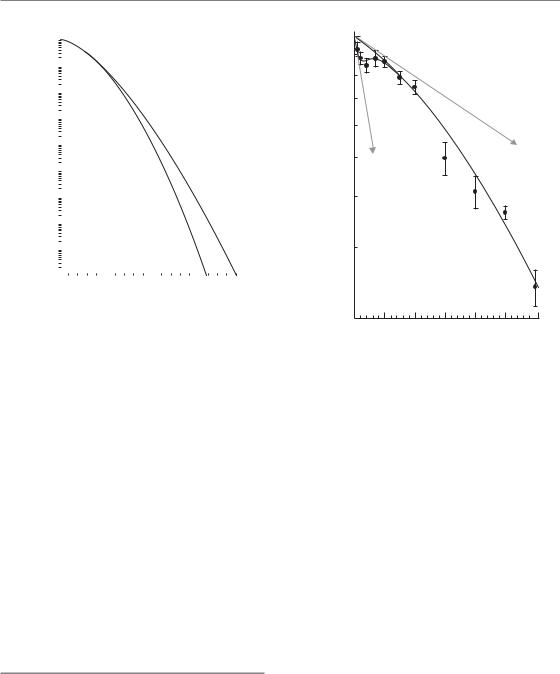
4.14 LOW-DOSE HYPERRADIOSENSITIVITY
The LQ model and its mechanistic interpretations (Curtis’ LPL and repair saturation) adequately describe cellular response to radiation above about 1 Gy. It has been difficult to make accurate measurements of cell killing by radiation below this dose, but this problem has been partially overcome by methods that determine exactly the number of cells ‘at risk’ in a colony-forming assay
|
1.0 |
|
|
|
|
|
|
|
0.9 |
|
|
|
|
|
|
|
0.8 |
|
|
|
|
|
|
|
0.7 |
|
|
|
|
|
|
|
0.6 |
|
|
|
|
|
αr |
fraction |
|
|
|
|
|
|
|
0.5 |
αs |
|
|
|
|
|
|
|
|
|
|
|
|
|
|
Surviving |
0.4 |
|
|
|
|
|
|
|
|
|
|
|
|
|
|
|
0.3 |
|
|
|
|
|
|
|
0.2 |
|
|
|
|
|
|
|
0 |
1 |
2 |
3 |
4 |
5 |
6 |
Dose/ (Gy)
Figure 4.9 Survival of asynchronous T98G human glioma cells irradiated with 240 kVp X-rays, measured using a cell-sorter protocol (Short et al., 1999). Each datum point represents 10–12 measurements. The solid line and dashed line show the fits of the induced-repair (IndRep) model and linear-quadratic (LQ) models, respectively. At doses below 1 Gy the LQ model, using an initial slope αr, substantially underestimates the effect of irradiation and this domain is better described by the IndRep model using a much steeper initial slope αs. Reprinted with permission of Taylor & Francis Group.
(see Section 4.4). This can be achieved using a FACS to plate an exact number of cells or microscopic scanning to identify an exact number of cells after plating. Using such techniques, it can be shown that many mammalian cell lines actually exhibit the type of radiation response shown in Fig. 4.9 at doses less than 1 Gy. Below about 10 cGy, the cells show HRS, which can be characterized by a slope (αs) that is considerably steeper than the slope expected by extrapolating back the response from high-dose measurements (αr). The transition (over about 20–80 cGy) from a sensitive to resistant response has been termed a region of increased radioresistance (IRR). This phenomenon was originally discovered in mammalian cells by Marples and Joiner (1993) using V79 hamster
54 Quantifying cell kill and cell survival
fibroblasts and is thought to be caused by an increase in the extent of DNA repair of the cells in the IRR region (Joiner et al., 2001). This happens because a rapid cell-cycle arrest of cells, irradiated in the G2 phase of the cell cycle, only occurs when there are enough DNA DSBs to trigger phosphorylation of the ATM damage-recognition protein. This typically starts to happen only when the average dose exceeds about 10 cGy (Marples et al., 2003).
The LQ model can be modified to take account of this process and the result is called the induced repair (IndRep) model:
p(survival)
exp( αr D(1 (αs /αr 1)exp( D/Dc )) βD2 )
(4.6)
In this equation, Dc is around 0.2 Gy and describes the dose at which the transition from the HRS response through the IRR response starts to occur. At very high doses (D Dc), equation 4.6 tends to a LQ model with active parameters αr and β. At very low doses (D Dc), equation 4.6 tends to a LQ model with active parameters αs and β. The IndRep model thus comprises two LQ models with different αsensitivities dependent on the dose given, merged into a single equation.
It has been proposed that this HRS phenomenon might be exploitable clinically, if it is practicable to deliver radiotherapy as a very large number of dose fractions each less than 0.5 Gy. The aim would be to take advantage of the extra radiosensitivity in the HRS region, which could improve the response of tumours that are known to be resistant to radiotherapy at doses of 2 Gy per fraction.
Key points
1.Tumour recurrence after treatment depends upon the survival of clonogenic cells, which may constitute only a small proportion of the total cells within the tumour.
2.Evaluation of the survival of clonogenic cells following treatment is an important aspect of experimental cancer therapy. In experimental situations this is relatively simple to perform, but for cells removed directly from human tumours great care is necessary in the selection and performance of the assays.
3.A number of different mathematical models adequately simulate the shape of cell-survival curves for mammalian cells.
4.Target theory proposes that a specific number of targets or DNA sites must be inactivated or damaged to kill the cell. This approach is satisfactory only if a component of single-hit killing is also introduced. To date, it has not been possible to identify the location of these vital ‘targets’ within the cell nucleus.
5.Lesion-interaction models explain downwardbending cell-survival curves by postulating two classes of lesion. One class is directly lethal, but the other type is only potentially lethal and may be repaired enzymatically or may interact with other potentially lethal lesions to form lethal lesions.
6.Repair-saturation models also provide a plausible explanation of cell survival phenomena.
7.Linear-quadratic equations model the shape of the cell survival curve very well at doses less than approximately 5–6 Gy. At higher doses, it may be necessary to use linear- quadratic-cubic equations to model the more linear relationship between –log (surviving fraction) and dose which is often seen.
8.The phenomenon of hyper-radiosensitivity at very low radiation doses illustrates that reactive molecular signalling and repair processes determine the balance between radiation cell killing and cell survival, and models that treat the cell only as a set of passive targets will be unlikely to describe the full spectrum of radiation response.
■BIBLIOGRAPHY
Bosanquet AG (1991). Correlations between therapeutic response of leukaemias and in-vitro drug-sensitivity assay. Lancet 337: 711–4.

Further reading 55
Carmichael J, DeGraff WG, Gazdar AF, Minna JD, Mitchell JB (1987). Evaluation of a tetrazoliumbased semiautomated colorimetric assay: assessment of radiosensitivity. Cancer Res 47: 943–6.
Chadwick KH, Leenhouts HP (1973). A molecular theory of cell survival. Phys Med Biol 18: 78–87.
Chapman JD, Peters LJ, Withers HR (eds) (1989). Prediction of tumor treatment response. New York: Pergamon.
Courtenay VD, Mills J (1978). An in vitro colony assay for human tumours grown in immune-suppressed mice and treated in vivo with cytotoxic agents. Br J Cancer 37: 261–8.
Curtis SB (1986). Lethal and potentially lethal lesions induced by radiation – a unified repair model. Radiat Res 106: 252–70.
Durand RE (1986). Use of a cell sorter for assays of cell clonogenicity. Cancer Res 46: 2775–8.
Goodhead DT (1985). Saturable repair models of radiation action in mammalian cells. Radiat Res Suppl 8: S58–67.
Goodwin CJ, Holt SJ, Downes S, Marshall NJ (1995). Microculture tetrazolium assays: a comparison between two new tetrazolium salts, XTT and MTS.
J Immunol Methods 179: 95–103.
Hill RP, Stanley JA (1975). The lung-colony assay: extension to the Lewis lung tumour and the B16 melanoma – radiosensitivity of B16 melanoma cells.
Int J Radiat Biol 27: 377–87.
Joiner MC, Marples B, Lambin P, Short SC, Turesson I (2001). Low-dose hypersensitivity: current status and possible mechanisms. Int J Radiat Oncol Biol Phys 49: 379–89.
Klokov D, MacPhail SM, Banath JP, Byrne JP, Olive PL (2006). Phosphorylated histone H2AX in relation to cell survival in tumor cells and xenografts exposed to single and fractionated doses of X-rays. Radiother Oncol 80: 223–9.
MacPhail SH, Banath JP, Yu TY, Chu EH, Lambur H, Olive PL (2003). Expression of phosphorylated histone H2AX in cultured cell lines following exposure to X-rays. Int J Radiat Biol 79: 351–8.
Marples B, Joiner MC (1993). The response of Chinese hamster V79 cells to low radiation doses: evidence of enhanced sensitivity of the whole cell population.
Radiat Res 133: 41–51.
Marples B, Wouters BG, Joiner MC (2003). An association between the radiation-induced arrest of G2-phase cells and low-dose hyper-radiosensitivity: a plausible underlying mechanism? Radiat Res 160: 38–45.
Potten CS (ed.) (1983). Stem cells: their identification and characterization. Edinburgh: Churchill-Livingstone.
Seymour CB, Mothersill C (1989). Lethal mutations, the survival curve shoulder and split-dose recovery. Int J Radiat Biol 56: 999–1010.
Short S, Mayes C, Woodcock M, Johns H, Joiner MC (1999). Low dose hypersensitivity in the T98G human glioblastoma cell line. Int J Radiat Biol 75: 847–55.
Steel GG, Adams K (1975). Stem-cell survival and tumor control in the Lewis lung carcinoma. Cancer Res 35: 1530–5.
Steel GG, Stephens TC (1983). Stem cells in tumours. In: Potten CS (ed.) Stem cells: their identification and characterization. Edinburgh: Churchill-Livingstone.
Streffer C, van Beuningen D, Gross E, Schabronath J, Eigler FW, Rebmann A (1986). Predictive assays for the therapy of rectum carcinoma. Radiother Oncol 5: 303–10.
Till JE, McCulloch CE (1961). A direct measurement of the radiation sensitivity of normal mouse bone marrow cells. Radiat Res 14: 213–22.
Trott KR (1972). Relation between division delay and damage expressed in later generations. Curr Topics Radiat Res Q 7: 336–7.
Wasserman TH, Twentyman P (1988). Use of a colorimetric microtiter (MTT) assay in determining the radiosensitivity of cells from murine solid tumors. Int J Radiat Oncol Biol Phys 15: 699–702.
■ FURTHER READING
Alpen EL (1998). Radiation biophysics, 2nd edn. San Diego: Academic Press.
Douglas BG, Fowler JF (1976). The effect of multiple small doses of X rays on skin reactions in the mouse and a basic interpretation. Radiat Res 66: 401–26.
Elkind MM, Sutton H (1960). Radiation response of mammalian cells grown in culture. 1. Repair of X-ray damage in surviving Chinese hamster cells. Radiat Res 13: 556–93.
Elkind MM, Whitmore GF (1967). The radiobiology of cultured mammalian cells. New York: Gordon and Breach.
Ward JF (1990). The yield of DNA double-strand breaks produced intracellularly by ionizing radiation: a review. Int J Radiat Biol 57: 1141–50.