

- •Contents
- •Preface
- •1 Introduction: the significance of radiobiology and radiotherapy for cancer treatment
- •2 Irradiation-induced damage and the DNA damage response
- •3 Cell death after irradiation: how, when and why cells die
- •4 Quantifying cell kill and cell survival
- •5 Dose–response relationships in radiotherapy
- •6 Linear energy transfer and relative biological effectiveness
- •7 Tumour growth and response to radiation
- •8 Fractionation: the linear-quadratic approach
- •9 The linear-quadratic approach in clinical practice
- •10 Modified fractionation
- •11 Time factors in normal-tissue responses to irradiation
- •12 The dose-rate effect
- •13 Pathogenesis of normal-tissue side-effects
- •14 The volume effect in radiotherapy
- •15 The oxygen effect and fractionated radiotherapy
- •16 The tumour microenvironment and cellular hypoxia responses
- •17 Therapeutic approaches to tumour hypoxia
- •18 Combined radiotherapy and chemotherapy
- •19 Retreatment tolerance of normal tissues
- •20 Molecular image-guided radiotherapy with positron emission tomography
- •21 Molecular-targeted agents for enhancing tumour response
- •22 Biological response modifiers: normal tissues
- •23 Molecular targeting and patient individualization
- •24 Protons and other ions in radiotherapy
- •25 Second cancers after radiotherapy
- •Glossary of terms in radiation biology
- •Index

16
The tumour microenvironment and cellular hypoxia responses
BRADLY G. WOUTERS AND MARIANNE KORITZINSKY
16.1 |
Oxygenation patterns of tumours |
217 |
16.7 Hypoxia and protein synthesis |
229 |
16.2 |
The heterogeneity of tumour hypoxia |
218 |
Key points |
231 |
16.3 |
Hypoxia and its association with the |
|
Bibliography |
231 |
|
malignant phenotype |
224 |
Further reading |
232 |
16.4 |
Hypoxia and tumour malignancy |
225 |
|
|
16.5 |
Hypoxia response pathways |
226 |
|
|
16.6 |
Hypoxia-inducible factor (HIF): the |
|
|
|
|
master transcriptional regulator of |
|
|
|
|
hypoxic responses |
227 |
|
|
|
|
|
|
|
16.1 OXYGENATION PATTERNS OF TUMOURS
The steady-state oxygen concentration in tissues is determined by the balance between oxygen supply and demand. Oxygen is supplied from the blood, mainly in a form that is bound to haemoglobin in red blood cells and is consumed by cells primarily through a process called oxidative phosphorylation. In this process, mitochondria use oxygen as the terminal electron acceptor in a cascade of reactions called the electron transport chain. Here, nutrients are oxidized to produce the cellular energy currency ATP (adenosine triphosphate). Oxidative phosphorylation plays a very important role in energy production by extracting the maximum amount of energy from cellular nutrients. For example, a molecule of glucose can produce as much as 38 molecules of ATP under conditions where oxygen is present (oxidative respiration) but only two molecules of ATP when oxygen is absent (anaerobic glycolysis). The consumption of oxygen in this process gives rise to a
limited ability of oxygen to diffuse through unvascularized tissues. Estimates of the oxygen diffusion distance ranges from 75 to 200 μm depending on the actual respiration rate (oxygen consumption rate) of the tissue in question.
The oxygen concentration of most normal tissues is stably maintained at around 5–7 per cent. When oxygen concentrations drop to 3 per cent or below, the tissue is considered hypoxic. Below this value, oxygen deprivation then leads to the activation of several different biological pathways that serve to alter the behaviour or ‘phenotype’ of the cell. Many of these pathways are activated to allow adaptation of the cell or the tissue to the stress associated with oxygen deprivation. For example, these pathways can increase the capacity for anaerobic glycolysis (to maintain energy production), mediate changes in blood flow, and stimulate angiogenesis (new blood vessel growth) to increase the oxygen supply to the tissue. For the most part, these pathways operate both in normal tissues and in tumours. Numerous studies have demonstrated the presence of hypoxic cells in

218 The tumour microenvironment and cellular hypoxia responses
human tumours and, furthermore, show that oxygenation patterns are highly heterogeneous (Magagnin et al., 2006).
Two distinct mechanisms cause tumour hypoxia
The rapid and uncontrolled proliferation of tumour cells often results in a demand for oxygen that exceeds the capacity of the vascular network. Although the resulting hypoxia may stimulate tumour angiogenesis (through mechanisms described below), the developing vessels are often still unable to provide adequate oxygenation for the rapidly proliferating tumour. Thus, although angiogenesis becomes a ‘hallmark’ of cancer, hypoxic tumour areas remain a common feature throughout the lifetime of the tumour. The lack of sufficient numbers of tumour blood vessels gives rise to one of the two main causes of hypoxia in human tumours known as ‘chronic’ or ‘diffusion-limited’ hypoxia. In this type of hypoxia, individual perfused vessels are characterized by a gradient of oxygenation surrounding them. Diffusion-limited hypoxia in tumours was first documented in 1955 (Thomlinson and Gray, 1955; see Chapter 15) and its presence indicates the existence of cells at all possible oxygen concentrations ranging from anoxia at distal locations to normal values next to the vessels.
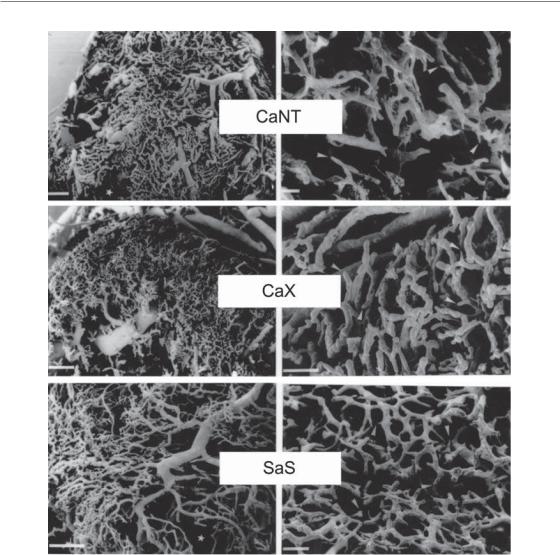
In some situations, hypoxic cells can also be found much closer to blood vessels than would be expected from diffusion limitations. This observation reflects the poor functionality of tumour vasculature, which is characterized by being highly tortuous and poorly organized (Fig. 16.1). Tumour vessels are often immature, leaky, lack smooth muscle cells, and have structural abnormalities including blind ends and arterial–venous shunts that together result in unstable blood flow, the cause of what is termed ‘acute’ or ‘perfusion-limited’ hypoxia. Perfusion-limited hypoxia is characterized by rapidly changing oxygen concentrations in areas where blood flow through the vessel is unstable (Lanzen et al., 2006). As a result, cells may be exposed to oxygen concentrations that vary transiently between normal (well perfused) and anoxia
(complete vessel blockage) and anywhere in between. Examples of perfusion (acute) and
diffusion (chronic) hypoxia observed in experimental tumour models are shown in Fig. 16.2.
16.2 THE HETEROGENEITY OF TUMOUR HYPOXIA
Heterogeneity in severity (oxygen concentration)
Limitations in diffusion and in perfusion give rise to tumour cells at widely different oxygen levels. As cells are pushed away from blood vessels by the proliferation of cells close to the vessel, they experience a steady decline in oxygen availability. Eventually, these cells may reach distances where the oxygen concentration drops to zero and they can then die and contribute to the necrotic areas in the tumour. Diffusion-limited hypoxia, therefore, is characterized by an oxygen gradient where cells exist at all possible oxygen concentrations from normoxic to anoxic. Similarly, the limitations in perfusion that give rise to acute hypoxia can be complete or partial, resulting in surrounding tumour cells at varying oxygen tensions. As a result, both mechanisms of tumour hypoxia are expected to produce cells at a wide range of oxygen concentrations. Consistent with this prediction, direct measurements made in patients using polarographic oxygen electrodes have demonstrated the presence of a large range of oxygen concentrations. Vaupel and Hoeckel were among the first to use this technique in the clinic and an example of their data from a series of breast cancers and normal tissues is shown in Fig. 16.3. Immunohistological staining of tumour sections also reveals variable degrees of staining intensities that reflect the presence of cells at a wide range of oxygen concentrations (Fig. 16.2).
The fact that tumours contain cells at many different oxygen concentrations is an important factor to consider when assessing the consequences of tumour hypoxia. In fact, the term ‘hypoxia’ is rather ill-defined and can refer to different cell populations in different contexts. As discussed in Chapter 15, hypoxia-associated radioresistance results from the participation of oxygen in radiochemical events that take place immediately after irradiation. Thus, we can think
The heterogeneity of tumour hypoxia 219
(a) |
|
(b) |
|
|
|
(c) |
|
(d) |
(e) |
|
(f) |
|
|
|
Figure 16.1 Scanning electron micrographs of vascular corrosion casts of murine carcinomas (CaX and CaNT) and sarcoma (SaS) grown subcutaneously in mice. Photomicrographs on the left represent low magnifications (bars 500 μm) and photomicrographs on the right represent high magnifications (bars 100 μm). From Konerding et al. (1999), with permission. See colour plate section for full colour images.
of ‘radiobiological hypoxia’ as oxygen concentrations below those causing maximum resistance to radiation, about 0.02 per cent. However, oxygen also influences a number of biological responses that are controlled by several distinct molecular pathways. The sensitivity of these molecular pathways to oxygen deprivation can be very different from the relationship between oxygen concentration and radiosensitivity. For example,
activation of some molecular pathways reaches a maximum at much more moderate hypoxia (around 1–2 per cent O2). These biological responses may in turn affect many tumour properties that are important for treatment outcome, including the response to radiation. Therefore, the relevant fraction of hypoxic cells may be considerably different from the radiobiological hypoxic fraction.
(a)
(b)

The heterogeneity of tumour hypoxia 221
Despite this confusion about the definition of hypoxia, it has become commonplace in clinical situations to try to define the level of tumour hypoxia by a single number, the so-called hypoxic fraction. In Chapter 15, we emphasized the importance of considering cell viability and we
(%) |
10 |
|
|
|
|
|
|
|
N |
|
|
|
|
|
|
|
|
|
|
|
|
|
|
|
|
|
|
|
|
|
|
|
|
|
|
|
|
|
|
|
|
|
|
|
|
|
|
|
|
|
|
|||
|
|
|
|
|
|
|
|
|
|
|
|
|
|
|
|
|
|
|
|
|
|
|
|
|
|
|
|
|
|
|
|
|
|
|
|
|
|
|
|
|
|
|
|
|
|
|
|
|
||||||
8 |
|
|
|
|
|
|
|
|
|
|
|
|
|
|
|
|
|
|
|
|
|
|
|
|
|
|
|
|
|
|
|
|
|
|
|
|
|
|
|
|
|
|
|
|
|
|
|
|
|
|||||
|
|
|
|
|
|
|
|
|
|
|
|
|
|
|
|
|
|
|
|
|
|
|
|
|
|
|
|
|
|
|
|
|
|
|
|
|
|
|
|
|
|
|
|
|
|
|
|
|
|
|||||
frequency |
|
|
|
|
|
|
|
|
n |
|
|
|
|
|
|
|
|
|
|
|
|
|
|
|
|
|
|
|
|
|
|
|
|
|
|
|
|
|
|
|
|
|
|
|
|
|
|
|
|
|
|
|||
6 |
|
|
Median PO2 |
|
|
|
|
|
|
|
|
|
|
|
|
|
|
|
|
|
|
|
|
|
|
|
|
|
|
|
|
|
|
|
|
|
|
|
|
|
|
|
|
|
|
|||||||||
|
|
|
|
|
|
|
|
|
|
|
|
|
|
|
|
|
|
|
|
|
|
|
|
|
|
|
|
|
|
|
|
|
|
|
|
|
|
|
|
|
|
|
|
|
||||||||||
Relative |
4 |
|
|
|
|
|
|
|
|
|
|
|
|
|
|
|
|
|
|
|
|
|
|
|
|
|
|
|
|
|
|
|
|
|
|
|
|
|
|
|
|
|
|
|
|
|
|
|
|
|
|
|
|
|
|
|
|
|
|
|
|
|
|
|
|
|
|
|
|
|
|
|
|
|
|
|
|
|
|
|
|
|
|
|
|
|
|
|
|
|
|
|
|
|
|
|
|
|
|
|
|
|
|
|
|
|
|
||
2 |
|
|
|
|
|
|
|
|
|
|
|
|
|
|
|
|
|
|
|
|
|
|
|
|
|
|
|
|
|
|
|
|
|
|
|
|
|
|
|
|
|
|
|
|
|
|
|
|
|
|
|
|
|
|
|
|
|
|
|
|
|
|
|
|
|
|
|
|
|
|
|
|
|
|
|
|
|
|
|
|
|
|
|
|
|
|
|
|
|
|
|
|
|
|
|
|
|
|
|
|
|
|
|
|
|
|
|
||
|
|
|
|
|
|
|
|
|
|
|
|
|
|
|
|
|
|
|
|
|
|
|
|
|
|
|
|
|
|
|
|
|
|
|
|
|
|
|
|
|
|
|
|
|
|
|
|
|
|
|
|
|
|
|
(a) |
0 |
|
|
|
|
|
|
|
|
|
|
|
|
|
|
|
|
|
|
|
|
|
|
|
|
|
|
|
|
|
|
|
|
|
|
|
|
|
|
|
|
|
|
|
|
|
|
|
|
|
|
|
|
|
|
|
|
|
|
|
|
|
|
|
|
|
|
|
|
|
|
|
|
|
|
|
|
|
|
|
|
|
|
|
|
|
|
|
|
|
|
|
|
|
|
|
|
|
|
|
|
|
|
|
|
|
|
||
|
|
|
|
|
|
|
|
|
|
|
|
|
|
|
|
|
|
|
|
|
|
|
|
|
|
|
|
|
|
|
|
|
|
|
|
|
|
|
|
|
|
|
|
|
|
|
|
|
|
|
|
|
||
|
|
|
|
|
|
|
|
|
|
|
|
|
|
|
|
|
|
|
|
|
|
|
|
|
|
|
|
|
|
|
|
|
|
|
|
|
|
|
|
|
|
|
|
|
|
|
|
|
|
|
|
|
||
0 |
20 |
|
|
|
|
40 |
60 |
80 |
|
|
|
100 |
||||||||||||||||||||||||||||||||||||||||||
(%) |
15 |
|
|
|
|
|
|
|
|
|
|
|
|
|
|
|
|
|
|
|
|
|
|
|
|
|
|
|
|
|
|
|
|
|
|
|
(T 1 |
|
||||||||||||||||
|
|
|
|
|
|
|
|
|
|
|
|
|
|
|
|
|
|
|
|
|
|
|
|
|
|
|
|
|
|
|
|
|
|
|
|
|
||||||||||||||||||
|
|
|
|
|
|
|
|
|
|
|
|
|
|
|
|
|
|
|
|
|
|
|
|
|
|
|
|
|
|
|
|
|
|
|
|
|
||||||||||||||||||
|
|
|
|
|
|
|
|
|
|
|
|
|
|
|
|
|
|
|
|
|
|
|
|
|
|
|
|
|
|
|
|
|
|
|
|
N |
|
|||||||||||||||||
frequency |
10 |
|
|
|
|
|
|
|
|
|
|
|
|
|
|
|
|
|
|
|
|
|
|
|
|
|
|
|
|
|
|
|
|
|
|
|
|
|||||||||||||||||
|
|
|
|
|
|
|
|
|
|
|
|
|
|
|
|
|
|
|
|
|
|
|
|
|
|
|
|
|
|
|
|
|
|
|
|
n |
|
|||||||||||||||||
|
|
|
|
|
|
|
|
|
|
|
|
|
|
|
|
|
|
|
|
|
|
|
|
|
|
|
|
|
|
|
|
|
|
|
|
|
|
|||||||||||||||||
|
|
|
|
|
|
|
|
|
|
|
|
|
|
|
|
|
|
|
Median PO2 |
|
||||||||||||||||||||||||||||||||||
Relative |
5 |
|
|
|
|
|
|
|
|
|
|
|
|
|
|
|
|
|
|
|
|
|
|
|
|
|
|
|
|
|
|
|
|
|
|
|
|
|
|
|
|
|
|
|
|
|
|
|
|
|
|
|
|
|
|
|
|
|
|
|
|
|
|
|
|
|
|
|
|
|
|
|
|
|
|
|
|
|
|
|
|
|
|
|
|
|
|
|
|
|
|
|
|
|
|
|
|
|
|
|
|
|
|
|
|
|
|
||
|
|
|
|
|
|
|
|
|
|
|
|
|
|
|
|
|
|
|
|
|
|
|
|
|
|
|
|
|
|
|
|
|
|
|
|
|
|
|
|
|
|
|
|
|
|
|
|
|
|
|
|
|
|
|
|
0 |
|
|
|
|
|
|
|
|
|
|
|
|
|
|
|
|
|
|
|
|
|
|
|
|
|
|
|
|
|
|
|
|
|
|
|
|
|
|
|
|
|
|
|
|
|
|
|
|
|
|
|
|
|
|
|
|
|
|
|
|
|
|
|
|
|
|
|
|
|
|
|
|
|
|
|
|
|
|
|
|
|
|
|
|
|
|
|
|
|
|
|
|
|
|
|
|
|
|
|
|
|
|
|
|
|
|
|
|
|
|
|
|
|
|
|
|
|
|
|
|
|
|
|
|
|
|
|
|
|
|
|
|
|
|
|
|
|
|
|
|
|
|
|
|
|
|
|
|
|
|
|
|
|
|
|
|
|
|
|
|
|
|
|
|
|
|
|
|
|
|
|
|
|
|
|
|
|
|
|
|
|
|
|
|
|
|
|
|
|
|
|
|
|
|
|
|
|
|
|
|
|
|
|
|
|
|
|
|
|
|
|
|
|
|
|
|
|
|
|
|
|
|
|
|
|
|
|
|
|
|
|
|
|
|
|
|
|
|
|
|
|
|
|
|
|
|
|
|
|
|
|
|
|
|
|
|
|
|
|
|
|
|
|
|
|
|
|
|
|
|
|
|
|
|
0 |
20 |
|
|
|
|
40 |
60 |
80 |
|
|
|
100 |
|||||||||||||||||||||||||||||||||||||||||
(b) |
|
|
|
|
|
|
|
|
Oxygen partial pressure (mmHg) |
|
||||||||||||||||||||||||||||||||||||||||||||
Figure 16.3 Frequency distributions of oxygen partial pressures for normal breast tissue (a) and breast cancers (b). Measurements were performed with a polarographic O2-sensitive needle electrode with multiple recordings along three tracks for each patient. N, number of patients; n, number of measurements. From Vaupel et al. (1991), with permission.
defined the radiobiological hypoxic fraction as the fraction of viable radiation-resistant hypoxic cells. For assessments made by oxygen electrodes, the hypoxic fraction is usually defined as the fraction of measurements below some arbitrary low value of oxygen partial pressure, often 5 or 10 mmHg. For immunohistochemical detection with hypoxic markers (e.g. the nitroimidazoles), the hypoxic fraction is typically calculated as the fraction of cells that reach a certain threshold of staining intensity. In either case, the values arrived at are typically interpreted as a surrogate for the radiobiological hypoxic fraction. It is important to realize that because these thresholds are arbitrary and do not distinguish clonogenic from non-clonogenic cells, these two techniques will not necessarily give similar results and may not even correlate with each other. Furthermore when used in this way, both of these methods ignore potentially important hypoxic cells that lie above the threshold and, perhaps even more importantly, the variation in oxygen concentrations found within the tumour.
Heterogeneity in space
Hypoxia arising from either diffusion or perfusion limitations also gives rise to substantial intratumour heterogeneity in space. This spatial heterogeneity exists at the cellular level and is beautifully illustrated in immunologically stained tumour sections that cover a large area of the tumour (see Fig. 16.2, 16.4 and 16.11). This staining demonstrates the existence of steep oxygen gradients over distances of only a few cell diameters, contrasting with the common misconception that hypoxia is found mainly in the ‘cores’ of large tumours. In reality, hypoxia has the potential to exist around every blood vessel in the tumour and thus has no
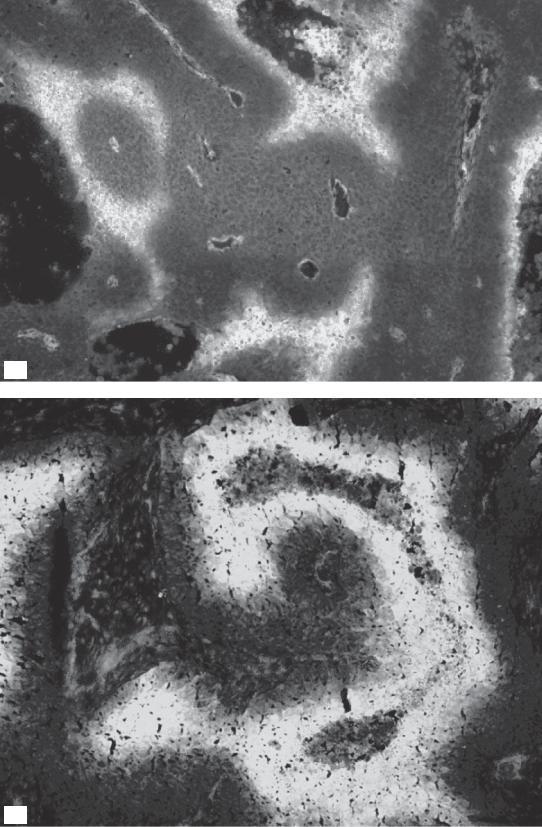
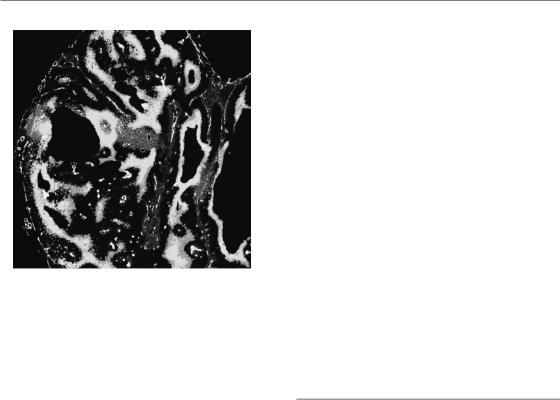
Figure 16.2 (a) Multimarker greyscale image of human mucoepidermoid carcinoma MEC82 grown as xenograft, with vasculature (white), Hoechst 33342 (blue) staining nuclei of cells adjacent to perfused vessel, first hypoxia marker (pimonidazole, green), and second hypoxia marker (CCI-103F, red). Spatial co-localization of both markers (red and green) appears as yellow. At an injection interval of 2 hours, most of the hypoxic cells were labelled by both the first and second hypoxia markers. Acute (or transient) hypoxia is illustrated as an area that was not hypoxic at the time of the injection of the first marker but had become hypoxic at the time of the second hypoxia marker injection (red only). From Ljungkvist et al. (2007), with permission. (b) Grayscale image of C38 murine colon carcinoma, showing vessels (red) and hypoxia stained by pimonidazole (green). From van Laarhoven et al. (2004), with permission from Elsevier. See colour plate section for full colour images.
222 The tumour microenvironment and cellular hypoxia responses
Figure 16.4 Composite binary image of a larger tumour area of the same tumour shown in Fig. 16.2a. See colour plate section for full colour image.
association with tumour size. The misconception of ‘central tumour hypoxia’ may stem from the common observation of central necrotic regions in human tumour xenografts grown in mice. However, in human tumours, hypoxia typically exists throughout the tumour volume, albeit at greater levels in certain tumour regions.
The extent of spatial oxygen heterogeneity also has implications for the way in which tumour hypoxia is evaluated in the clinic. It is important to obtain a sufficient number of measurements in different parts of the tumour in order to get a picture of the overall level of hypoxia and its variation, a task that is difficult with immunohistochemical techniques that are often limited to small biopsies. In this situation, one is forced to assume that the biopsy is representative of the overall tumour. This may often not be the case, as demonstrated by noninvasive imaging of positron emission tomography (PET) labelled hypoxia probes (e.g. misonidazole) that are able to assess the entire tumour volume. These PET images often show macroscopic ‘hot spots’ where hypoxia is more common.
Measurements in the clinic using oxygen probes are performed along more than one track in the tumour, with several samplings along each track.
This gives rise to a frequency histogram that should reasonably reflect the overall distribution of oxygen
values. However, a word of caution is appropriate here since not only does this technique lose all spatial information, but each measurement made by the oxygen electrode represents an average concentration over a volume that contains several hundred cells. It is likely that oxygen gradients exist even within these volumes. Consequently, the actual cellular oxygen concentration will not be the same as that measured by the electrode. This ‘averaging’ problem is even greater with non-invasive techniques to image hypoxia. In this case, each imaging voxel can contain thousands or millions of cells. The limitations of all methods to reflect the true spatial heterogeneity (microscopic or macroscopic) is something that needs to be considered in the ongoing efforts to target radiotherapy specifically to hypoxic areas in tumours. Although areas with a larger proportion of hypoxic cells can receive higher doses, it will never be possible to specifically target all hypoxic tumour cells.
Heterogeneity in time
The biological consequences of hypoxia are influenced not only by the severity of oxygen deprivation, but also by the length of time that cells are exposed to this stress. If we consider diffusion-limited hypoxia, the oxygen concentration is expected to decrease as a function of distance away from the vessel. Owing to cellular proliferation in well-oxygenated areas close to the vessel, individual cells within a diffusion-limited gradient experience a slow decline in oxygen concentration over time as they are gradually pushed away from the vessel. The rate at which cells move through this gradient, and thus the length of exposure to various oxygen concentrations, is determined by the rate of cell proliferation. This can vary dramatically from one tumour to another, and even within different regions of the same tumour. Consequently, the lifetime of hypoxic tumour cells ranges from hours to days.
Much more rapid and dramatic oxygen fluctuations can occur as a result of limited perfusion as a vessel shuts down or reopens. Transient hypoxia has been convincingly demonstrated using several different methods in experimental tumours. For example, serial administration of two different
The heterogeneity of tumour hypoxia 223
cells |
60 |
|
|
|
|
|
|
|
|
|
|
|
|
|
|
|
|
|
|
|
|
|
|
|
|
|
|
|
|
|
|
|
|
|
|
|
|
|
|
|
|
|
|
|
|
|
|
|
|
|
|
|
|
|
|
||
|
|
|
|
|
|
|
|
|
|
|
|
|
|
|
|
|
|
|
|
|
|
|
|
|
|
|
|
|
|
|
|
|
|
|
|
|
|
|
|
|
|
|
|
|
|
|
|
|
|
|
|
|
|
|
|
|
|
|
|
|
|
|
|
|
|
|
|
|
|
|
|
|
|
|
|
|
|
|
|
|
|
|
|
|
|
|
|
|
|
|
|
|
|
|
|
|
|
|
|
|
|
|
|
|
|
|
|
|
|
|
|
|
|
|
|
|
|
|
|
|
|
|
|
|
|
|
|
|
|
|
|
|
|
|
|
|
|
|
|
|
|
|
|
|
labelled-pimo |
50 |
|
|
|
|
|
|
|
|
|
|
|
|
|
|
|
|
|
|
|
|
|
|
|
|
|
|
|
|
|
|
|
|
|
|
|
|
|
|
|
|
|
|
|
|
|
|
|
|
|
|
|
|
|
|
||
|
|
|
|
|
|
|
|
|
|
|
|
|
|
|
|
|
|
|
|
|
|
|
|
|
|
|
|
|
Per cent |
40 |
|
|
|
|
|
|
|
|
|
|
|
|
|
|
|
|
|
|
|
|
|
|
|
|
|
|
|
|
|
|
|
|
|
|
|
|
|
|
|
|
|
|
|
|
|
|
|
|
|
|
|
|
|
|
||
|
|
|
|
|
|
|
|
|
|
|
|
|
|
|
|
|
|
|
|
|
|
|
|
|
|
|
||
30 |
|
|
|
|
|
|
|
|
|
|
|
|
|
|
|
|
|
|
|
|
|
|
|
|
|
|
|
|
|
|
|
|
|
|
|
|
|
|
|
|
|
|
|
|
|
|
|
|
|
|
|
|
|
|
|
||
|
|
|
|
|
|
|
|
|
|
|
|
|
|
|
|
|
|
|
|
|
|
|
|
|
|
|
||
|
|
|
|
|
|
|
|
|
|
|
|
|
|
|
|
|
|
|
|
|
|
|
|
|
|
|
|
|
|
|
|
|
|
|
|
|
|
|
|
|
|
|
|
|
|
|
|
|
|
|
|
|
|
|
|
|
|
|
|
|
|
|
|
|
|
|
|
|
|
|
|
|
|
|
|
|
|
|
|
|
|
|
|
|
|
|
|
|
|
|
|
|
|
|
|
|
|
|
|
|
|
|
|
|
|
|
|
|
|
|
|
|
|
|
|
0 |
2 |
4 |
6 |
8 |
Time (hours)
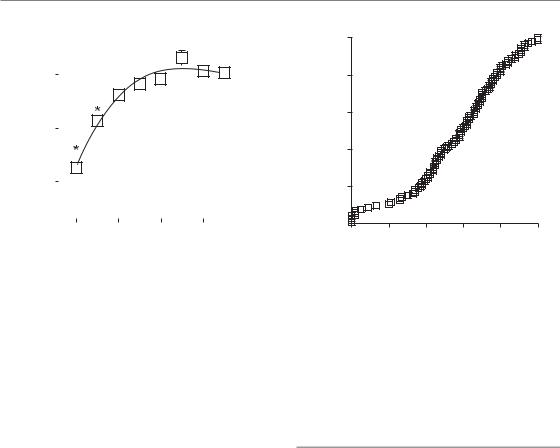
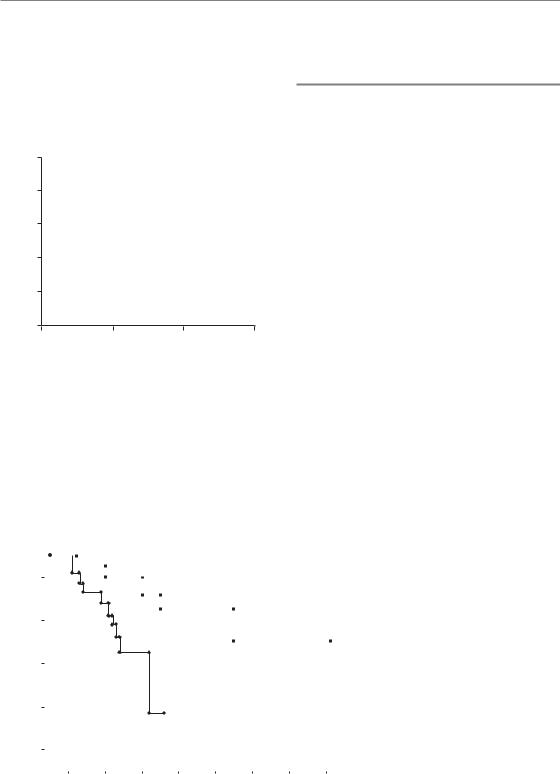
Figure 16.5 Percentage of SiHa tumour cells (human cervical squamous carcinoma) labelled with pimonidazole (pimo) as a function of labelling time. Tumours were grown subcutaneously in mice which were administered pimo by i.p. injection hourly before tumour excision. Tumours were processed to a single-cell suspension and the pimonidazole signal detected by flow cytometry. From Bennewith and Durand (2004), with permission.
hypoxia-specific markers analysed by immunohistochemistry identifies cells that stain for only one of the two markers (Fig 16.2 and Fig 16.4). This indicates that these cells were sufficiently hypoxic at one of the times to stain for hypoxia, but not at the other. Similarly, if a hypoxia marker is administered in a short pulse (1 hour), a much smaller number of cells are labelled than when it is given for a longer period of time (Fig. 16.5). This is due to the fact that many cells are only transiently hypoxic during this period. Continuous recordings from spatially fixed oxygen probes have also directly demonstrated temporal fluctuations in oxygenation (Lanzen et al., 2006). The results from these studies indicate that a substantial proportion of tumour cells experience transient periods of hypoxia lasting less than 1 hour.
The potentially rapid changes in oxygenation associated with perfusion-limited hypoxia present an additional problem associated with attempts to measure oxygenation in patient tumours. Such measurements are typically made only once, and it is unclear how representative they are of the actual oxygenation during treatment.
|
100 |
|
frequency |
80 |
|
60 |
||
Cumulative |
||
40 |
||
|
||
|
20 |
|
|
0 |
0 |
20 |
40 |
60 |
80 |
100 |
Hypoxia by Eppendorf electrodes
Figure 16.6 Cumulative frequency of tumour oxygenation in 105 patients with primary uterine cervical cancer. Measurements were performed with a polarographic O2-sensitive needle electrode with multiple recordings along three tracks for each patient. The percentage of measurements 5 mmHg (HP5) was used as a parameter for tumour oxygenation status. Adapted from Nordsmark et al. (2006), with permission.
Heterogeneity amongst patients
Although there is large intratumour spatial and temporal heterogeneity, the variability in oxygenation between different tumours is even greater. Tumours with similar clinical characteristics can display very different patterns and overall levels of hypoxia at any given time. Figure 16.6 illustrates this fact using data obtained from a group of cervical tumours whose oxygenation status was determined using an oxygen electrode (Nordsmark et al., 2006). In these cases, the hypoxic fraction within a tumour was defined as the percentage of oxygen readings which were less than 5 mmHg. Defined in this way, the hypoxic fraction of individual tumours ranged from 0 to 100 per cent across 105 cervical cancers. About half of the tumours had hypoxic fractions above 50 per cent.
The heterogeneity in oxygenation among different patients is one of the features of tumour hypoxia that makes it so interesting to study. Because oxygenation differs markedly among patients, it can be used as a factor to categorize otherwise similarly presenting patients into different
224 The tumour microenvironment and cellular hypoxia responses
prognostic subgroups that may receive different treatment. Indeed, a recent multicentre metaanalysis identified the hypoxic fraction measured by oxygen electrodes as the most significant negative prognostic factor in radiotherapy-treated head and neck cancer (Fig. 16.7).
|
100 |
|
|
|
|
80 |
|
|
|
(%) |
|
|
|
|
survival |
60 |
|
|
|
|
|
|
|
|
|
|
|
|
Less hypoxic |
Overall |
40 |
|
|
|
20 |
|
|
More hypoxic |
|
|
|
|
||
|
0 |
|
|
|
|
0 |
1 |
2 |
3 |
|
|
Follow-up (years) |
|
|
Figure 16.7 Overall survival rate for 397 patients with primary head and neck cancers. Measurements were performed with polarographic O2-sensitive needle electrodes with multiple recordings along 5 tracks for each patient. Thin and bold lines represent patients with less or more hypoxic tumours, respectively. More hypoxia was defined as a patient having more than
19 per cent of measurements yielding less than 2.5 mmHg O2. From Nordsmark et al. (2005), with permission.
16.3 HYPOXIA AND ITS ASSOCIATION WITH THE MALIGNANT PHENOTYPE
The long-standing interest in tumour hypoxia within the radiation oncology community stems primarily from its association with radioresistance (see Chapter 15) and this aspect certainly remains an important contributor to patient response in the clinic (Tatum et al., 2006). However, clinical studies also support a role for hypoxia that is unrelated to treatment sensitivity. For example, in a study of uterine cervix cancers treated with surgery alone, patients with more hypoxic tumours had poorer disease-free and overall survival and more frequent parametrial spread as well as lymph–vascular space involvement (Fig. 16.8). This study, albeit small, indicated that hypoxic tumours are somehow biologically different from well-oxygenated tumours. Similarly, several clinical studies have demonstrated that hypoxia is a strong predictor for the presence of distant metastasis (e.g. Brizel et al., 1996).
Although a correlation between hypoxia and tumour progression, infiltration and metastasis has been established, these correlative studies cannot address whether this is a cause-and-effect relationship. In other words, is the increased malignancy a result of tumour hypoxia or is tumour hypoxia a
Overall survival probability
1.0 |
|
|
|
|
|
|
|
|
|
|
Surgery |
|
|
|
|
|
|
|
|
|
||
|
|
|
|
|
|
|
|
|
|
|
|
|
|
|
|
|
|
|
||||
0.8 |
|
|
|
|
|
|
|
|
|
|
|
|
PO2 |
|
|
|
|
Figure 16.8 Overall survival probability |
||||
|
|
|
|
|
|
|
|
|
|
|
|
|
|
|
|
|
|
|||||
|
|
|
|
|
|
|
|
|
|
|
|
|
|
|
|
|
|
|||||
|
|
|
|
|
|
|
|
|
|
|
|
|
|
|
|
|
|
|||||
|
|
|
|
|
|
|
|
|
|
|
|
|
|
|
|
|
|
|
||||
|
|
|
|
|
|
|
|
|
|
|
|
|
|
|
|
|
|
|
||||
0.6 |
|
|
|
|
|
|
|
|
|
|
|
|
|
|
|
n |
|
|
|
|
||
|
|
|
|
|
|
|
|
|
|
|
|
|
|
|
|
|
|
|
|
|
for 47 patients with uterine cervix |
|
|
|
|
|
|
|
|
|
|
|
|
|
|
|
|
|
|
|
|
||||
|
|
|
|
|
|
|
|
|
|
|
|
|
|
|
|
|
|
|
|
|
|
cancer treated with primary surgery. |
0.4 |
|
|
|
|
|
|
|
|
|
|
|
|
|
|
|
|
|
|
|
|
|
Measurements were performed with |
|
|
|
|
|
|
|
|
|
|
|
|
|
|
|
|
|
|
|
|
|
polarographic O2-sensitive needle |
|
|
|
|
|
|
|
|
|
|
|
|
|
|
|
|
|
|
|
|
|
|
|
|
|
|
|
|
|
|
|
|
|
|
PO2 |
|
|
|
|
|
|
|
|
|
|
electrodes with multiple recordings |
|
0.2 |
|
|
|
|
|
|
|
|
|
|
|
|
|
|
|
|
|
|
|
along two tracks for each patient. Full or |
||
|
|
|
|
|
|
|
|
|
|
|
|
|
|
|
|
|
||||||
|
|
|
|
|
|
|
|
|
|
n |
|
|
|
|
|
|
|
|
|
|
broken lines represent patients with |
|
|
|
|
|
|
|
|
|
|
|
|
|
|
|
|
|
|
|
|
|
|
|
|
0.0 |
|
|
Log-rank p |
|
|
|
|
|
|
|
|
|
|
|
|
|
|
median partial pressure of oxygen (PO2) |
||||
|
|
|
|
|
|
|
|
|
|
|
|
|
|
|
|
|
|
|
|
|
higher or lower than 10 mmHg |
|
|
|
|
|
|
|
|
|
|
|
|
|
|
|
|
|
|
|
|
|
|
||
|
|
|
|
|
|
|
|
|
|
|
|
|
|
|
|
|
|
|
|
|||
0 |
10 |
|
|
20 |
30 |
40 |
50 |
60 |
70 |
80 respectively. From Hoeckel et al. (1996), |
||||||||||||
|
|
|
|
|
|
|
|
|
|
|
Time (months) |
|
|
|
|
|
|
with permission. |
||||
Hypoxia and tumour malignancy 225
consequence of a more malignant tumour? This is not an easy question to answer and there is evidence supporting both of these possibilities.
16.4 HYPOXIA AND TUMOUR MALIGNANCY
Data from the laboratory and experimental tumour models indicate that hypoxia influences malignancy through at least three distinct mechanisms. The first is through the activation of physiological responses that facilitate adaptation to low oxygen, for example by increasing the rates of anaerobic glycolysis and angiogenesis. The second occurs by providing an adverse environment that allows the selection and outgrowth of cells that have increased tolerance to hypoxia and possibly other forms of stress. Finally, hypoxia has been shown to alter DNA repair capacity and to promote genomic instability in ways that can accelerate tumourigenesis.
Hypoxia-driven adaptation
During evolution, organisms have developed a number of different pathways whose function is to allow adaptation to low oxygen availability (Harris, 2002). Adaptation occurs at the cellular, tissue and whole-animal level. For example, hypoxia associated with high altitude causes increased production of erythropoietin (EPO), which stimulates uptake of oxygen by promoting the differentiation of red blood cells and synthesis of the oxygen carrier haemoglobin as well as endothelial cell proliferation. Similarly, during heavy exercise, oxygen consumption may exceed supply in muscle and cause hypoxia. The muscle cells respond to hypoxia by increasing their capacity to carry out anaerobic metabolism in order to produce sufficient ATP. The byproduct of anaerobic metabolism is lactate which causes pain in the muscles, a signal that exercise should be reduced. Hypoxia is also a powerful regulator of angiogenesis in both tumours and normal tissues. In fact, cellular responses to hypoxia play a fundamental role in controlling normal development of our vascular system.
Increased red blood cell and haemoglobin production, anaerobic metabolism and angiogenesis
are adaptive processes that act to improve cellular oxygen supply and maintain energy homeostasis. Cancer cells use these same physiological response pathways to support the growth and spread of tumours. They switch to glycolysis for energy production and stimulate angiogenesis to improve oxygenation. In many cases, cancer cells have even undergone genetic alterations that allow them to hijack physiological responses to hypoxia, and they exhibit high rates of anaerobic metabolism and angiogenesis even during well-oxygenated conditions. This can occur through mutations in genes that regulate the hypoxic molecular response pathways to render them constitutively ‘on’ even during aerobic conditions. As noted above, however, tumour hypoxia persists despite high tumour vascularization, owing to poor organization and functionality of these vessels.
Hypoxia-driven selection of malignant cells
Despite adaptation, oxygen deficiency ultimately becomes toxic and results in cell death if it is severe and long-lasting. In a normal organism, this toxicity is often dealt with in a controlled manner by the induction of a highly regulated death process termed apoptosis. In this regard, the adverse clinical effect of tumour hypoxia may seem surprising, since one might expect hypoxia itself to be toxic to the tumour cells. Unfortunately, tumour cells are generally tolerant to hypoxia. This is partly because they often have mutations in genes that regulate apoptosis. In fact, hypoxia itself can evoke selection pressure against apoptosis-susceptible cells and thereby also promote the overall malignant potential of the tumour.
This principle of hypoxia-mediated selection has been elegantly illustrated in an experiment where rare cells that lack the tumour suppressor gene p53 (p53 knockout cells) are mixed with identical cells where p53 is functional and then exposed to periods of hypoxia (Graeber et al., 1996). p53 is required for the induction of apoptosis in response to many stimuli, including hypoxia, and the knockout cells are therefore resistant to apoptosis. In the mixing experiment, the cells with functional p53 die during oxygen
226 The tumour microenvironment and cellular hypoxia responses
Cell with |
Selective |
Hypoxia- |
|
survival |
|||
mutation |
tolerant |
||
in hypoxic |
|||
in p53 |
tumour |
||
areas |
|||
|
|
Hypoxiainduced apoptosis
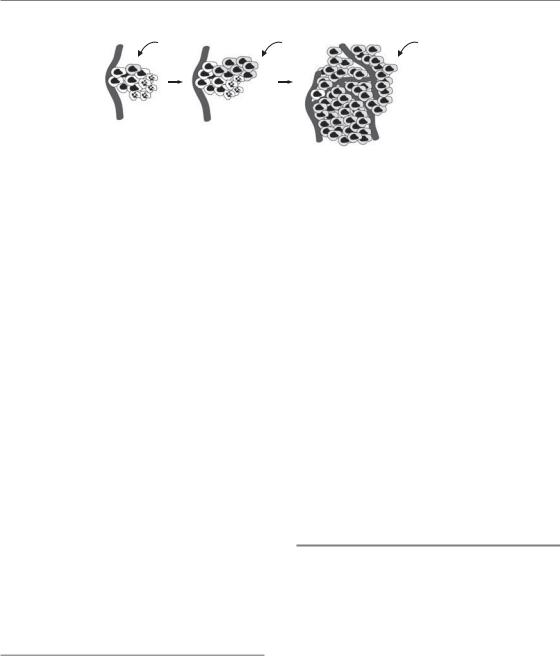
Figure 16.9 Selection of apoptosis-resistant cells in a hypoxic microenvironment. Early in tumour genesis, apoptosissusceptible cells die rapidly if they experience hypoxia. In the genetically unstable tumour, a clonal mutation in an apoptosis gene (e.g. p53) arises that makes a cell resistant to hypoxia-induced death. Owing to its extended lifespan, this clone expands relative to the wild-type cells and eventually its progeny dominate the tumour mass.
deficiency, while the p53 knockout cells survive. The p53 knockout cells thus rapidly outgrow their counterparts and eventually dominate the cell population (Fig. 16.9). One can easily envisage this selection process occurring in a genetically unstable tumour. Single cells with random mutations that cause tolerance to hypoxia will have a growth advantage and expand relative to the other cells. Thus, hypoxia can act as a strong selective force during tumour development.
The selection of cells with increased hypoxia tolerance can occur through a number of different ways affecting various molecular pathways. Importantly, the genetic alterations selected for by hypoxia may also render the cells resistant to other forms of stress. Consequently a high level of tumour hypoxia may indicate that the tumour cells not only have a unique ability to survive against hypoxic exposure, but also an increased ability to survive during radiotherapy or other forms of cancer treatment. In other words, hypoxia can co-select highly resistant or highly malignant cells.
Hypoxia and genetic instability
Tumour progression is linked to the acquisition of a series of genetic changes and development of cancer is often accelerated by genetic instability (Bristow and Hill, 2008). Increased genetic instability can occur through mutations in genes that are responsible for the correct repair of damaged DNA, but may also occur during conditions of cell stress including hypoxia. Reporter gene and genomic minisatellite assays have shown that cells
have increased mutation frequency and genetic instability when grown in the microenvironment of tumours compared with growth in vitro. Hypoxia and reoxygenation also causes aberrant DNA synthesis, leading to over-replication and gene amplification, which are other frequent alterations observed in cancer cells. Cycling oxygenation has particularly been linked to DNA damage through the production of reactive oxygen species (ROS) upon reoxygenation. This is accompanied by reduced expression of DNA repair genes under subsequent hypoxic conditions and functional decreases in the nucleotide excision repair (NER), mismatch repair (MMR) and homologous recombination (HR) pathways.
16.5 HYPOXIA RESPONSE PATHWAYS
Since hypoxia response pathways contribute to both hypoxia tolerance and overall malignancy, there is great interest in understanding these responses at the molecular level. Ultimately, this knowledge should lead to the development of hypoxia-specific biomarkers and new molecular targeting agents that can be tested in the clinic. Many of the biological changes that occur during hypoxia result from changes in gene expression, a process that is affected at many different levels, including chromatin remodelling, transcription, mRNA modification, mRNA translation and protein modifications. Although there are examples where hypoxia can affect gene expression at all of these levels, two in particular have emerged as important regulators of the biological changes
Hypoxia-inducible factor 227
PHD
O2 |
VHL |
HIF-1 |
||
OH |
OH |
|||
|
degradation |
|||
|
|
|
||
HIF-1 
 HIF-1
HIF-1
HIF-1
HIF-1 HIF-1
HRE
HIF-1 targets
|
|
Angiogenesis |
|
|
VEGF |
|
Glycolysis |
|
Tumour growth |
GLUT-1 |
|
|
||
|
|
and spread |
||
CA9 |
|
|
|
|
|
Metastasis |
|
|
|
.... |
|
|
|
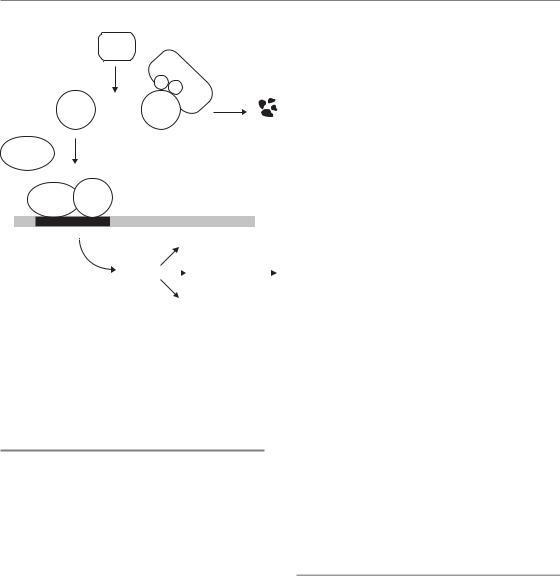
Figure 16.10 The regulation of hypoxiainducible factor-1 (HIF-1). During normoxia, HIF-1α is hydroxylated by the PHD enzymes. This makes it a substrate for VHL–mediated proteasomal degradation. In the absence of oxygen, HIF-1α is stabilized and can dimerize with its partner HIF-1β to form the transcription factor HIF-1. This factor binds hypoxia–responsive elements (HRE) in the promoter of its target genes, resulting in increased transcription. These target genes regulate angiogenesis, metabolism and metastasis.
caused by hypoxia. These are changes in transcription and changes in mRNA translation.
16.6 HYPOXIA-INDUCIBLE FACTOR (HIF): THE MASTER TRANSCRIPTIONAL REGULATOR OF HYPOXIC RESPONSES
Many of the known changes in biology that occur during hypoxia in humans and other organisms are controlled by the activation of the HIF family of transcription factors (Semenza, 2007b). This is summarized in Fig. 16.10. The most widely expressed family member is HIF-1, although HIF- 2 also functions in various cell types. Both HIF-1 and HIF-2 have similar functions and they regulate the transcriptional induction of more than 100 different known genes during hypoxia. These HIF targets regulate several important processes including erythropoiesis, metabolism, angiogenesis, invasion, proliferation and cell survival.
The HIF transcription factors consist of a constitutively expressed HIF-1β subunit, and an oxygen-sensitive HIF-1α or HIF-2α subunit. When oxygen is present, HIF-1α and HIF-2α are synthesized normally, but are unstable and degraded with a half-life of only about 5 min. Their degradation occurs because during aerobic conditions two proline amino acids are hydroxylated by enzymes known as the HIF PHDs (prolyl
hydroxylases) that use molecular oxygen as a cofactor. When they are hydroxylated, HIF-1αand HIF-2α are recognized by the von Hippel–Lindau (VHL) protein and targeted for ubiquitination and degradation. Under hypoxic conditions, HIF-1α and HIF-2α cannot be hydroxylated and thus are not recognized by VHL. This leads to their stabilization, allowing them to bind the HIF-1βsubunit and activate gene transcription. Interestingly, the PHDs are themselves HIF transcriptional targets, thus establishing a negative feedback loop following the activation of HIF.
HIF activity as a hypoxia biomarker
The reduction in oxygen concentration required to stabilize and activate HIF is much less than that necessary to induce radioresistance. The dependency of HIF on oxygen concentration is determined by the enzymes that hydroxylate HIF-1α and HIF-2α. The HIF PHDs have a comparatively high Km for oxygen. Thus, HIF becomes active when oxygen concentrations drop to only 1 or 2 per cent oxygen – a level that would cause virtually no increase in radioresistance. Consequently, the fraction of cells expressing HIF or HIF-dependent genes in a tumour can be significantly greater than the fraction of radiation-resistant cells. This is an important consideration in clinical studies that
228 The tumour microenvironment and cellular hypoxia responses
|
SCCNij 51 |
|
SCCNij 58 |
|
|
|
|
(a) |
|
(b) |
|
|
|
|
|
(c) |
|
(d) |
|
|
|
(e) |
|
(f) |
(g) |
|
(h) |
|
|
|

Hypoxia and protein synthesis 229
have investigated so-called ‘endogenous’ hypoxia markers. Several HIF target genes, including carbonic anhydrase 9 (CA9), glucose transporter 1 or 3 (GLUT-1, GLUT-3) and vascular endothelial growth factor (VEGF) have been used in studies to assess hypoxia. These markers are assessing HIF activity and thus reflect the type of hypoxia necessary to activate it. One should not expect that this will necessarily also reflect the radiobiological hypoxic fraction or the hypoxic fraction measured through other methods (Fig 16.11).
Although HIF is controlled primarily through oxygen, several common genetic alterations in cancer result in hypoxia-independent regulation of HIF-1α. VHL is a classic tumour suppressor gene, and its loss prevents degradation of HIF-1α and HIF-2α. Consequently, VHL-deficient tumours show constitutive HIF activity, and greatly enhanced angiogenesis. Oncogenic activation of the PI3-kinase and Ras pathways has also been reported to influence HIF-1α protein levels. This regulation also needs to be taken into account when using HIF targets as biomarkers of hypoxia. In some cases, HIF activation may occur in ways that are largely independent of hypoxia.
HIF as a target for therapy?
The activation of HIF and its target genes may be highly clinically relevant despite not always reflecting tumour hypoxia. The malignant cancer phenotype is highly linked to processes such as angiogenesis, metastasis and glycolysis which can all be stimulated by activation of HIF. Genetic alterations that cause constitutive activation of the HIF pathway can therefore be envisaged to both promote and reflect malignancy. On the basis of this, there is great interest in evaluating HIF and its transcriptional targets as prognostic factors, even in the absence of a direct correlation with hypoxia (Semenza, 2007a). Furthermore, the central role that HIF plays in regulating gene
expression has caused widespread interest in its potential as a molecular target in cancer therapy. HIF-mediated gene expression presumably helps cells to survive better during low oxygen availability, so disrupting this signalling in tumours is expected to promote hypoxia-induced death. In this way, targeting HIF in cancer therapy can be seen as an attractive approach to complement radiotherapy, which kills well-oxygenated cells. The current efforts to target HIF have been spurred on by a detailed understanding of how HIF is regulated at the molecular level. This knowledge provides a basis for the targeting approach and makes the rational design of specific small-molecule inhibitors feasible. Experiments in vitro and in vivo have also provided some proof- of-principle supporting this approach. These studies have shown that cells which have been genetically engineered to lack functional HIF-1 die more rapidly from hypoxic stress and form fewer and slower growing tumours in animal models. A somewhat improved response to radiation has also been achieved experimentally when HIF has been targeted in established tumours using genetic approaches. It remains to be seen whether these encouraging results can be repeated and further improved with drugs that can be administered in the clinic.
16.7 HYPOXIA AND PROTEIN SYNTHESIS
Although HIF-mediated changes in transcription are important, they do not explain all of the biological changes that occur during hypoxia. On a genome-wide scale, a comparable number of genes are influenced through changes in their rate of protein synthesis. In light of the often acute and transient nature of hypoxic stress, it is not surprising that cells utilize fast-responding and reversible mechanisms such as those regulating protein synthesis (Wouters et al., 2005). Protein synthesis
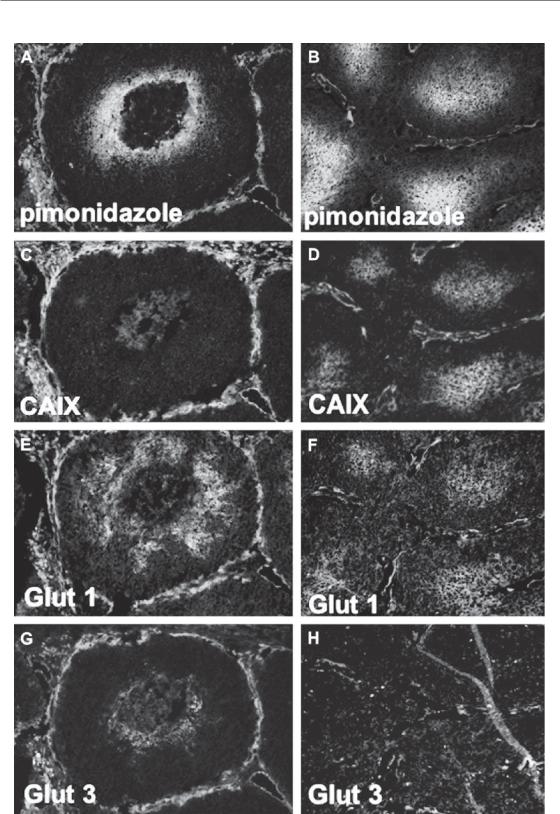
Figure 16.11 Different expression of hypoxia markers in two human squamous cell carcinoma xenograft models (SCCNij51 and SCCNij58). The images show the differences in localization of the exogenous marker pimonidazole
(a and b) compared with three endogenous hypoxic markers: CAIX (c, d), GLUT-1 (e, f) and GLUT-3 (g, h) (all in green), relative to the vasculature (in red). From Rademakers et al. (2008), with permission from Elsevier. See colour plate section for full colour images.
230 The tumour microenvironment and cellular hypoxia responses
mTOR Hypoxia
4E
CAP |
AUG |
|
Energy |
4A |
|
|
homeostasis |
4G |
|
|
|
|
|
|
|
|
3 |
Inhibition of |
|
|
protein synthesis |
Selective |
|
|
|
||
|
|
|
|
|
2α |
|
protein |
Small |
|
expression |
|
|
|
||
|
|
|
|
ribosomal subunit |
UPR |
|
|
|
|
|
Hypoxia
Figure 16.12 Hypoxic regulation of mRNA translation. Hypoxia causes phosphorylation and inhibition of the eukaryotic initiation factor 2 subunit α (eIF2α), preventing it from recruiting aminoacylated tRNA to the ribosome. Hypoxia also inhibits the interaction between eIF4E and eIF4G at the mRNA 5’ cap structure, thereby preventing ribosome recruitment to the mRNA. This occurs through both mTOR-dependent and -independent mechanisms.
rates drop significantly during hypoxia because of a reduction in the rate at which mRNA transcripts are translated into protein. Protein synthesis is one of the most energy-consuming processes in the cell. Inhibition of protein synthesis in response to hypoxia has therefore been regarded as a means to conserve energy and maintain homeostasis.
The pathways that affect overall levels of protein synthesis during hypoxia (discussed below) also differentially influence specific genes through two different mechanisms. First, because proteins have different half-lives, inhibition of protein synthesis causes a selective enrichment of stable over labile proteins. This can alter cellular behaviour because several processes, including apoptosis, are regulated by the balance of proteins with different stability. Second, although overall levels of protein synthesis are reduced during hypoxia, this is a stringently regulated process that affects the production of individual proteins to a highly varying degree. The rate of synthesis of a particular gene product is determined by elements in the untranslated regions (UTRs) of its mRNA. These regions do not affect the composition of the protein, but instead function to regulate the stability and translation of the mRNA transcript. The mRNAs of some proteins contain elements in their UTRs that render them less affected by
hypoxia, and synthesis of some transcripts is even stimulated under hypoxic conditions. It is now recognized that regulation of mRNA translation has an important impact on the cellular proteome during hypoxia, especially at early times when it dominates the slower transcriptional responses.
mTOR and regulation of translation initiation
One of the ways that hypoxia affects protein synthesis is through inhibition of the mammalian target of rapamycin (mTOR) kinase signalling pathway (Koumenis and Wouters, 2006) as summarized in Fig. 16.12. This occurs in response to long-lasting moderate hypoxia (around 0.5 per cent O2). Signalling through the mTOR pathway stimulates translation by increasing the availability of a rate-limiting eukaryotic mRNA translation initiation factors (eIF) called eIF4E. During hypoxic conditions, eIF4E becomes inactivated leading to reduced rates of protein synthesis. Because of its ability to control protein synthesis, mTOR is recognized as an important regulator of overall cellular metabolism and many different receptor signalling pathways influence cell growth and proliferation by this process. Consequently,

Bibliography 231
mTOR is sensitive not only to oxygen but also to changes in energy levels and nutrient supply. Interestingly, many of the signalling pathways that converge on mTOR are frequently altered in cancer and lead to activation of mTOR and high rates of protein synthesis and proliferation as part of the oncogenic process. Possible tumour-specific regulation (or dysregulation) of the mTOR pathway has led to considerable interest in targeting this protein, and inhibitors such as rapamycin are currently in clinical trials in combination with other modalities including radiotherapy.
Endoplasmic reticulum stress and the unfolded protein response
Under more severe hypoxic conditions (less than about 0.02 per cent oxygen) hypoxia causes a rapid and more severe inhibition of protein synthesis (Wouters et al., 2005). This effect results from the phosphorylation and inactivation of a subunit (α) of another important translation initiation factor, eIF2 (Fig. 16.2). The function of eIF2 is to recruit the first amino acid (methionine) to the mRNA transcript during the initiation of protein synthesis. Phosphorylation of eIF2α during hypoxia is carried out by activation of an endoplasmic reticulum (ER) transmembrane kinase called PERK. This kinase senses ER stress as part of a larger process called the unfolded protein response (UPR). During the UPR, PERK and two other proteins known as IRE-1 and ATF6 are activated as a consequence of the accumulation of unfolded or misfolded proteins within the ER. Together, these proteins function to prevent further ER stress both by inhibiting new protein synthesis and by increasing the folding capacity of the ER. Both PERK and IRE-1 are activated during hypoxia, suggesting that hypoxia may cause ER stress through protein misfolding and/or aggregation. It is believed that activation of the UPR during hypoxia protects cells against ER stress. Indeed, similar to HIF-1, genetically modified cells that lack proper ER stress responses mediated by either PERK or IRE-1 are sensitive to hypoxia and form slower growing tumours. Therefore,
PERK and IRE-1 might also be future targets for oxygen-directed molecular cancer therapy.
Key points
1.Tumour oxygenation is heterogeneous with respect to severity, time and space.
2.Most tumours have some hypoxic cells.
3.High levels of hypoxia are associated with poor treatment outcome.
4.Hypoxia can select for outgrowth of cells with mutations.
5.Cellular responses to hypoxia influence malignancy.
■BIBLIOGRAPHY
Bennewith KL, Durand RE (2004). Quantifying transient hypoxia in human tumor xenografts by flow cytometry. Cancer Res 64: 6183–9.
Bristow RG, Hill RP (2008). Hypoxia and metabolism. Hypoxia, DNA repair and genetic instability. Nat Rev Cancer 8: 180–92.
Brizel DM, Scully SP, Harrelson JM et al. (1996). Tumor oxygenation predicts for the likelihood of distant metastases in human soft tissue sarcoma. Cancer Res 56: 941–3.
Graeber TG, Osmanian C, Jacks T et al. (1996). Hypoxiamediated selection of cells with diminished apoptotic potential in solid tumours. Nature 379: 88–91.
Harris AL (2002). Hypoxia – a key regulatory factor in tumour growth. Nat Rev Cancer 2: 38–47.
Hoeckel M, Schlenger K, Aral B, Mitze M, Schaffer U, Vaupel P (1996). Association between tumor hypoxia and malignant progression in advanced cancer of the uterine cervix. Cancer Res 56: 4509–15.
Konerding MA, Malkusch W, Klapthor B et al. (1999). Evidence for characteristic vascular patterns in solid tumours: quantitative studies using corrosion casts.
Br J Cancer 80: 724–32.
Koumenis C, Wouters BG (2006). ‘Translating’ tumor hypoxia: unfolded protein response (UPR)-dependent and UPR-independent pathways. Mol Cancer Res 4: 423–36.
Lanzen J, Braun RD, Klitzman B, Brizel D, Secomb TW, Dewhirst MW (2006). Direct demonstration of instabilities in oxygen concentrations within the extravascular compartment of an experimental tumor. Cancer Res 66: 2219–23.

232 The tumour microenvironment and cellular hypoxia responses
Ljungkvist AS, Bussink J, Kaanders JH, van der Kogel AJ (2007). Dynamics of tumour hypoxia measured with bioreductive hypoxic cell markers. Radiat Res 167:
127–45.
Magagnin MG, Koritzinsky M, Wouters BG (2006). Patterns of tumor oxygenation and their influence on the cellular hypoxic response and hypoxia-directed therapies. Drug Resist Updat 9: 185–97.
Nordsmark M, Bentzen SM, Rudat V et al. (2005). Prognostic value of tumor oxygenation in 397 head and neck tumors after primary radiation therapy. An international multicenter study.
Radiother Oncol 77: 18–24.
Nordsmark M, Loncaster J, Aquino-Parsons C et al. (2006). The prognostic value of pimonidazole and tumour pO2 in human cervix carcinomas after radiation therapy: a prospective international multicenter study. Radiother Oncol 80: 123–31.
Rademakers SE, Span PN, Kaanders JHAM, Sweep FCGJ, van der Kogel AJ, Bussink J (2008). Molecular aspects of tumour hypoxia. Mol Oncol 2: 41–53.
Semenza GL (2007a). Evaluation of HIF-1 inhibitors as anticancer agents. Drug Discov Today 12: 853–9.
Semenza GL (2007b). Hypoxia-inducible factor 1 (HIF-1) pathway. Sci STKE 407: cm8.
Tatum JL, Kelloff GJ, Gillies RJ et al. (2006). Hypoxia: importance in tumor biology, noninvasive measurement by imaging, and value of its measurement in the management of cancer therapy.
Int J Radiat Biol 82: 699–757.
Thomlinson RH, Gray LH (1955). The histological structure of some human lung cancers and the possible implications for radiotherapy. Br J Cancer 9: 539–49.
van Laarhoven HW, Bussink J, Lok J, Punt CJ, Heerschap A, van der Kogel AJ (2004). Effects of nicotinamide and carbogen in different murine colon carcinomas: immunohistochemical analysis of vascular architecture and microenvironmental parameters.
Int J Radiat Oncol Biol Phys 60: 310–21. Vaupel P, Schlenger K, Knoop C, Hoeckel M (1991).
Oxygenation of human tumors: evaluation of tissue oxygen distribution in breast cancers by computerized O2 tension measurements. Cancer Res 51: 3316–22.
Wouters BG, van den Beucken T, Magagnin MG, Koritzinsky M, Fels D, Koumenis C (2005). Control of the hypoxic response through regulation of mRNA translation. Semin Cell Dev Biol 16: 487–501.
■ FURTHER READING
Fang JS, Gillies RD, Gatenby RA (2008). Adaptation to hypoxia and acidosis in carcinogenesis and tumor progression. Semin Cancer Biol 18: 330–7.
Vaupel P (2008). Hypoxia and aggressive tumor phenotype: implications for therapy and prognosis. Oncologist 13(Suppl 3): 21–6.