

- •Contents
- •Preface
- •1 Introduction: the significance of radiobiology and radiotherapy for cancer treatment
- •2 Irradiation-induced damage and the DNA damage response
- •3 Cell death after irradiation: how, when and why cells die
- •4 Quantifying cell kill and cell survival
- •5 Dose–response relationships in radiotherapy
- •6 Linear energy transfer and relative biological effectiveness
- •7 Tumour growth and response to radiation
- •8 Fractionation: the linear-quadratic approach
- •9 The linear-quadratic approach in clinical practice
- •10 Modified fractionation
- •11 Time factors in normal-tissue responses to irradiation
- •12 The dose-rate effect
- •13 Pathogenesis of normal-tissue side-effects
- •14 The volume effect in radiotherapy
- •15 The oxygen effect and fractionated radiotherapy
- •16 The tumour microenvironment and cellular hypoxia responses
- •17 Therapeutic approaches to tumour hypoxia
- •18 Combined radiotherapy and chemotherapy
- •19 Retreatment tolerance of normal tissues
- •20 Molecular image-guided radiotherapy with positron emission tomography
- •21 Molecular-targeted agents for enhancing tumour response
- •22 Biological response modifiers: normal tissues
- •23 Molecular targeting and patient individualization
- •24 Protons and other ions in radiotherapy
- •25 Second cancers after radiotherapy
- •Glossary of terms in radiation biology
- •Index

12
The dose-rate effect
ALBERT J. VAN DER KOGEL
12.1 |
Introduction |
158 |
12.6 Radiobiological aspects of brachytherapy |
164 |
12.2 |
Mechanisms underlying the dose-rate effect |
158 |
Key points |
167 |
12.3 |
Effect of dose rate on cell survival |
159 |
Bibliography |
167 |
12.4 |
Dose-rate effect in normal tissues |
160 |
Further reading |
168 |
12.5 |
Isoeffect relationships between |
|
|
|
|
fractionated and continuous low |
|
|
|
|
dose-rate irradiation |
162 |
|
|
|
|
|
|
|
12.1 INTRODUCTION
Low dose-rate irradiation is the ultimate form of fractionation, equivalent to multiple infinitely small fractions being given without radiation-free intervals, and thereby damage induction and repair take place at the same time. In clinical radiotherapy, continuous low dose-rate (CLDR) is widely used in brachytherapy either by permanent or temporary implantation of radioactive sources (e.g. 125I, 103Pd) into tumours. By utilizing remote afterloading of medium or high dose-rate sources, notably 192Ir, various combinations of dose-rate and fractionation can also be chosen, such as pulsed dose-rate (PDR) and high doserate (HDR) brachytherapy. With external-beam treatments using intensity-modulated radiotherapy (IMRT), the dose-rate effect may also have some impact as the longer treatment times per session, which can be needed in more complex plans, may lead to a reduction in effectiveness.
12.2 MECHANISMS UNDERLYING THE DOSE-RATE EFFECT
The dose rates used for most radiobiological studies on cells and tissues tend to be in the range
1–5 Gy/min, as are dose rates used clinically for external-beam radiotherapy. Exposure times for a dose of, for example, 2 Gy are therefore no more than a couple of minutes. Within this time, the initial chemical (i.e. free radical) processes that are generated by radiation can take place but such exposure times are not long enough for the repair of DNA damage or for any other biological processes to occur significantly. As the dose rate is lowered, the time taken to deliver a particular radiation dose increases; it then becomes possible for a number of biological processes to take place during irradiation and to modify the observed radiation response. These processes have classically been described by the four Rs of radiobiology: recovery (or repair), redistribution in the cell cycle, repopulation (proliferation), and reoxygenation (see Chapter 7, Section 7.3).
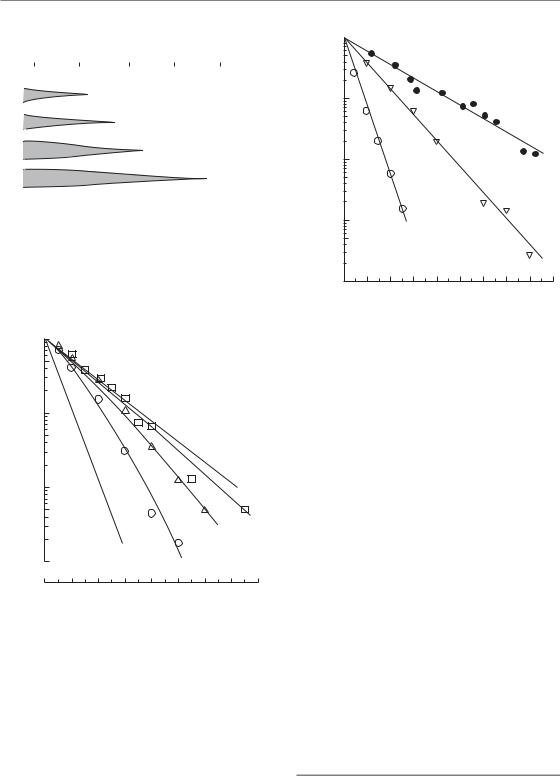
Figure 12.1 illustrates the operation of these processes in producing the dose-rate effect. The range of dose rates over which each process has an effect depends upon its speed. Intracellular repair is the fastest of these processes (half-time <1 hour) and when the exposure duration is of the order of 1 hour considerable repair will take place. Calculations show that repair at this speed will modify radiation effects over the dose-rate range from around 1 Gy/min down to about 0.1 cGy/min
Effect of dose rate on cell survival 159
|
|
|
Time to give 2 Gy |
|
|
||||||
100 hours |
|
10 hours |
|
1hour |
1 |
0 min 1 min |
|
|
|||
|
|
|
|
|
|
|
|
|
|
|
|
|
|
|
|
|
|
|
|
Repopulation |
|
|
|
|
|
|
|
|
|
|
Reoxygenation |
|
|
||
|
|
|
|
|
|
|
Reassortment |
|
|
||
|
|
|
|
|
|
|
|
Recovery |
|
|
|
|
|
|
|
|
|
|
|
|
|
|
|
|
|
|
|
|
|
|
|
|
|
|
|
0.01 |
0.1 |
1 |
10 |
100 |
1000 |
||||||
Dose rate (cGy/min)
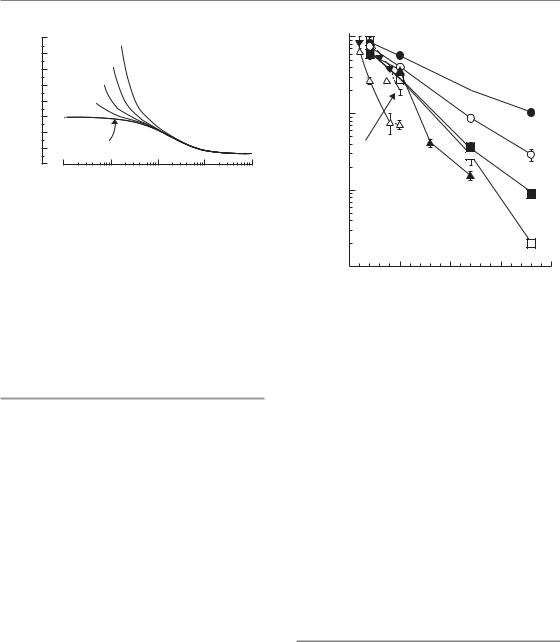
Figure 12.1 The range of dose rates over which repair, reassortment and repopulation modify radiosensitivity depends upon the speed of these processes. From Steel et al. (1986), with permission.
1
fraction |
0.1 |
|
|
|
|
|
|
|
|
0.01 |
|
|
|
|
|
|
|
|
|
Surviving |
|
|
|
|
|
B |
|
|
|
|
|
|
|
|
|
|
|
|
|
|
|
|
|
A |
|
|
|
7.6 |
1.6 |
|
|
|
|
|
|
|
|
|
|
|
0.001 |
|
|
|
|
150 cGy/min |
|
||
|
|
|
|
|
|
|
|
|
|
|
0 |
2 |
4 |
6 |
8 |
10 |
12 |
14 |
16 |
|
|
|
|
Radiation dose (Gy) |
|
|
|
||
Figure 12.2 Cell-survival curves for a human melanoma cell line irradiated at dose rates of 150, 7.6 or 1.6 cGy/min. The data are fitted by the ‘lethal–potentially lethal’ (LPL) model, from which the lines A and B are derived (see text). From Steel et al. (1987), with permission.
(Figs 12.2 and 12.3). Even in the range of clinical external-beam dose rates, small effects on tolerance may arise from changes in dose rate. In contrast, repopulation is a much slower process. Doubling times for repopulation in human
1 
|
0.1 |
|
fraction |
HX34 |
|
0.01 |
||
Surviving |
||
HX143 |
||
|
GCT27 |
|
|
0.001 |
0.0001 |
2 |
4 |
6 |
8 |
10 |
12 |
14 |
16 |
18 |
0 |
Radiation dose (Gy)
Figure 12.3 Cell-survival curves for three human tumour cell lines irradiated at the low dose-rate of 1.6 cGy/min. HX143, neuroblastoma; GCT27, germ-cell tumour of the testis; HX34, melanoma. From Steel (1991), with permission.
tumours or normal tissues cannot be less than 1 day; the range is probably very wide – from a few days to weeks (Table 7.1). Only when the exposure duration exceeds about a day will significant repopulation occur during a single radiation exposure. Repopulation, in either tumours or normal tissues, will therefore influence cellular response over a much lower range of dose rates, below say 2 cGy/min, depending upon the cell proliferation rate. Redistribution (i.e. cell-cycle progression) will modify response over an intermediate range of dose rates, as will reoxygenation in tumours. The kinetics of reoxygenation are variable among tumour types and may involve various mechanisms (see Chapter 15, Section 15.5, and Table 15.3); this could, nevertheless, be a significant factor reducing the effectiveness of brachytherapy given over a short overall time.
12.3 EFFECT OF DOSE RATE ON CELL SURVIVAL
As the radiation dose rate is lowered in the range 1 Gy/min down to 1 cGy/min, the radiosensitivity
160 The dose-rate effect
of cells decreases and the shouldered cell-survival curves which are observed at high dose-rates gradually become straighter. This is illustrated in Fig. 12.2. At 150 cGy/min, the survival curve has a marked curvature; at 1.6 cGy/min it is almost straight (on the semi-log plot) and seems to extrapolate the initial slope of the high dose-rate curve. The amount of sparing associated with the doserate reduction can be expressed by reading off the radiation doses that give a fixed surviving fraction, for example 0.01: these values are 7.7 Gy at 150 cGy/min and 12.8 Gy at 1.6 cGy/min. The ratio of these doses (12.8/7.7 1.6) is called the doserecovery factor (DRF). The data at all three dose rates in Fig. 12.2 have been simultaneously fitted by Curtis’ ‘lethal–potentially lethal’ (LPL) model (see Chapter 4, Section 4.11), a model that is particularly useful for describing the dose-rate effect. This allows an estimate to be made of the halftime for cellular recovery (0.16 hours) and it also predicts cell survival under conditions of no repair (line A) or full repair (line B). Three further examples of low dose-rate survival curves in human tumour cell lines are shown in Fig. 12.3: they well illustrate the linearity of low dose-rate survival curves.
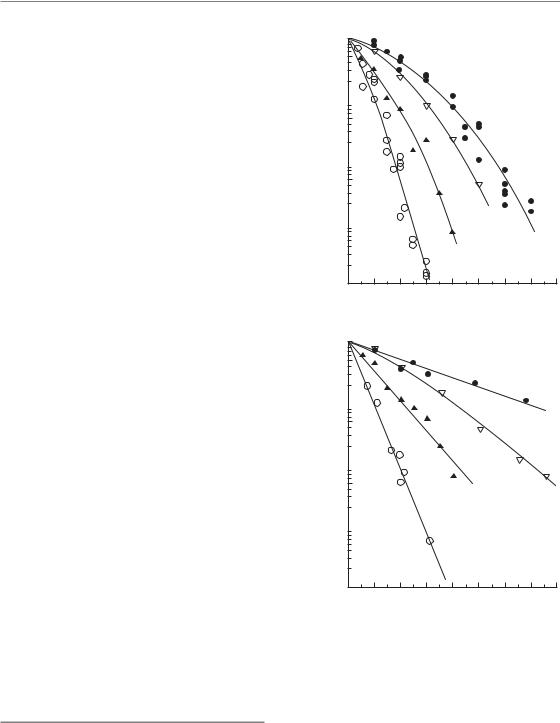
For four selected human tumour cell lines (Fig. 12.4), cell-survival curves are shown at two dose rates (150 cGy/min and 1.6 cGy/min). These four sets of data have been chosen to illustrate the doserate effect and the range of radiosensitivities seen among human tumour cells (Steel et al., 1987). At high dose-rate there is a range of approximately 3 in the radiation dose that gives a survival of 0.01,
the D0.01. At low dose-rate the curves fan out and become straight or nearly so: the range of D0.01 values is now roughly 7. This illustrates an important
characteristic of low dose-rate irradiation: it discriminates better than high dose-rate irradiation between cell lines of differing radiosensitivity.
12.4 DOSE-RATE EFFECT IN NORMAL TISSUES
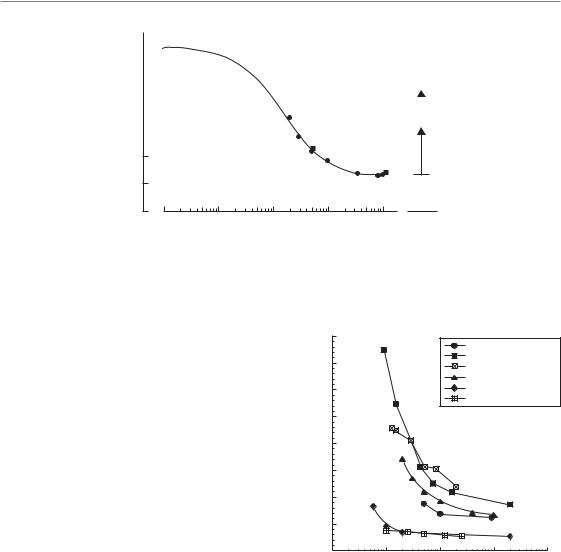
Most normal tissues show considerable sparing as the dose rate is reduced. An example is shown in Fig. 12.5. The thorax of conscious mice was irradiated with 60Co γ-rays and damage to the lung was measured using a breathing-rate assay (Down
Surviving fraction
(a)
Surviving fraction
(b)
1
0.1 
0.01 
0.001 
0.0001
0
1
0.1 
0.01 
0.001 
0.0001
0
|
|
|
|
HX156 |
|
|
|
|
|
|
HX58 |
|
|
RT112 |
|
|
HX142 |
|
|
|
|
||
|
|
|
|
|
|
||
2 |
4 |
6 |
8 |
10 |
12 |
14 |
16 |
|
|
Radiation dose (Gy) |
|
|
|||
RT112
HX156
HX58
HX142
2 |
4 |
6 |
8 |
10 |
12 |
14 |
16 |
|
|
Radiation dose (Gy) |
|
|
|||
Figure 12.4 Cell-survival curve for four representative human tumour cell lines irradiated (a) at high dose-rate (150 cGy/min) or (b) at low dose-rate (1.6 cGy/min).
HX142, neuroblastoma; HX58, pancreas; HX156, cervix; RT112, bladder carcinoma. From Steel (1991), with permission.
et al., 1986). The radiation dose that produced early pneumonitis in 50 per cent of the mice (i.e. the ED50) was 13.3 Gy at 100 cGy/min but it increased to 34.2 Gy at the lowest dose-rate of
Dose-rate effect in normal tissues 161
ED50 (Gy)
60 |
|
|
|
|
|
|
|
|
|
50 |
|
Prediction of the |
|
|
|
1Gy/fraction |
|||
|
incomplete repair model |
|||
40 |
|
|
||
|
|
|||
|
|
|
|
|
|
|
|
|
|
30 |
|
|
2Gy/fraction |
|
|
|
|
|
|
|
|
|
|
|
|
|
|
|
|
20
10
0
0.01 |
0.1 |
1 |
10 |
100 Fraction |
Dose rate (cGy/min)
Figure 12.5 The dose-rate effect for pneumonitis in mice. The full line fitted to the data was calculated on the basis of the incomplete repair model; the broken line shows its extrapolation to very low dose-rates. The boxes on the right show the ED50 (effect dose–50 per cent) values for fractionated irradiation. From Down et al. (1986), with permission.
2 cGy/min (DRF 2.6). Note that a similar degree of sparing could be achieved (in studies of other investigators) by fractionated high dose-rate irradiation using 2 Gy per fraction, and even more sparing at 1 Gy per fraction. Note also that at 2 cGy/min the curve is still rising rapidly. It was not possible in these experiments to go down to dose rates below 2 cGy/min because of the difficulty of immobilizing the mice for long periods of time.
The data in Fig. 12.5 have been fitted by the incomplete repair model (Thames, 1985) as explained in Chapter 8.8. This model simulates the effect of recovery (repair) on tissue sensitivity; it does not take account of cell proliferation during irradiation. The model fits the data well and it also allows extrapolation down to low dose-rates. It predicts, in this example, that dose-sparing due to recovery will continue to increase down to about 0.01 cGy/min at which the ED50 is 59 Gy and the recovery factor (i.e. DRF value) is 4.4. Proliferation of putative stem cells in the lung may lead to even greater sparing at very low dose-rates.
The comparison between a single low dose-rate exposure (2 cGy/min) and fractionated high doserate irradiation (2 Gy per fraction) allows an important conclusion to be drawn. If the fractions are delivered once per day then the overall time to deliver an ED50 dose of 34 Gy is 17 days. The same effect is produced by a single low dose-rate treatment in 28 hours. Continuous low dose-rate
|
80 |
|
|
Rat lung |
|
|
|
|
|
|
|
|
70 |
|
|
Spinal cord |
|
|
|
|
Lip mucosa |
|
|
|
|
|
|
Mouse lung |
|
|
60 |
|
|
Bone marrow-long term |
|
|
|
|
|
Bone marrow (LD50) |
|
(Gy) |
50 |
|
|
|
|
40 |
|
|
|
|
|
50 |
|
|
|
|
|
|
|
|
|
|
|
ED |
30 |
|
|
|
|
|
|
|
|
|
|
|
20 |
|
|
|
|
|
10 |
|
|
|
|
|
0 |
1 |
10 |
100 |
1000 |
|
0.1 |
||||
Dose rate (cGy/min)
Figure 12.6 The dose-rate effect in various rodent normal tissues: lung, spinal cord, lip mucosa and bone marrow.
exposure is thus the most efficient way of allowing maximum tissue recovery in the shortest overall time. It minimizes the effects of cell proliferation, which is an advantage in terms of damage to tumour cells but a disadvantage for the tolerance of those early-responding normal tissues that rely more on proliferation than (intra)cellular recovery.
Figure 12.6 shows some examples of other studies of the dose-rate effect on normal tissues in
162 The dose-rate effect
rodents: lip mucosa, lung, spinal cord and bonemarrow. When comparing two typical lateresponding tissues (lung and spinal cord) with an early-responding tissue (lip mucosa in the mouse) the patterns of recovery are very similar, with the largest sparing in the spinal cord. This is to be expected for the central nervous system as this tissue shows the largest increase in tolerance when decreasing the fraction size (low α/β ratio). For early-responding epithelial tissues such as the lip mucosa the dose-rate effect is less pronounced, but for overall times longer than 1–2 days proliferation adds to a rapid increase in tolerance, in contrast to late-responding tissues.
The two bone marrow endpoints, lethality owing to bone marrow syndrome and long-term repopulation of haemopoietic stem cells, show only a minimal recovery for dose rates as low as 1 cGy/min. This is predominantly due to the high sensitivity of the bone marrow, as a LD50 (radiation producing lethality in 50 per cent of a population) dose in the range of 6–9 Gy is even at 1 cGy/min delivered in a total time of only 10–15 hours. It is of interest to note that a slow proliferating haemopoietic stem cell population showed a significant recovery when lowering the dose rate to approximately 0.5 cGy/min, in agreement with a low α/β ratio (van Os et al., 1993).
12.5 ISOEFFECT RELATIONSHIPS BETWEEN FRACTIONATED AND CONTINUOUS LOW DOSE-RATE IRRADIATION
A variety of theoretical descriptions of the doserate effect have been made but for clinical application the most widely used is the incomplete repair model of Thames (1985). The calculations of Dale and Deehan (2007) make the same basic assumptions, although the formulation is slightly different. The basic equation of the incomplete repair model for continuous irradiation is:
E αD βD2g |
(12.1) |
where E is the level of effect, α and β are parameters of the linear-quadratic equation, D is the total dose and g is a function of the duration of continuous exposure. Note that the time-dependent
recovery factor modifies only the quadratic term in the linear-quadratic (LQ) equation, a feature that is supported by experimental data (Steel et al, 1987; Fig. 12.2). Note also that repopulation is ignored in these calculations.
The value of g depends upon the halftime for recovery (T1/2) and the duration of continuous exposure (t) according to the relation:
g 2[μt 1 exp( μt)]/(μt)2 |
(12.2) |
where μ 0.693/T1/2. Values of g for a wide range
of T1/2 and t are given in Table 8.3.
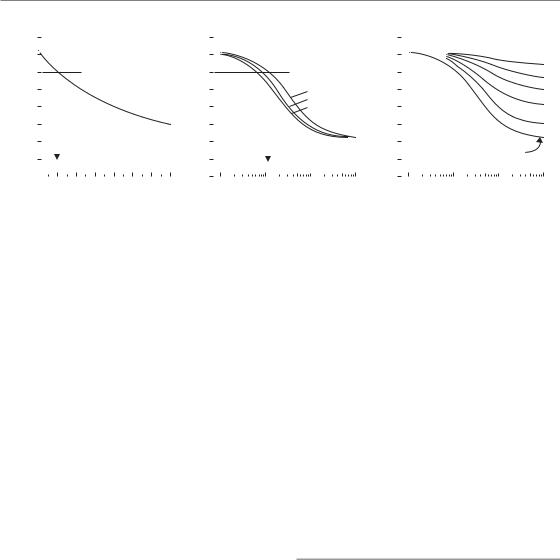
This model allows isoeffect relationships to be calculated and, as shown in Fig. 12.5, it is successful in describing experimental data over a range of dose rates. Further examples of calculated curves are shown in Fig. 12.7. The purely fractionated case is shown in Fig. 12.7a, with high dose-rate irradiation, described by the LQ model. The line in this chart corresponds to equation 8.5 (Chapter 8) with D1 60 Gy, d1 2 Gy and α/β 10 Gy. The inter-fraction intervals have here been assumed to be long enough to allow complete recovery between fractions. Figure 12.7b shows isoeffect curves for a single continuous exposure at any dose rate, calculated using equation 12.1 and with values of the halftime for recovery of 1.0, 1.5 or 2.0 hours. The three curves are slightly different and this illustrates the dependence of the isoeffect curve for continuous exposure on the speed of recovery: the curve shifts laterally to lower dose rates as the halftime is prolonged. Unfortunately, recovery halftime is not well known in clinical situations, which limits the value of calculations of this sort.
The curves in Fig. 12.7a–c are mutually isoeffective. They are calculated for the same effect level and for the same values of α and β (the α/β ratio is 10 Gy), chosen to give an extrapolated dose of 72 Gy at infinitely small doses per fraction or infinitely low dose-rate, which corresponds to an equivalent dose in 2-Gy fractions (EQD2) of 60 Gy. This example illustrates the equivalence that is predicted by the mathematical models between a particular continuous dose rate and a corresponding dose per fraction. For the parameters assumed here (as shown by the vertical arrows), a dose rate of around 1–2 cGy/min
(roughly 1 Gy/hour) is equivalent to fractionated
Isoeffect relationships 163
|
80 |
|
|
|
Fractionated |
|
|
|
|
||
|
|
|
|
|
|
|
|
||||
|
|
|
|
|
|
|
|
|
|||
|
70 |
|
|
|
|
|
|
|
|
|
|
(Gy) |
60 |
|
|
|
|
|
|
|
|
|
|
|
|
|
|
|
|
|
|
|
|
||
50 |
|
|
|
|
|
|
|
|
|
|
|
dose |
40 |
|
|
|
|
|
|
|
|
|
|
Total |
30 |
|
|
|
|
|
|
|
|
|
|
|
|
|
|
|
|
|
|
|
|
|
|
|
20 |
|
|
|
|
|
|
|
|
|
|
|
10 |
|
|
|
|
|
|
|
|
|
|
|
|
|
|
|
|
|
|
|
|
|
|
|
0 |
|
|
|
|
|
|
|
|
|
|
|
|
2 |
4 |
6 |
8 |
10 |
12 |
14 |
|||
|
0 |
||||||||||
(a) |
|
|
|
Dose per fraction (Gy) |
|
|
|||||
80 |
|
|
Continuous |
|
|
80 |
|
|
|
Fractionated LDR |
|
|
||
|
|
|
|
|
|
|
||||||||
|
|
|
|
|
|
|
|
|
|
|
||||
70 |
|
|
|
|
|
|
70 |
|
|
|
|
|
50 |
|
|
|
|
|
|
|
|
|
|
|
|
|
|
|
|
60 |
|
|
|
Halftime |
|
|
60 |
|
|
|
|
|
20 |
|
|
|
|
|
|
||||||||||
50 |
|
|
|
|
|
50 |
|
|
|
|
|
10 |
|
|
|
|
|
1.0 hours |
|
|
|
|
|
|
|
|
|||
|
|
|
|
|
|
|
|
|
|
|
|
|||
40 |
|
|
|
1.5 hours |
|
|
40 |
|
|
|
|
|
5 |
|
|
|
|
2.0 hours |
|
|
|
|
|
|
|
|
|
||
30 |
|
|
|
|
|
|
30 |
|
|
|
|
|
2 |
|
|
|
|
|
|
|
|
|
|
|
|
1 |
|
||
20 |
|
|
|
|
|
|
20 |
|
|
|
|
|
|
|
|
|
|
|
|
|
|
|
|
|
|
|
|
||
10 |
|
|
|
|
|
|
10 |
|
|
|
Fraction number |
|
|
|
|
|
|
|
|
|
|
|
|
|
|
|
|
||
0 |
|
|
|
|
|
|
0 |
|
|
|
|
|
|
|
|
|
|
|
|
|
|
|
|
|
|
|
|||
0.1 |
1 |
10 |
100 |
0.1 |
1 |
10 |
100 |
|||||||
(b) |
Dose rate (cGy/min) |
|
|
(c) |
Dose rate (cGy/min) |
|
|
|||||||
Figure 12.7 Isoeffect curves calculated with the incomplete repair model (Thames, 1985) for fractionated, continuous, or fractionated low dose-rate radiation exposure (a–c are mutually isoeffective). Repopulation is ignored. The α/β ratio is 10 Gy and the EQD2 (equivalent dose in 2-Gy fractions) is 60 Gy. Adapted from Steel (1991) and Steel et al. (1989), with permission.
treatment with approximately 2 Gy per fraction, for both of which the isoeffective dose is 60 Gy.
A further important conclusion can be drawn from calculations of the type shown in Fig. 12.7. In Chapter 8, Section 8.6 (see Fig. 8.7), we have seen how the use of large fraction sizes leads to a therapeutic disadvantage in tumours with a high α/βratio, relative to late normal-tissue injury. The same is true for high continuous dose rate treatments. By drawing further horizontal lines between Fig. 12.7a and Fig. 12.7b it can be seen that a dose rate of 5 cGy/min is equivalent to around 6–8 Gy per fraction and 10 cGy/min to over 10 Gy per fraction.
Figure 12.7c shows the results of model calculations for fractionated low dose-rate irradiation. Once again using the incomplete repair model isoeffect curves were calculated for treatment with 2–50 fractions, each given at the dose rate shown on the abscissa and with full recovery between fractions. Again, repopulation is ignored. This diagram indicates the basic feature of fractionated low dose-rate exposure: as we increase the number of fractions the dose-rate effect is reduced (i.e. the curves become flatter), and as we lower the dose rate the effect of fractionation is reduced (as seen by the vertical spread between the curves). This results from a simple principle. As we protract irradiation it is cellular recovery that produces all these effects and there is a limit to how much recovery the cells can accomplish. If we
allow recovery between fractions then there is less to be recovered during each fraction, and vice versa.
An alternative approach to the description of the dose-rate effect is the LPL model of Curtis (1986). This is a mechanistic model that is described in Chapter 4, Section 4.11. It has theoretical advantages for studies that seek to describe the cellular mechanisms of radiation cell killing but is less appropriate for clinical calculations than the empirical equations of Thames and Dale referred to above.
Effect of cell proliferation
The effect of proliferation at very low dose-rates is graphically illustrated in Fig. 12.8. These calculations are made for a hypothetical cell population with an α/βratio of 3.7 Gy and a repair halftime of 0.85 hour. Cell proliferation is assumed to occur with the doubling times shown in the figure and no account has been taken of radiation effects on the rate of proliferation (if this occurred it would reduce the effect of proliferation at the higher doserates). For these parameter values there is no effect of proliferation at dose rates above 1 cGy/min but as the dose rate is lowered to 0.1 cGy/min the isoeffective dose rises very steeply. The implication for brachytherapy is that above 1 cGy/min repopulation effects can be ignored, but below this dose rate
164 The dose-rate effect
|
160 |
Doubling time : |
|
|
|
|
|
140 |
|
5 days |
|
|
|
(Gy) |
|
10 days |
|
|
|
|
120 |
|
|
|
|
||
|
|
|
|
|
|
|
dose |
100 |
20 days |
|
|
|
|
|
|
|
|
|
||
|
|
|
|
|
|
|
Isoeffective |
80 |
50 days |
|
|
|
|
|
|
|
|
|
||
60 |
|
|
|
|
|
|
|
|
|
|
|
|
|
|
40 |
|
|
|
|
|
|
20 |
No proliferation |
|
|
|
|
|
0 |
0.01 |
0.1 |
1 |
10 |
100 |
|
|
|||||
Dose rate (cGy/min)
Figure 12.8 Illustrating the effect of cell proliferation as a function of dose rate. Isoeffect curves are shown for no proliferation or with the doubling times indicated. The calculations are based on a simple model of exponential growth, ignoring radiation effects on the rate of cell proliferation.
they will be substantial, both in tumours and in early-responding normal tissues.
The inverse dose-rate effect
Although in situations affecting clinical practice it is a general rule that cellular sensitivity decreases with decreasing dose rate, exceptions to this rule have been noted. Mitchell and Bedford in early studies of cell killing in mammalian cell lines occasionally found a slight inversion which they attributed to a lower dose rate allowing cells to progress though the cell cycle into more sensitive phases, thus suffering greater damage. The mechanism of the inverse dose-rate effect has been elucidated further in more recent experimental work related to the ‘low-dose hyper-radiosensitivity’ (HRS) process discovered by Joiner and colleagues (see Chapter 4, Section 4.14). In cell lines showing a pronounced HRS response below doses of 0.4 Gy, a reversal of the usual sparing at low dose-rates can also be observed at dose rates below 1.5 cGy/min. An example of this HRS-driven inverse dose rate effect is shown in Fig. 12.9 (Mitchell et al., 2002). It is possible that this phenomenon could be a factor promoting the effectiveness of low dose-rate permanent125 implants, for example in the treatment of prostate cancer and glioblastoma, where exposure rates over much of the target volume are generally less than 1 cGy/min.
|
1 |
|
|
|
|
|
flask |
|
|
|
|
|
|
per |
0.1 |
|
|
|
|
100 |
|
|
|
|
|
|
|
clonogens |
|
Acute |
2 |
|
|
|
|
|
|
|
|
||
|
|
|
|
|
60 |
|
|
|
|
|
|
|
|
Relative |
0.01 |
|
|
|
5 |
30 |
|
|
|
|
|
|
|
|
|
|
|
|
|
10 |
|
0.001 |
|
5 |
10 |
15 |
20 |
|
0 |
|
Dose (Gy)
Figure 12.9 Survival curves obtained after exposure of asynchronously growing T98G glioblastoma cells to low dose-rate 60Co γ radiation. Curve labels indicate the dose rate of radiation exposure in cGy/hour. Relative clonogens per flask was calculated by multiplying the surviving fraction by the relative cell yield following irradiation. Each datum point is plotted as the mean SEM. The acute dose rate was 33 Gy/hour. This cell line is an example of those which demonstrate an inverse dose-rate effect on cell survival at dose rates below 100 cGy/hour, whereby a decrease in dose rate results in an increase in cell killing per unit dose. Analysis of the cell cycle indicates that these inverse dose-rate effects are not caused by accumulation of cells in G2/M phase or by other cell-cycle perturbations, but result from the process of low-dose hyper-radiosensitivity (see Chapter 4, Section 4.14). From Mitchell et al. (2002), with permission.
12.6 RADIOBIOLOGICAL ASPECTS OF BRACHYTHERAPY
The principal reasons for choosing interstitial or intracavitary radiotherapy in preference to exter- nal-beam treatment relate to dose delivery and dose distribution rather than to radiobiology. Irradiation from an implanted source within a tumour carries a distinct geometrical advantage for sparing the surrounding normal tissues that will inevitably tend to receive a lower radiation dose. Brachytherapy thus exploits the volume effect in normal tissues (see Chapter 14). Normal

Radiobiological aspects of brachytherapy 165
tissues will also often be exposed to a lower doserate, which gives the additional advantage of ‘negative double trouble’ (i.e. ‘double benefit’, see Chapter 9, Section 9.11).
Variation in cell killing around an implanted radioactive source
The non-uniformity of the radiation field around an implanted source has important radiobiological consequences. Close to the source the dose rate is high and the amount of cell killing will be close to that indicated by the acute-radiation survival curve. As we move away from the source, two changes take place: cells will be less sensitive at the lower dose-rates, and within a given period of implantation the accumulated dose will also be less. These two factors lead to a very rapid change in cell killing with distance from the source. Within tissues (tumour or normal) that are close to the source the level of cell killing will be so high that cells of virtually any radiosensitivity will be killed. Further out, the effects will be so low that even the most radiosensitive cells will survive. Between these extremes there is a critical zone in which differential cell killing will occur. As shown by Steel et al. (1989), for cells of any given level of radiosensitivity model calculations imply that there will be cliff-like change from high to low local cure probability, taking place over a radial distance of a few millimetres (Fig. 12.10). The distance of the ‘cliff ’ from the source is determined by the radiosensitivity of the cells at low dose-rate – nearer for radioresistant cells and further away for radiosensitive cells (Steel, 1991).
Is there a radiobiological advantage in low dose-rate radiotherapy?
The question of whether low dose-rate irradiation itself carries a therapeutic advantage is an interesting one. There is a considerable volume of literature on the dose-rate effect, both in tumours and in normal tissues, on the basis of which it would be difficult to claim that under all circumstances low dose-rate treatment would have the best therapeutic index. As shown in Fig. 12.4, cells that
fraction |
0.1 |
|
|
|
|
|
|
|
|
C |
|
|
|
Surviving |
|
|
|
|
|
|
|
|
|
|
|
||
0.01 |
|
|
|
|
|
B |
|
|
|
|
|
||
|
|
|
|
|
|
|
|
|
|
|
|||
|
|
|
|
|
|
|
|
|
|
|
|
||
|
0.001 |
|
|
|
A |
|
|
|
|
|
|
|
|
|
|
|
|
|
|
|
|
|
|
|
|
|
|
|
|
|
|
|
|
|
|
|
|
|
|
|
|
|
|
|
|
|
|
|
|
|
|
|
|
|
|
|
|
|
|
|
|
|
|
|
|
|
|
|
|
|
0 |
5 |
10 |
15 |
20 |
25 |
|
||||||
(a) |
|
|
|
|
Radiation dose (Gy) |
|
|
|
|||||
|
1.0 |
|
|
|
|
|
|
|
|
|
|
|
|
|
|
|
|
|
|
|
|
|
|
|
|
|
|
probability |
0.8 |
|
|
|
|
|
|
|
|
|
|
|
|
|
|
|
|
|
|
|
|
|
|
|
|
||
0.6 |
|
|
|
|
|
|
|
|
|
|
|
|
|
|
|
|
|
|
|
|
|
|
|
|
|
|
|
Cure |
0.4 |
|
|
|
C |
B |
A |
|
|
|
|||
|
|
|
|
|
|
||||||||
|
|
|
|
|
|
|
|||||||
|
|
|
|
|
|
|
|
||||||
|
0.2 |
|
|
|
|
|
|
|
|
|
|
|
|
|
|
|
|
|
|
|
|
|
|
|
|
|
|
|
0 |
|
|
|
|
|
|
|
|
|
|
|
|
|
|
|
|
|
|
|
|
|
|
|
|
|
|
|
0 |
1 |
2 |
3 |
4 |
5 |
|
||||||
(b)Distance from source (cm)
Figure 12.10 The likelihood of local tumour control varies steeply with distance from a point radiation source. The radius at which failure occurs depends upon the steepness of the survival curve at low dose-rate (a). From Steel et al. (1989), with permission.
are the least sensitive to radiation and have the largest shoulder on the cell-survival curve will show the greatest degree of dose-sparing. These are not necessarily cell lines of low α/β ratio, for Peacock et al. (1992) have shown that a range of human tumour cell lines, including those shown in Fig. 12.4, have similar α/β ratios: radioresistant tumour cells tend to have both a lower α and a lower β than more sensitive cells. In a particular therapeutic situation we could make a calculation comparing the relative DRF between tumour and critical normal tissues. This would tell us whether the normal tissues might be spared more or less than the tumour cells if we were to lower the dose rate. However, this does not answer the therapeutic question, because to treat with one large high

166 The dose-rate effect
dose-rate fraction has for a long time not been a clinical option. However, with the advances in functional imaging and combination of positron emission tomography (PET)/computed tomography (CT) with high-precision IMRT, hypofractionation and even large single doses for treatment of metastases are now coming back into the realm of modern radiation oncology. This is similar to comparing hypofractionation with the use of conventional or reduced dose per fraction (see Fig. 10.2). The appropriate clinical question is whether a single continuous low dose-rate treatment is better than using a conventional fractionation schedule.
As illustrated in Fig. 12.7, there is, on the basis of the incomplete repair model, an equivalence between dose per fraction in fractionated radiotherapy and dose rate for a single continuous exposure. Roughly speaking, for a given level of cell killing the total dose required at a continuous dose-rate of 1 Gy/hour is similar to that required by acute fractionated treatment with 2 Gy per fraction. This equivalence depends upon the halftime for recovery but it is relatively independent of the α/β ratio (Fowler, 1989). In radiobiological terms, these two treatments should be equally effective. Lowering the (fractionated) dose per fraction will spare late-responding normal tissues whose α/β ratio is low, as will lowering the dose rate (continuous) below 1 Gy/hour.
The success of intracavitary therapy may result from two factors: (1) the lower volume of normal tissue irradiated to a dose that discriminates between tissue sensitivities; and (2) the practical and radiobiological benefits of short treatment times. The clearest advantage for low dose-rate irradiation is that for a given level of cell killing, and without hazarding late-responding normal tissues, this treatment will be complete within the shortest overall time (see Section 12.4). Tumour cell repopulation will therefore be minimized. This could confer a therapeutic advantage for the treatment of rapidly repopulating tumours.
A potential disadvantage of low dose-rate irradiation is that because of the short overall treatment time there may be inadequate time available for the reoxygenation of hypoxic tumour cells and therefore greater radioresistance because of hypoxia.
Pulsed brachytherapy
The availability of computer-controlled high doserate afterloading systems provides the opportunity to deliver interstitial or intracavitary radiotherapy in a series of pulses (PDR). The gaps between pulses allow greater freedom for the patient and increased safety for nursing staff, as well as technical advantages, for example in allowing corrections for the decay of the radioactive source that minimize effects on the quality of treatment.
In principle, any move away from continuous exposure towards treatment with gaps carries a radiobiological disadvantage. This is because the dose rate within each pulse is higher and this allows less opportunity for repair of radiation damage. Slowly-repairing tissues will therefore be disadvantaged and, as argued in Chapter 10, Section 10.8, there will be a loss of therapeutic index between tumour tissues that repair quickly and those late-responding normal tissues that repair more slowly. The magnitude of this effect was considered by Brenner and Hall (1991), who concluded that for gaps between pulses of up to 60 min the radiobiological deficit may be an acceptable trade-off for the increase in dosimetric localization to the target volume. During the ensuing years there has been much theoretical discussion of the guidelines for safe treatment with pulsed brachytherapy. Extensive laboratory studies comparing PDR and CLDR with cells in vitro have been carried out in Oslo by the group of Pettersen (Hanisch et al., 2007). They concluded that in some cell lines PDR had a greater than predicted effect. This could not be explained by the inverse dose-rate effect (see Section 12.5). Cell lines that showed an inverse dose-rate effect did so similarly under both CLDR and PDR conditions.
Theoretical studies have examined the effect of halftimes for repair in normal and tumour tissues, including the evidence for multiple halftime components within each tissue (Fowler and van Limbergen, 1997). Brachytherapy studies on laboratory animals are technically difficult, not least because of the differences in scale between rats and humans, but detailed studies of effects in the rat spinal cord have been carried out (Pop et al., 2000).
Clinical experience in the use of pulsed brachytherapy is increasing and the availability of

Bibliography 167
equipment that allows a single high-intensity source to be ‘stepped’ through the treatment field provides an important degree of control. The method does, however, need to be applied with care because there are penalties in terms of the quality of treatment when pulse sizes are allowed to be too large or when time between pulses is increased much above 1 hour. High dose-rate afterloading systems create the temptation to shorten the overall time and, as indicated above, this could lead to increased early reactions to radiotherapy and greater tumour radioresistance owing to inadequate reoxygenation. A prospective clinical trial comparing CLDR and PDR for cervical cancer was carried out in the Princess Margaret Hospital in Toronto (Bachtiary et al., 2005). No statistical difference was observed in survival or late toxicity, and the authors concluded that PDR has the advantage of a better dose optimization. The use of PDR as a boost in combination with IMRT might yield the best options for dose escalation, as high doses are obtained within the target volume (Pieters et al., 2008).
IMRT and dose rate
Intensity-modulated radiotherapy, one of the highest precision implementations of externalbeam radiotherapy, is generally accepted as the best tool to allow dose-escalation with conventional photons in the target volume while sparing the surrounding normal tissues. This higher precision is achieved by a more complex technology, including a high number of separate segments and thereby often longer delivery times of the complete dose fraction of up to 30 min. Thus, part of the escalated dose may be biologically lost by repair during the treatment. Various investigators have addressed this question by in vitro cell culture experiments. A recent series of experiments, along with a review of the literature, concluded that in general the effectiveness in terms of cell kill decreases by up to 20 per cent for treatment times of 20–30 min (Bewes et al., 2008). An important observation is that these figures differ for various cell lines, and are more dependent on the rate of repair than the α/β ratio, as also predicted by the
‘incomplete repair’ or the LPL model (see
Chapters 4 and 8). To date, no indications of a reduced effectiveness of IMRT treatments have been reported, and it should be realized that the outcome of therapy is not determined only by the intrinsic sensitivity of tumour cells. Of interest in this respect is an experimental study comparing in vitro radiosensitivity with in vivo tumour response in the same cell line (Tomita et al., 2008), which showed that the loss of effect due to lower cell kill was compensated in vivo by rapid reoxygenation.
Key points
1.Low dose-rate irradiation is the ultimate form of fractionation which allows the maximal amount of recovery in the shortest overall treatment time.
2.The dose-rate effect results primarily from repair of sublethal damage, while repopulation may play a role for treatment times longer than 1–2 days.
3.Cell-survival curves become straighter at low dose-rates and approach the initial slope of the survival curve.
4.An inverse dose-rate effect, the reversal of sparing at dose rates less than c. 1 cGy/min, is observed in cell lines showing the phenomenon of low-dose HRS.
5.PDR provides the same radiobiological advantage as continuous low dose-rate with the added benefit of optimized dose distributions and patient logistics.
6.IMRT given in 20–30 min per fraction may be intrinsically less effective owing to lower cell kill, but this may be compensated in tumours by rapid reoxygenation.
■BIBLIOGRAPHY
Bachtiary B, Dewitt A, Pintilie M et al. (2005). Comparison of late toxicity between continuous low-dose-rate and pulsed-dose-rate brachytherapy in cervical cancer patients. Int J Radiat Oncol Biol Phys 63: 1077–82.

168 The dose-rate effect
Bewes JM, Suchowerska N, Jackson M, Zhang M, McKenzie DR (2008). The radiobiological effect of intra-fraction dose-rate modulation in intensity modulated radiation therapy (IMRT). Phys Med Biol 53: 3567–78.
Brenner DJ, Hall EJ (1991). Fractionated high dose rate versus low dose rate regimens for intracavitary brachytherapy of the cervix. I. General considerations based on radiobiology. Br J Radiol 64: 133–41.
Curtis SB (1986). Lethal and potentially lethal lesions induced by radiation – a unified repair model. Radiat Res 106: 252–70.
Dale RG, Deehan C (2007). Brachytherapy. In: Dale RG, Jones B (eds) Radiobiological modelling in radiation oncology. London: The British Institute of Radiology, 113–37.
Down JD, Easton DF, Steel GG (1986). Repair in the mouse lung during low dose-rate irradiation.
Radiother Oncol 6: 29–42.
Fowler JF (1989). Dose rate effects in normal tissues. In: Mould RF (ed.) Brachytherapy 2, proceedings of the 5th International Selectron Users’ Meeting 1988 . Leersum: Nucletron International BV, 26–40.
Fowler JF, van Limbergen EF (1997). Biological effect of pulsed dose rate brachytherapy with stepping sources if short half-times of repair are present in tissues. Int J Radiat Oncol Biol Phys 37: 877–83.
Hanisch PH, Furre T, Olsen DR, Pettersen EO (2007). Radiobiological responses for two cell lines following continuous low dose-rate (CLDR) and pulsed dose rate (PDR) brachytherapy. Acta Oncol 46: 602–11.
Mitchell CR, Folkard M, Joiner MC (2002). Effects of exposure to low-dose-rate 60Co gamma rays on human tumor cells in vitro. Radiat Res 158: 311–18.
Peacock JH, Eady JJ, Edwards SM, McMillan TJ, Steel GG (1992). The intrinsic alpha/beta ratio for human tumour cells: is it a constant? Int J Radiat Biol
61: 479–87.
Pieters BR, van de Kamer JB, van Herten YR et al. (2008). Comparison of biologically equivalent dosevolume parameters for the treatment of prostate cancer with concomitant boost IMRT versus IMRT
combined with brachytherapy. Radiother Oncol 88: 46–52.
Pop LA, Millar WT, van der Plas M, van der Kogel AJ (2000). Radiation tolerance of rat spinal cord to pulsed dose rate (PDR-) brachytherapy: the impact of differences in temporal dose distribution.
Radiother Oncol 55: 301–15.
Steel GG (1991). The ESTRO Breur lecture. Cellular sensitivity to low dose-rate irradiation focuses the problem of tumour radioresistance. Radiother Oncol 20: 71–83.
Steel GG, Down JD, Peacock JH, Stephens TC (1986). Dose-rate effects and the repair of radiation damage. Radiother Oncol 5: 321–31.
Steel GG, Deacon JM, Duchesne GM, Horwich A, Kelland LR, Peacock JH (1987). The dose-rate effect in human tumour cells. Radiother Oncol 9: 2
99–310.
Steel GG, Kelland LR, Peacock JH (1989). The radiobiological basis for low dose-rate radiotherapy. In: Mould RF (ed.) Brachytherapy 2, Proceedings of the 5th International Selectron Users’ Meeting 1988. Leersum: Nucletron International BV, 15–25.
Thames HD (1985). An ‘incomplete-repair’ model for survival after fractionated and continuous irradiations. Int J Radiat Biol 47: 319–39.
Tomita N, Shibamoto Y, Ito M et al. (2008). Biological effect of intermittent radiation exposure in vivo: recovery from sublethal damage versus reoxygenation. Radiother Oncol 86: 369–74.
van Os R, Thames HD, Konings AW, Down JD (1993). Radiation dose-fractionation and dose-rate relationships for long-term repopulating hemopoietic stem cells in a murine bone marrow transplant model. Radiat Res 136: 118–25.
■ FURTHER READING
Dale RG, Deehan C (2007). Brachytherapy. In: Dale RG, Jones B (eds) Radiobiological modelling in radiation oncology. London: The British Institute of Radiology, 113–37.