

- •Introduction to the Anchor Handling Course
- •Technical Specifications:
- •Winch Layout:
- •Power Settings / Bollard Pull
- •All operations on board must be performed in accordance with Company Procedures.
- •Risk Assessment
- •Planning
- •Planning:
- •Goal, example:
- •What to do:
- •Electrical winches
- •Winch operation
- •General Arrangement
- •A/H-Drum at full Capacity
- •Over speed
- •Water brake
- •Band brake
- •QUICK & Full Release
- •Hydraulic Winches
- •Lay out (B-type)
- •Hydraulic winch, “B-type”
- •TOWCON
- •Instruction for use of Wire Drums
- •Changing of Chain Wheels (Wildcats / Chain Lifter)
- •TRIPLEX - SHARK JAW SYSTEM.
- •Operation
- •Maintenance and inspections
- •Safety
- •2. OPERATION:
- •QUICK RELEASE:
- •EMERGENCY RELEASE:
- •CONTROL PANEL
- •Marks for Locked on Hinge Link
- •2.2- OPERATION OF THE "JAW IN POSITION ACCEPT" LEVER:
- •2.3 OPERATION OF THE CONTROL PANEL AT EMERGENCY POWER.
- •3. ELECTRIC AND HYDRAULIC POWER SYSTEM.
- •3. 1. ARRANGEMENT OF SYSTEM.
- •3.2. FUNCTIONING OF QUICK RELEASE - JAWS ONLY.
- •3.3. FUNCTIONING OF EMERGENCY RELEASE
- •4.2 Test without Load.
- •4.3 Test with Load.
- •5. General Maintenance
- •5.1 Accumulators Depressurising
- •5.2 Shark Jaw Unit
- •5.3 Guide Pins Units
- •5.4 Hydraulic System
- •5.5 Electric System
- •6. Control Measurements / Adjustments.
- •6.2 Adjustment of inductive proximity switches on lock cylinders.
- •6.3 Adjustment of Pressure Switches for Lock Pressure.
- •7. Test Program – Periodical Control
- •7.2 Checking List – Periodic Control Mechanical / Hydraulic.
- •7.3 Checking List – Periodic Control Electrical
- •7.4 Testing without Load – Yearly Testing.
- •7.5 Load Test – Emergency Release – 5 Year Control.
- •“Mark on line !”
- •“Double set of Jaws, Pins and Wire lifter”
- •View from the bridge.
- •“JAW READY FOR OPERATION”
- •“JAW LOCK POSITION ACCEPTED”
- •KARM FORK – SHARK JAW SYSTEM.
- •Wire and chain Stopper
- •Inserts for KARM FORK
- •Martensite:
- •Recommendations:
- •1. THE BASIC ELEMENTS OF STEEL WIRE ROPE
- •2. STEEL WIRE ROPE CONSTRUCTIONS
- •3. SPECIAL STEEL WIRE ROPES
- •4. USE OF STEEL WIRE ROPE
- •5. SELECTING THE RIGHT STEEL WIRE ROPE
- •6. ORDERING STEEL WIRE ROPE
- •7. STEEL WIRE ROPE TOLERANCES
- •8. HANDLING, INSPECTION AND INSTALLATION
- •9. INSPECTION AND MAINTENANCE
- •10. ELONGATION AND PRE-STRETCHING
- •11. OPERATING TEMPERATURES
- •12. MARTENSITE FORMATION
- •13. END TERMINATIONS
- •14. SOCKETING (WIRELOCK)
- •15. DRUM CAPACITY
- •16. CLASSIFICATION AND USE OF STEEL WIRE ROPE
- •17. ROPES
- •18. CHAINS AND LIFTING COMPONENTS
- •19. TECHNICAL CONVERSION TABLES
- •SWIVEL
- •MoorLink Swivel
- •Pin Extractor
- •Socket Bench
- •Chains and Fittings
- •STUD LINK MOORING CHAIN
- •OPEN LINK MOORING CHAIN
- •KENTER JOINING LINKS
- •PEAR SHAPE ANCHOR CONNECTING LINK
- •DETACHABLE CONNECTING LINK
- •D’ TYPE JOINING SHACKLES
- •‘D’ TYPE ANCHOR SHACKLES
- •SHACKLES
- •JAW & JAW SWIVELS
- •BOW & EYE SWIVELS
- •MOORING RINGS
- •FISH PLATES
- •PELICAN HOOKS
- •SLIP HOOKS
- •‘J’ CHASERS
- •PERMANENT CHASERS
- •DETACHABLE PERMANENT CHAIN CHASERS
- •PERMANENT WIRE CHASERS
- •‘J’ LOCK CHAIN CHASERS
- •The way to break the anchor loose of the bottom is therefore:
- •Table of contents
- •Introduction
- •General
- •Mooring systems
- •Mooring components
- •History of drag embedment anchors
- •Characteristics of anchor types
- •History of vryhof anchor designs
- •Criteria for anchor holding capacity
- •Theory
- •Criteria for good anchor design
- •Aspects of soil mechanics in anchor design
- •Soil classification
- •Fluke/shank angle
- •Fluke area
- •Strength of an anchor design
- •Anchor loads and safety factors
- •Anchor behaviour in the soil
- •Proof loads for high holding power anchors
- •Anchor tests
- •Soil table
- •Practice
- •Introduction
- •Soil survey
- •Pile or anchor
- •Setting the fluke/shank angle
- •Connecting a swivel to the Stevpris anchor
- •Chasers
- •Chaser types
- •Stevpris installation
- •Laying anchors
- •Retrieving anchors
- •Anchor orientation
- •Decking the Stevpris anchor
- •What not to do!
- •Racking the Stevpris
- •Deploying Stevpris from the anchor rack
- •Boarding the anchor in deep water
- •Ballast In fluke
- •Chaser equilibrium
- •Deployment for permanent moorings
- •Piggy-backing
- •Piggy-back methods
- •Stevmanta VLA installation
- •Installation procedure
- •Stevmanta retrieval
- •Double line installation procedure
- •Stevmanta retrieval
- •Double line installation with Stevtensioner
- •The Stevtensioner
- •The working principle of the tensioner
- •Measurement of the tensions applied
- •Umbilical cable and measuring pin
- •Break - link
- •Duration of pretensioning anchors and piles
- •Handling the Stevtensioner
- •General tensioning procedures
- •Hook-up
- •Lowering
- •Tensioning mode
- •Retrieving
- •Supply vessels/anchor handling vessels
- •Product data
- •Introduction
- •Dimensions of vryhof anchor types
- •Proof load test for HHP anchors (US units)
- •Dimensions of vryhof tensioners
- •Proof load/break load of chains (in US units)
- •Chain components and forerunners
- •Connecting links
- •Conversion table
- •Mooring line catenary
- •Mooring line holding capacity
- •Shackles
- •Wire Rope
- •Wire rope sockets
- •Thimbles
- •Synthetic ropes
- •Mooring hawsers
- •Main dimensions chasers
- •Stevin Mk3 UHC chart
- •Stevin Mk3 drag and penetration chart
- •Stevpris Mk5 UHC chart
- •Stevpris Mk5 drag and penetration chart
- •Stevmanta VLA UPC chart
- •Introduction
- •Propulsion system
- •Propellers
- •Thrusters
- •Rudders
- •Manoeuvring
- •Current
- •Wind
- •Other forces
- •Turning point (Pivot point)
- •Ship handling
- •General layout Jack-Up drilling unit:
- •General information about a Semi Submersible drilling unit:
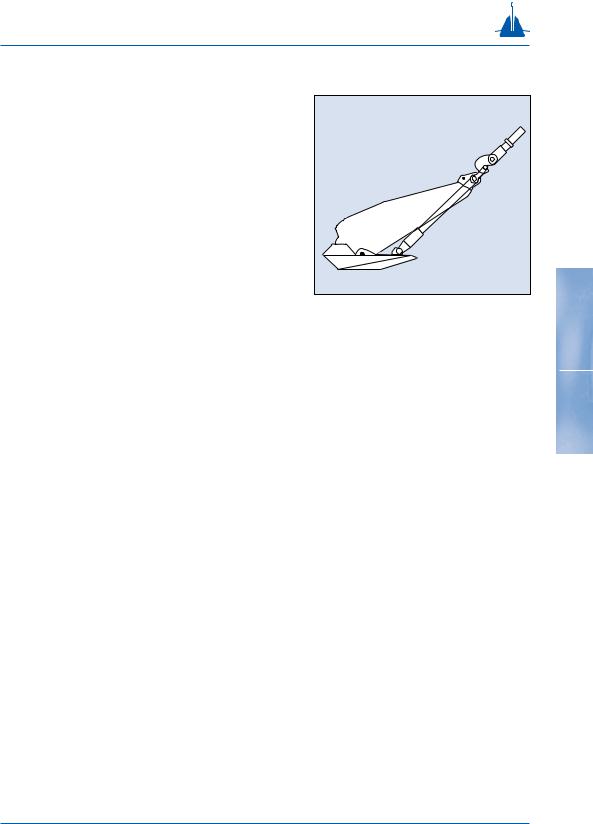
Proof loads for high holding power anchors
The proof load according to Classification Societies’ rules is applied at 1/3rd of the fluke length and is carried out immediately on fabrication of the anchor. It is obtained by placing the anchor in a test yoke in which a hydraulic cylinder applies the test loads, controlled by a calibrated manometer (fig. 2-17). The vryhof anchor types have been approved by the following Classification Societies:
•The American Bureau of Shipping
•Bureau Veritas
•Det Norske Veritas
•Germanischer Lloyd
•Lloyd’s Register of Shipping
•Registro Italiano Navale
•USSR Register of Shipping
•Nippon Kaiji Kyokai
•Norwegian Maritime Directorate
In the early days there were no specific regulations regarding the holding power and strength of mooring anchors. The rules which did exist were often followed regardless of the type of vessel.
Some anchors were approved as ‘high holding power’ anchors. This so-called HHP approval was obtained after carrying out field tests in various types of soil in which it had to be shown that an anchor provided a holding power of at least twice that of a standard stockless anchor. If an HHP anchor was requested by the owner, the anchor has proof tested in strict accordance with the rules, nothing more. See table J for some examples of HHP anchor proof loads. A more detailed overview of HHP anchor proof loads is given in the product data section.
fig. 2-17 |
|
Anchor |
Proof Load |
Anchor |
|
|
weight |
factor |
weight |
|
|
|
|
|
|
|
1 t |
26 t |
26 x |
|
|
5 t |
79 t |
15 x |
39 |
|
7 t |
99 t |
14 x |
|
|
10 t |
119 t |
12 x |
|
|
15 t |
155 t |
10 x |
|
|
20 t |
187 t |
9 x |
|
table J |
|
|
|
|
|
|
|
|
|
Proof loads for high holding power anchors
|
The use of the specified proof loads for HHP anchors |
|
can lead to situations where different types of |
|
anchors with the same holding capacity are proof |
|
loaded at different loads, see fig. 2-18. From this figu- |
|
re it can be concluded that the proof load of the |
|
anchors should preferably be related to the break- |
|
load of the mooring line on the vessel. |
|
Nowadays the rules and regulations are far more |
|
rigid, and the requirements have been substantially |
|
increased. There are now special rules for ‘mobile |
|
offshore units’ and ‘permanently moored structures’. |
|
If anchors need mobile offshore units certification, |
|
the following properties may be required: |
40 |
• Proof load of the anchors at 50% of the breaking |
load of the chain.
• Submission of a strength calculation of the anchor to the classification society prior to commencing anchor production: this includes determining the mechanical strength of the anchor as well as proving that the applied material can withstand the proofload.
• A statement of documented holding power from the anchor supplier.
• Submittal of a Quality Assurance/Quality Control Manual.
In fig. 2-19, a mooring system is shown in which all of the components are balanced. The strength of the mooring line, holding capacity of the anchor and strength of the anchor are all in the correct proportion and comply with the rules.
Proofload HHP anchors, UHC=250 t.
29 t Danforth |
|
|
|
|
|
10 t Stevin Mk3 |
|
|
|
|
|
4.5 t Stevshark Mk5 |
|
|
|
|
|
4 t Stevpris Mk5 |
|
|
|
|
|
0 |
50 |
100 |
150 |
200 |
250 |
fig. 2-18 |
|
Proofload in t |
|
|
|
Balanced mooring system API RP 2SK
Breakload chain |
|
|
|
|
|
|
|
|
|
|
Ultimate holding |
|
|
|
|
|
|
|
|
|
|
capacity anchor |
|
|
|
|
|
|
|
|
|
|
Damaged load floater |
|
|
|
|
|
|
|
|
|
|
Proofload chain |
|
|
|
|
|
|
|
|
|
|
Pretension |
|
|
|
|
|
|
|
|
|
|
load anchor |
|
|
|
|
|
|
|
|
|
|
Intact load floater |
|
|
|
|
|
|
|
|
|
|
Proofload anchor |
|
|
|
|
|
|
|
|
|
|
0 |
10 |
20 |
30 |
40 |
50 |
60 |
70 |
80 |
90 |
100 |
fig. 2-19 |
|
|
|
Load in % |
|
|
|
|
||
Quality control
The application of more advanced and complex technology in anchor construction has brought about requirements for a systematic approach to quality. Initiated by various authorities they are continuously refined and followed up by operating companies such as vryhof anchor. Like other companies, vryhof has become increasingly aware of the vital importance of managerial aspects and their influence on the total quality-assurance and control system.
Design and fabrication of anchors for permanent |
|
moorings are in accordance with the quality require- |
|
ments of the Rules NS/ISO 9001 as described in our |
|
Quality Assurance Manual. Vryhof anchors obtained |
|
the ISO 9001 certificate No. QSC 3189 issued by Det |
|
Norske Veritas for ‘Design, Manufacture of anchors, |
|
and Sales of anchors and mooring components’. |
41 |
Quality control is maintained throughout production. A compilation of certificates is presented to a client upon completion of a project.
ACCREDITED BY
THE DUTCH COUNCIL
FOR CERTIFICATION
Reg. No 24
ISO-9001CERTIFICATED FIRM
DET NORSKE VERITAS INDUSTRY B.V., THE NETHERLANDS
Anchor tests
Introduction
In addition to practical experience of users and associates, anchor tests are one of the most reliable means of forecasting anchor performance and thus making a proper choice of anchor type and size.
Examining anchor tests that have been carried out in the past, certain conclusions can be made:
•Many tests were undertaken in which the results were recorded accurately.
•Detailed reports, however, have not been very common.
•Anchor tests of the past are not always easy to interpret or compare because of different soil and anchor types.
•Test results have not always been interpreted
42independently.
•The more tests results are strictly compared to practical results, the better one can forecast the holding power and general behaviour in practice.
Vryhof is in the perfect situation of having detailed test data available together with extensive practical data obtained during installation and use of anchors on projects on site.
Research into anchor behaviour and the ultimate holding capacity of anchors is often carried out by testing a model anchor, preferably followed by a fullscale test in the field. The optimal anchor test consists of model tests with 10 kg anchors, followed by fullscale tests with 1 t and 10 t anchors. The anchors should be pulled until the ultimate holding capacity is reached.
It is obvious that full-scale testing of anchors can be expensive. Large AHVs, strong winches and strong mooring lines are required, which are not always available. For example, a 5 t Stevpris Mk5 anchor, deployed in sand, is capable of stopping a modern AHV at its full bollard pull. Testing a 10 t Stevpris Mk5
Anchor tests
anchor to its ultimate holding capacity in sand would require a horizontal pulling capacity of approximately 600 t.
If anchor tests are to be comparable, the testing program should preferably meet, as a minimum, the following criteria:
•An accurate and sophisticated measuring system should be used.
•The anchors should be tested up to their ultimate holding capacity.
•Drag and penetration of the anchor should be recorded during testing.
•The anchor should be held under tension with a blocked winch for 15 minutes, to investigate any drop in holding capacity.
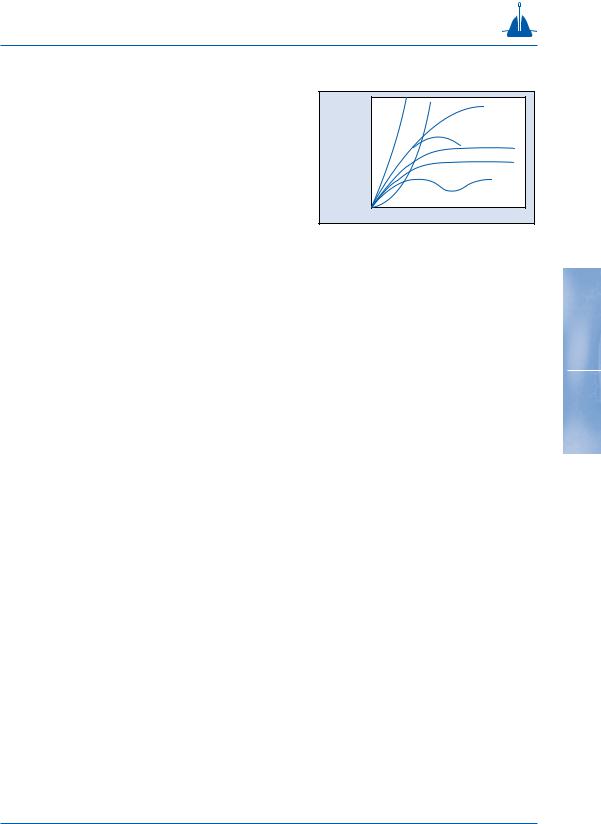
Reading test curves
The behaviour of an anchor during tensioning can be accurately interpreted from the holding capacity versus drag curve. Sample test curves are presented in Fig. 2-20. Properly interpreted performance curves can explain a lot about anchor behaviour.
•Curve A is very steep and represents a streamlined anchor in very stiff soil.
•Curve B is a normal curve for anchors in sand and medium clay.
•Curve C is a curve of an unstable anchor. This can be caused by a wrong fluke/shank angle setting, a short stabiliser or a fluke that is too long.
•Curve D is a normal curve for an anchor in very soft clay.
•Curve E is an anchor with a 32o fluke/shank angle in very soft clay.
•Curve F represents an anchor that is turning continuously. This can be caused by the absence of stabilisers, a too large fluke/shank angle or a low efficiency anchor at continuous drag.
•Curve G represents an anchor penetrating in a layer of stiff clay overlain by very soft clay.
Holding Capacity
fig. 2-20
A G B
C
D
E
F
Drag
43
Anchor tests
Curves A, B, D, E and G show a very stable rising line, which indicates that the anchor builds up its holding capacity constantly until the ultimate holding capacity has been reached, after which the anchor shows continuous drag. The other curves are largely selfexplanatory.
Test results
Vryhof’s extensive database of test results with different anchor types, sizes and soil conditions, has been frequently used in anchor design. Data has been obtained from practice, scale models and from third parties. The data has been interpreted and afterwards incorporated in the ultimate holding capacity, drag and penetration graphs of the Stevin Mk3 and Stevpris Mk5 anchor as well as in the ultimate pull-
44out capacity graph of the Stevmanta VLA.
Norwegian Contractors (1984)
In 1984 Norwegian Contractors carried out tests at Digernessundet, Stord, Norway. The purpose of these tests was to determine the correct anchor type and size for the mooring system of the Gullfaks A platform during the construction of the platform at Digernessundet. Although the construction would took place at one location, it was know that three different types of soil conditions would be encountered: sand, soft mud and an 8 m mud layer on rock. After the initial trials the Stevpris anchor was selected for further testing.
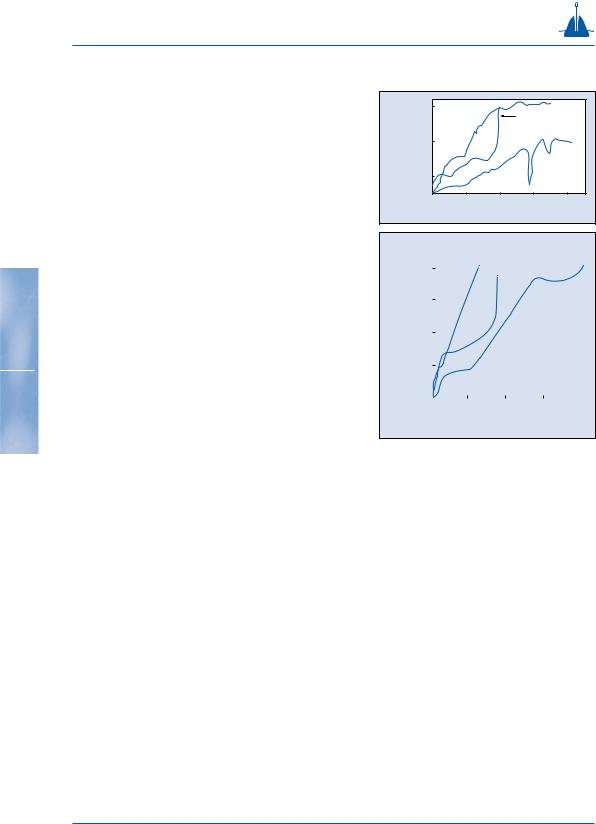
The 3 t Stevpris anchor that was used for the tests at a 3.30 pulling angle, produced a maximum holding capacity of 150 t in the sand, 102 t in the very soft clay and 150 t in the layer of mud on rock. As the mooring system required a survival load of 1500 t, a 65 t Stevpris (mud location), 40 t Stevpris (sand location) and 60 t Stevshark (mud on rock location) were selected for the final mooring. Fig. 2-21 shows the test results of the 3 t Stevpris anchor, while fig. 2-22 shows the result of the tensioning of the final anchors with a load of 820 t.
t |
150 |
in |
|
capacity |
100 |
Holding |
50 |
|
25 |
0
fig. 2-21
Sand 
8 m soft clay on rock
 soft clay
10 |
20 |
30 |
40 |
Drag in meters
Full scale Gullfaks A anchors
|
800 |
|
|
|
|
|
700 |
|
|
|
|
in t |
600 |
A |
B* |
C |
|
capacity |
|
|
|||
500 |
|
|
|
|
|
Holding |
400 |
|
|
|
|
300 |
|
Survival load = 1500 ton |
|
||
|
|
|
|
||
|
200 |
|
A = 40 t Stevpris in sand |
|
|
|
|
|
B = 60 t Stevshark in mud on rock |
|
|
|
100 |
|
C = 65 t Stevpris in mud |
|
|
|
|
|
* Final pretension load on site |
|
|
|
0 |
|
|
|
|
|
20 |
40 |
60 |
80 |
|
fig. 2-22 |
|
|
Drag in meters |
|
|
Anchor tests
Large scale anchor tests in the Gulf of Mexico
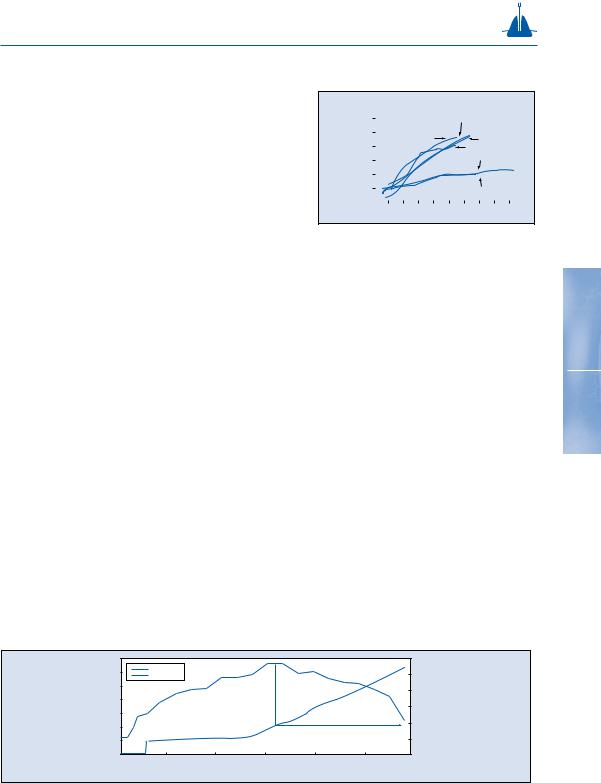
In 1990, tests were performed with 2 t and 7 t Stevpris Mk5 anchors, as part of an anchor test Joint Industry Project (JIP). The anchors were tested using a wire rope forerunner.
The 2 t Stevpris anchor was tested up to its ultimate holding capacity of 107 t (235 kips). Due to insufficient pulling capacity, the 7 t Stevpris anchor could not be pulled up to its ultimate holding capacity. Based on the results of tests, the ultimate holding capacity of the 7 t Stevpris anchor was calculated to be larger than 338 t (745 kips) (fig. 2-23).
Uplift
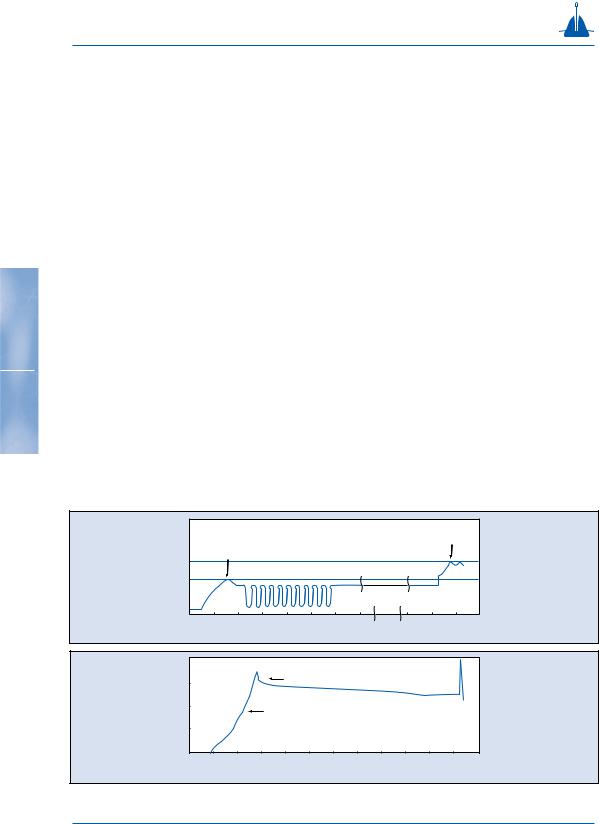
Stevpris anchors are well capable of resisting uplift loads when they are deeply embedded. Anchors in sand and firm to hard clays do not penetrate very deeply and only take small uplift loads. Stevpris anchors installed in very soft clay and mud penetrate deeply, a typical penetration for a 15 t anchor is 15 to 25 meters. Due to the inverse catenary in the soil, the anchor line arrives at the anchor shackle at an angle of 20o to 30o with the mud line. Once the anchor is installed, a load making an angle up to 20o with the horizontal at mud line will not change the loading direction at the anchor! A Stevpris anchor has been tested in the Gulf of Mexico with gradually increasing pull angle (fig. 2-24). The maximum resistance was obtained for 18o uplift at mud line.
Large scale anchor test jip - 7 & 2 t
kips |
700 |
|
|
|
|
|
|
|
|
|
|
|
|
|
|
|
|
600 |
|
|
|
|
|
|
|
7-3 |
|
|
|
|
|
|
|||
in |
500 |
|
|
7-2 |
|
|
|
|
7-4 |
|
|
|
|||||
|
|
|
|
|
|
|
|
|
|
|
|
||||||
load |
400 |
|
|
|
|
|
|
|
|
|
|
|
|
||||
|
|
|
|
|
|
|
|
|
|
|
|
||||||
|
|
|
|
|
|
|
7-1 |
|
|
|
|
||||||
Horizontal |
300 |
|
|
|
|
|
|
|
|
|
|
|
|
2-1 |
|
|
|
|
|
|
|
|
|
|
|
|
|
|
|
|
|
|
|
|
|
|
200 |
|
|
|
|
|
|
|
|
|
|
|
|
|
|
|
|
|
100 |
|
|
|
|
|
|
|
|
|
|
|
|
2-2 |
|
|
|
|
|
|
|
|
|
|
|
|
|
|
|
|
|
|
|
||
|
|
|
|
|
|
|
|
|
|
|
|
|
|
|
|
||
|
|
|
|
|
|
|
|
|
|
|
|
|
|
|
|
|
|
|
|
|
|
|
|
|
|
|
|
|
|
|
|
|
|
|
|
|
0 |
50 |
100 |
150 |
200 |
250 |
|
300 |
|
350 |
400 |
450 |
500 |
||||
fig. 2-23 |
|
|
|
Drag distance in feet |
|
|
|
||||||||||
45
|
35 000 |
|
|
|
|
|
60 |
mudine |
in lbs |
30 000 |
= dyn load |
|
|
|
|
|
|
= pull angle |
|
|
|
|
50 |
|||
|
|
|
|
|
||||
25 000 |
|
|
|
|
|
40 |
||
|
|
|
|
|
|
|||
|
|
|
|
|
|
|
||
Line load |
20 000 |
|
|
|
|
|
|
Line angle vs |
|
|
|
|
|
|
30 |
||
15 000 |
|
|
|
|
|
|
||
10 000 |
|
|
|
|
|
20 |
||
|
|
|
|
|
18˚ |
|||
|
|
|
|
|
|
|||
5 000 |
|
|
|
|
|
10 |
||
|
|
|
|
|
|
|||
0 |
|
|
|
|
|
0 |
||
|
|
|
|
|
|
|
||
|
0 |
50 |
100 |
150 |
200 |
250 |
300 |
|
fig. 2-24 |
Line length pulled in feet |
|
|
Anchor tests
Cyclic effect factor
The loading at the anchor is cyclic. Exxon performed cyclic tests on anchors reported by Dunnavent and Kwan, 1993. Although the maximum cyclic load was less than the initial installation load, the static load applied after the cycling phase revealed 25 to 50% larger anchor resistance than the initial installation load (fig. 2-25). This effect is explained by further penetration of the anchor. Applying this knowledge to the anchors, the static anchor resistance after some storm loading improves by the cyclic effect factor of 1.25 to 1.5.
Tests with Stevmanta anchors
Tests have been performed in the Gulf of Mexico and offshore Brazil. The Stevmanta anchor being pulled in
46with a load equal to F, accepted a vertical load to the anchor of up to 2 times F! Amongst the many tests the
anchor relaxation was measured. The anchor with a fluke area of 0.13 m2 was pulled in at 0o pull angle (fig. 2-26), then loaded vertically to a load equal 1.6 times the maximum installation load. At this load the winch was blocked.
Anchor resistance in kN
fig. 2-25
Line load in %
fig. 2-27
|
|
|
|
|
|
|
Increased capacity |
|
|
0.15 |
|
Initial static capacity |
|
vs initial static |
|
||||
|
|
|
|
|
|
|
|
|
|
0.1 |
|
|
|
Cycling |
|
|
|
|
|
|
|
|
|
|
|
|
|
|
|
0.0 |
|
|
|
|
|
|
|
|
|
0 |
50 |
100 |
150 |
200 |
250 |
300 |
350 |
|
|
|
|
|
|
|
Time in seconds |
|
|
||
200 |
|
|
|
|
|
|
|
|
|
150 |
|
|
|
Block winch |
|
|
|
||
100 |
|
|
|
Change from |
|
|
|
|
|
|
|
|
|
|
|
|
|
||
50 |
|
|
|
pull-in to normal mode |
|
|
|||
|
|
|
|
|
|
|
|
|
|
0 |
|
|
|
|
|
|
|
|
|
20.00 |
|
22.00 |
|
0.00 |
|
2.00 |
4.00 |
6.00 |
8.00 |
Time in seconds
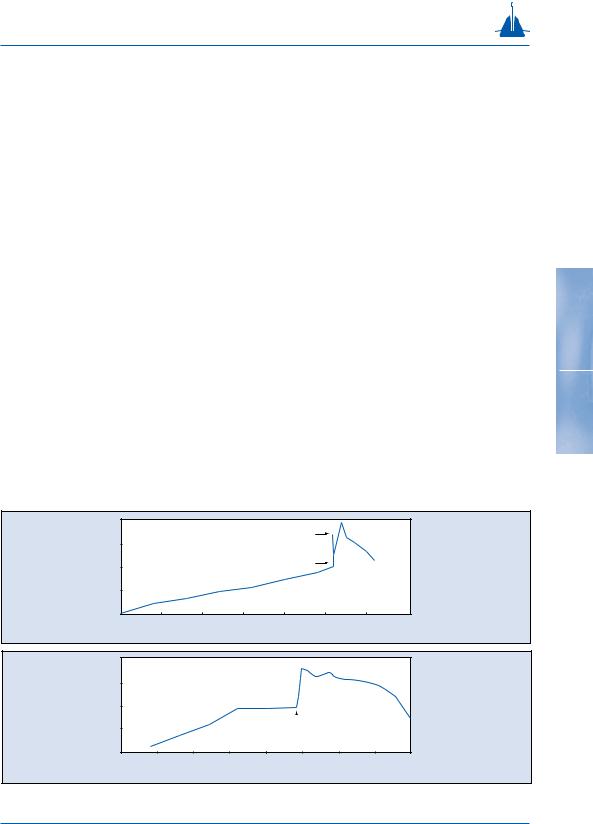
Anchor tests
This permitted the monitoring of the load with time (fig. 2-27) as what would be expected in real circumstances at a constant loaded anchor line. The results show that the holding capacity of the anchor does not change significantly during continuous loading, as the observed decrease in tension was due to movement of the winch. The subsequent pulling at 7:00 AM showed that for only a small movement, the full plate capacity (2 x installation load) could be reached. Continuous pulling caused the anchor to loose resistance and break out.
To demonstrate that the feature of these anchors is not only a vertical resistance, the anchor was installed with a horizontal pull, the mode changed to the normal (vertical) mode and the anchor subsequently
pulled with an uplift angle of 30o (fig. 2-28). The 47 behaviour is similar to the earlier vertical pull test.
However, for the 30o pull angle the anchor did not break out but moved slowly along the pulling direction through the soil. The graphs clearly show this effect and that the anchor can be used for substantial horizontal loads.
|
200 |
|
|
|
|
|
|
|
% |
|
|
|
|
Block winch |
|
|
|
150 |
|
|
|
|
|
|
|
|
in |
|
|
|
|
Change mode |
|
|
|
load |
100 |
|
|
|
|
|
|
|
|
|
|
|
|
|
|
|
|
Line |
50 |
|
|
|
|
|
|
|
|
|
|
|
|
|
|
|
|
|
0 |
|
|
|
|
|
|
|
|
0 |
5 |
10 |
15 |
20 |
25 |
30 |
35 |
fig. 2-26
Line load in %
fig. 2-28
Line length pulled in feet
200
150
100
Change from 
50
pull-in to normal mode
0
0 |
5 |
10 |
15 |
20 |
25 |
30 |
35 |
40 |
Line length pulled in feet