

Architectural Structures
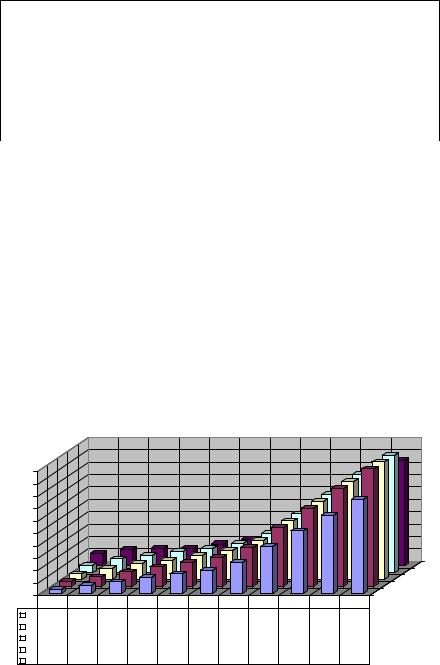
.pdfCs factors for light fram ing with wood panels (R=6, I=1)
0.50 |
|
|
|
|
|
|
|
|
|
|
|
|
0.45 |
|
|
|
|
|
|
|
|
|
|
|
|
0.40 |
|
|
|
|
|
|
|
|
|
|
|
|
0.35 |
|
|
|
|
|
|
|
|
|
|
|
|
0.30 |
|
|
|
|
|
|
|
|
|
|
|
|
0.25 |
|
|
|
|
|
|
|
|
|
|
|
|
0.20 |
|
|
|
|
|
|
|
|
|
|
|
|
0.15 |
|
|
|
|
|
|
|
|
|
|
E |
|
0.10 |
|
|
|
|
|
|
|
|
|
|
||
|
|
|
|
|
|
|
|
|
|
D |
||
0.05 |
|
|
|
|
|
|
|
|
|
|
B C |
|
0.00 |
|
|
|
|
|
|
|
|
|
|
A |
|
0.25 |
0.5 |
0.75 |
1 |
1.25 |
1.5 |
2 |
3 |
4 |
5 |
6 |
||
|
|
|
A |
0.02 |
0.03 |
0.05 |
0.06 |
0.08 |
0.10 |
0.13 |
0.19 |
0.25 |
0.32 |
0.38 |
|
|
||||||||||||
|
|
||||||||||||
|
|
B |
0.02 |
0.04 |
0.06 |
0.08 |
0.10 |
0.12 |
0.16 |
0.24 |
0.32 |
0.40 |
0.48 |
|
|
||||||||||||
|
|
||||||||||||
|
|
C |
0.02 |
0.05 |
0.07 |
0.08 |
0.10 |
0.12 |
0.16 |
0.24 |
0.32 |
0.40 |
0.48 |
|
|
||||||||||||
|
|
||||||||||||
|
|
D |
0.03 |
0.06 |
0.07 |
0.09 |
0.10 |
0.12 |
0.16 |
0.24 |
0.32 |
0.40 |
0.48 |
|
|
||||||||||||
|
|
||||||||||||
|
|
E |
0.05 |
0.07 |
0.07 |
0.07 |
0.09 |
0.11 |
0.14 |
0.21 |
0.29 |
0.36 |
0.43 |
|
|
||||||||||||
|
|
Cs for site class A-E for 0.2 sec mapped spectral accelerations Ss (top line)
Analysis steps
Define site class by geologist, or assume default site class D (IBC table 1615.1.1) Define Mapped Spectral Accelerations SS and S1
For overview see USGS maps at left: 0.2 sec low-rise (top) 1 sec high-rise (bottom) Enter Site coordinates at USGS web site: http://eqdesign.cr.usgs.gov/html/lookup-2002-interp-D6.html
Enter latitude in the left box in decimal degrees (range: 24.6 to 50.0) Enter negative longitude in the right box (range: -125.0 to -65.0) Web output:
LOCATION 37.7795 Lat. -122.4195 Long.
Interpolated Probabilistic Ground Motion(Spectral Acceleration SA) in %g, at the site are:
10%PE in 50 yr. 2%PE in 50 yr. |
→ SS = 1.83 (for low-rise) |
|
0.2 sec SA 115.35 |
182.76 % |
|
1.0 sec SA 53.08 |
92.41 % |
→ S1 = 0.92 (for high-rise) |
Low-rise: T<TS |
|
(structures < 5 stories) |
High-rise: T>TS |
|
(structures > 10 stories) |
TS = SDS/SD1 |
|
(For SDS and SD1 see graphs on following pages) |
Define base shear |
V (lateral force at base of structure) |
|
V = CS W
W = Dead load (+ 25% storage live load + 20% flat roof snow load > 30 psf) CS= seismic coefficient - see sample graph at left (SS at top line)
For other structures: |
|
CS = I SDS / R |
(for T < TS) |
Need not exceed |
|
CS = I SD1 / (TR) |
(for T > TS) |
I = Importance factor |
(IBC table 1604.5) |
R = R-factor |
(IBC table 1617.6.2) |
SDS and SD1 |
(See graphs on the following pages) |
CS varies with spectral acceleration SS & S1 and type of structure (defined on the following pages)
For example, in seismic areas:
CS ~ 3 % for tall steel frame structures CS ~ 15 % for low-rise wood structures
CS ~ 30 % for some low-rise masonry structures
W = w A (w = dead load, DL in psf, A = total gross floor area of building) w varies with type of construction – for example:
w ~ 15 to 25 psf for wood structures w ~ 70 to 100 psf for steel structures
w ~ 150 to 200 psf for concrete structures
9-15 DESIGN METHODS Lateral Force Design
IBC table 1615.1.1 Site class definitions excerpts
Site class |
Soil profile name |
Average shear velocity in top 100 ft (30 m) |
||||||||
A |
Hard rock |
Vs > 5000 ft/s (1500 m/s) |
|
|
|
|
||||
B |
Rock |
Vs = 2500 to 5000 ft/s (760 to 1500 m/s) |
||||||||
C |
Very dense soil & soft rock |
Vs = |
1200 to 2500 ft/s (370 to 760 m/s) |
|
||||||
D |
Stiff soil |
Vs = |
600 to 1200 ft/s (180 to 370 m/s) |
|
||||||
E |
Soft soil |
Vs < 600 ft/s (180 m/s) |
|
|
|
|
||||
F |
Soil vulnerable to failure, very organic clay, high plasticity clay, etc. |
|
||||||||
|
|
|
|
|
|
|
||||
IBC table 1617.6.2 excerpt |
R-factor |
Height limits (ft), categories A-F |
||||||||
Bearing wall systems |
|
|
A B |
C |
|
D |
E |
|
F |
|
Light framed walls with wood panels |
6 |
|
NL |
NL |
|
65 |
65 |
|
65 |
|
Light framed walls with other panels |
2 |
|
NL |
NL |
|
35 |
NP |
|
NP |
|
Ordinary reinforced concrete walls |
4 |
|
NL |
NL |
|
NP |
NP |
|
NP |
|
Special reinforced concrete walls |
5 |
|
NL |
NL |
|
160 |
160 |
|
100 |
|
Ordinary reinforced masonry walls |
2 |
|
NL |
160 |
|
NP |
NP |
|
NP |
|
Special reinforced masonry walls |
5 |
|
NL |
NL |
|
160 |
160 |
|
100 |
|
Building frame systems |
|
|
|
|
|
|
|
|
|
|
Ordinary steel concentric braced frames |
5 |
|
NL |
NL |
|
35 |
35 |
|
NP |
|
Special steel concentric braced frames |
6 |
|
NL |
NL |
|
160 |
160 |
|
100 |
|
Ordinary steel moment frames |
3.5 |
|
NL |
NL |
|
NP |
NP |
|
NP |
|
Special steel moment frames |
8 |
|
NL |
NL |
|
NL |
NL |
|
NL |
|
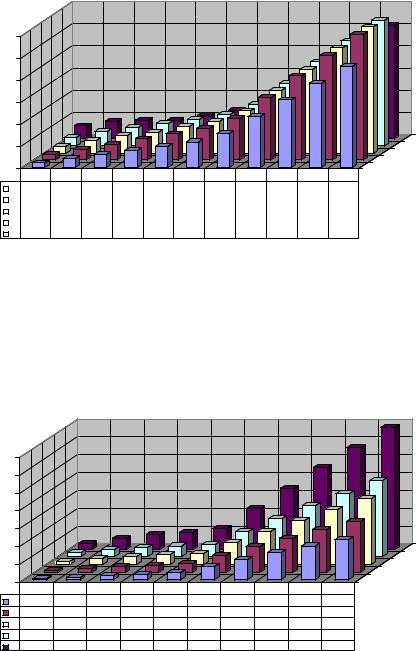
Cs factors for light framing with wood panels (R=6, I=1)
0.50 |
|
|
|
|
|
|
|
|
|
|
|
|
0.45 |
|
|
|
|
|
|
|
|
|
|
|
|
0.40 |
|
|
|
|
|
|
|
|
|
|
|
|
0.35 |
|
|
|
|
|
|
|
|
|
|
|
|
0.30 |
|
|
|
|
|
|
|
|
|
|
|
|
0.25 |
|
|
|
|
|
|
|
|
|
|
|
|
0.20 |
|
|
|
|
|
|
|
|
|
|
|
|
0.15 |
|
|
|
|
|
|
|
|
|
|
D E |
|
0.10 |
|
|
|
|
|
|
|
|
|
|
||
0.05 |
|
|
|
|
|
|
|
|
|
|
C |
|
|
|
|
|
|
|
|
|
|
|
A B |
||
0.00 |
|
|
|
|
|
|
|
|
|
|
||
0.25 |
0.5 |
0.75 |
1 |
1.25 |
1.5 |
2 |
3 |
4 |
5 |
6 |
||
|
|
|
A |
0.02 |
0.03 |
0.05 |
0.06 |
0.08 |
0.10 |
0.13 |
0.19 |
0.25 |
0.32 |
0.38 |
|
|
||||||||||||
|
|
|
|
|
|
|
|
|
|
|
|
|
|
|
|
B |
0.02 |
0.04 |
0.06 |
0.08 |
0.10 |
0.12 |
0.16 |
0.24 |
0.32 |
0.40 |
0.48 |
|
|
||||||||||||
|
|
|
|
|
|
|
|
|
|
|
|
|
|
|
|
C |
0.02 |
0.05 |
0.07 |
0.08 |
0.10 |
0.12 |
0.16 |
0.24 |
0.32 |
0.40 |
0.48 |
|
|
||||||||||||
|
|
|
|
|
|
|
|
|
|
|
|
|
|
|
|
D |
0.03 |
0.06 |
0.07 |
0.09 |
0.10 |
0.12 |
0.16 |
0.24 |
0.32 |
0.40 |
0.48 |
|
|
||||||||||||
|
|
|
|
|
|
|
|
|
|
|
|
|
|
|
|
E |
0.05 |
0.07 |
0.07 |
0.07 |
0.09 |
0.11 |
0.14 |
0.21 |
0.29 |
0.36 |
0.43 |
|
|
Cs for site class A-E for 0.2 sec mapped spectral accelerations Ss (top line)
Example: One-story residence, San Francisco
Assume: Light framing with plywood panels
36’x40’x10’ high, DL = 25 psf, site class undefined, use default D, I = 1 Enter site coordinates at USGS web site http://eqdesign.cr.usgs.gov/html/lookup-2002-interp-D6.html
Web site output
0.2 sec Spectral Acceleration
Design Spectral Accelerations (see graph)
At Ss = 2.0 |
CS = 0.16 |
|
Interpolate CS at Ss = 1.85 |
(CS /1.85 = 0.16 / 2.0) |
|
CS = 1.85 x 0.16 / 2.0
Building dead weight
W = 25 psf x 36’x40’
Base Shear
V = CS W = 0.15 x 36,000
Example: Same residence in San Francisco on site class A
CS factor (see graph)
Interpolate CS at Ss = 1.85 (CS /1.85 = 0.13 / 2.0) CS = 0.13x1.85/ 2.0
Base shear V = CS W = 0.12 x 36,000
Example: Same residence in Tucson
Site class D, SS = 0.329
CS factor (see graph)
Interpolate for Ss = 0.329 (CS/0.329 = 0.06/05)
CS = 0.329x0.06 / 0.5
Base shear V = CS W = 0.04 x 36,000
Example: Same residence in Tucson on site class A
CS factor (see graph)
Interpolate for Ss = 0.329 (at Ss = 0.5 CS = 0.03) CS = 0.329 x 0.03 / 0.5
Base shear V = CS W = 0.02 x 36,000
Compare seismic factors
Los Angeles site class D
Los Angeles site class A
Tucson site class D
Tucson site class A
Ss = 1.85
CS =0.15
W = 36,000#
V = 5,400 #
CS = 0.12 V = 4,320 #
CS = 0.04 V = 1,440 #
CS = 0.02 V = 720 #
Cs = 0.15
Cs = 0.12
Cs = 0.04
Cs = 0.02
9-16 DESIGN METHODS Lateral Force Design
|
|
|
|
SDS graph 0.2 sec. design spectral accelerations |
|
|||||||
3.0 |
|
|
|
|
|
|
|
|
|
|
|
|
2.5 |
|
|
|
|
|
|
|
|
|
|
|
|
2.0 |
|
|
|
|
|
|
|
|
|
|
|
|
1.5 |
|
|
|
|
|
|
|
|
|
|
|
|
1.0 |
|
|
|
|
|
|
|
|
|
|
|
|
|
|
|
|
|
|
|
|
|
|
|
E |
|
0.5 |
|
|
|
|
|
|
|
|
|
|
D |
|
|
|
|
|
|
|
|
|
|
|
|
C |
|
0.0 |
|
|
|
|
|
|
|
|
|
|
A B |
|
0.25 |
0.5 |
0.75 |
1 |
1.25 |
1.5 |
2 |
3 |
4 |
5 |
6 |
||
|
||||||||||||
|
|
A |
0.10 |
0.19 |
0.29 |
0.38 |
0.48 |
0.57 |
0.76 |
1.14 |
1.52 |
1.90 |
2.28 |
|
|
||||||||||||
|
|
||||||||||||
|
|
B |
0.12 |
0.24 |
0.36 |
0.48 |
0.60 |
0.71 |
0.95 |
1.43 |
1.90 |
2.38 |
2.86 |
|
|
||||||||||||
|
|
||||||||||||
|
|
C |
0.14 |
0.29 |
0.39 |
0.48 |
0.60 |
0.71 |
0.95 |
1.43 |
1.90 |
2.38 |
2.86 |
|
|
||||||||||||
|
|
||||||||||||
|
|
D |
0.19 |
0.33 |
0.43 |
0.52 |
0.60 |
0.71 |
0.95 |
1.43 |
1.90 |
2.38 |
2.86 |
|
|
||||||||||||
|
|
||||||||||||
|
|
E |
0.30 |
0.40 |
0.43 |
0.43 |
0.54 |
0.64 |
0.86 |
1.29 |
1.71 |
2.14 |
2.57 |
|
|
||||||||||||
|
|
SDS for site class A-E for 0.2 sec. mapped spectral accelerations SS (top line)
|
|
|
SD1 graph 1 sec. design spectral accelerations |
||||||||
3.5 |
|
|
|
|
|
|
|
|
|
|
|
3.0 |
|
|
|
|
|
|
|
|
|
|
|
2.5 |
|
|
|
|
|
|
|
|
|
|
|
2.0 |
|
|
|
|
|
|
|
|
|
|
|
1.5 |
|
|
|
|
|
|
|
|
|
|
|
1.0 |
|
|
|
|
|
|
|
|
|
E |
|
|
|
|
|
|
|
|
|
|
|
D |
|
0.5 |
|
|
|
|
|
|
|
|
|
C |
|
|
|
|
|
|
|
|
|
|
|
B |
|
0.0 |
|
|
|
|
|
|
|
|
|
A |
|
0.1 |
0.2 |
0.3 |
0.4 |
0.5 |
1 |
1.5 |
2 |
2.5 |
3 |
||
|
|||||||||||
A |
0.04 |
0.08 |
0.11 |
0.15 |
0.19 |
0.38 |
0.57 |
0.76 |
0.95 |
1.14 |
|
B |
0.05 |
0.10 |
0.14 |
0.19 |
0.24 |
0.48 |
0.71 |
0.95 |
1.19 |
1.43 |
|
C |
0.08 |
0.15 |
0.21 |
0.27 |
0.31 |
0.62 |
0.93 |
1.24 |
1.55 |
1.86 |
|
D |
0.11 |
0.19 |
0.26 |
0.30 |
0.36 |
0.71 |
1.07 |
1.43 |
1.79 |
2.14 |
|
E |
0.17 |
0.30 |
0.40 |
0.46 |
0.57 |
1.14 |
1.71 |
2.28 |
2.86 |
3.43 |
|
SD1 for site class A-E for 1 sec. mapped spectral accelerations S1 (top line)
General CS factors
The previous examples are limited to light framing with wood panels For other structures the CS factor must be computed:
For low-rise structures of T< TS For high-rise structure of T > TS
See graphs at left for SDS and SD1 (Design Spectral Accelerations)
Example: 7-story special steel moment frame
Assume: Office building, 90’x180’x84’ high, DL=70 psf Site class D, I = 1, R = 8, Ss = 1.81, S1 = 1.00
Time period (see ASCE 7 table 1615.1.1) T = CT h0.8 = 0.028 x 840.8
Design Spectral Accelerations (see graphs at left) At Ss = 1.81 Interpolate SDS = 1.81 x 0.95 / 2 At S1 = 1.00
Design response spectrum limit TS = SDS /SD1= 0.86/0.71
T<TS
CS = I SDS / R = 1 x 0.86 / 8 Structure dead load
W = 7 x 70 psf x 90’ x 180’/1000 Base shear
V = CS W = 0.11 x 7,938
Example: 20-story special (ductile) steel moment frame
Assume: Office building, 90’x180’x250’ high, DL=70 psf
Same site and seismic factors as above but I = 1.25 (Occupancy > 300), R = 8 Time period
T = CT h0.8 = 0.028 x 840.8
Design Spectral Accelerations (see graphs at left) At Ss = 1.81 Interpolate SDS = 1.81 x 0.95 / 2 At S1 = 1.00
Design response spectrum limit TS = SDS /SD1= 0.86/0.71
T>TS
CS = I SD1/(TR) = 1.25x0.71/(2.32x8) Structure dead load
W = 20x70 psf x90’x180’/1000 Base shear
V = CS W = 0.048x22,680
Example: 20-story ordinary (non-ductile) steel moment frame
CS = I SD1/(TR) = 1.25x0.71/(2.32x3.5), R = 3.5
Base shear
V = CS W = 0.109x22,680
9-17 DESIGN METHODS Lateral Force Design
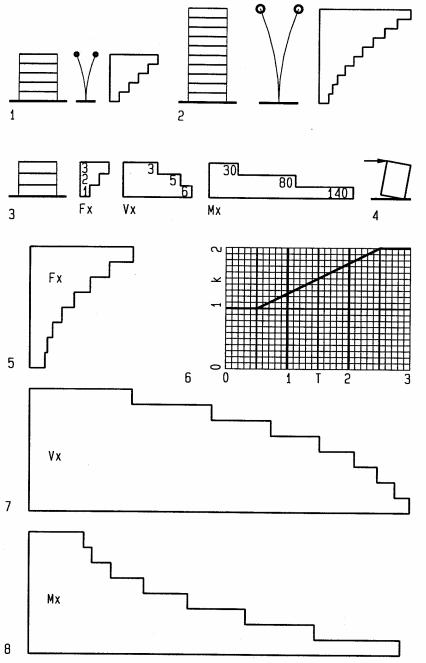
Vertical distribution
Seismic forces increase with building height since f = ma (force = mass x acceleration), i.e., increased drift increases acceleration. Thus story forces Fx are story mass times height above ground. For buildings with periods of 0.5 seconds or less the force increase is considered liner. For tall buildings the story-force varies non-linear. Since all story forces are resisted at the ground, each story must resist its own force plus all forces from above. Thus shear per level increases from top to bottom. The overturn moment per level is the sum of all forces above times their distance to the level considered.
1Linear force increase for T ≤ 0.5 seconds
2Non-linear force increase for T > 0.5
3Distribution per level of force Fx = force per level x
Vx = Shear per level x = sum all forces above
V2 = 3 k |
V2 = 3 k |
||
V1 = 3 k + 2 k |
V1 = 5 k |
||
V0 = 5 k + 1 k |
V0 = 6 k |
||
Mx = overturn moment per level = sum of all forces above times level arm |
|
|
|
Assuming 10’ story height: |
|
|
|
M2 |
= 3 k x10’ |
M2 |
= 30 k’ |
M1 |
= 3 k x20 + 2 k x 10’ |
M1 |
= 80 k’ |
M0 |
= 3 k x 30’ + 2 k x 20’ + 1 k x 10’ |
M0 = 140 k’ |
|
4Overturn moment visualized
5Force per level Fx =Cvx V
n
Cvx = wxhx /∑wihki (vertical distribution factor)
i=1
W = total dead weight of level x
h = height of level x above ground n = total number of stories
k = exponent related to structure period k = 1 for T ≤ 0.5 seconds
k = 2 for T > 2.5 seconds
k = interpolated between T = 0.5 and 2.5
6k Interpolation graph
7Shear per level
Vx = ∑n Fi
i=x
8 Overturn moment per level
Mx = ∑n Fi (hn - hi )
i=x
9-18 DESIGN METHODS Lateral Force Design
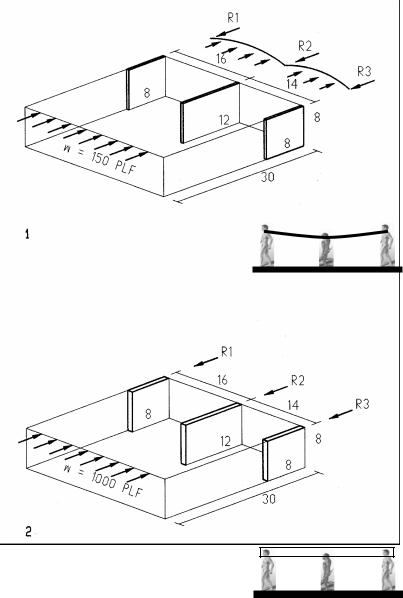
Horizontal diaphragms
Horizontal floor and roof diaphragms transfer lateral load to walls and other supporting elements. The amount each wall assumes depends if diaphragms are flexible or rigid.
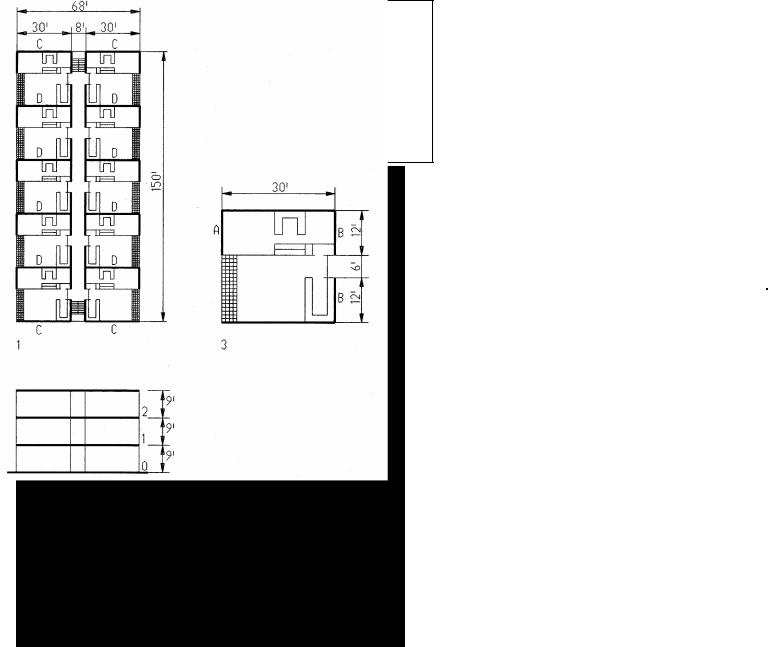
1Flexible diaphragm
Floors and roofs with plywood sheathing are usually flexible; they transfer load, similar to simple beams, in proportion to the tributary area of each wall
Wall reactions R are computed based on tributary area of each wall
Required shear flow q (wall capacity) |
|
|
|
|
q = R / L (L = length of shear wall) |
|
|
|
|
R = w (tributary width) |
q = R / L |
(L = shear wall length |
||
R1 |
= (150)16/2 = 1200 lbs |
q = 1200 |
/ 8’ |
q = 150 plf |
R2 |
= (150)(16+14)/2 = 2250 lbs |
q = 2250 |
/ 12’ |
q = 188 plf |
R3 |
= (150)14/2 = 1050 lbs |
q = 1050 |
/ 8’ |
q = 131 plf |
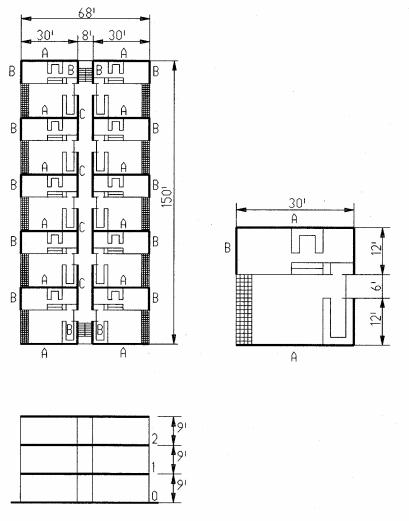
2Rigid diaphragm
Concrete slabs and some steel decks are rigid; they transfer load in proportion to the relative stiffness of each wall. Since rigid diaphragms experience only minor deflections under load they impose equal drift on walls of equal length and stiffness.
For unequal walls reactions are proportional to a resistance factor r.
r = E I / h3 / ∑ (E I / h3) |
|
|
|
|
||
h = wall height |
|
|
|
|
||
I = bL3 / 12 |
(moment of inertia of wall) |
|||||
b = wall thickness |
|
|
|
|
||
L = wall length |
|
|
|
|
||
For walls of equal height, thickness and material, the resistance factors are: |
||||||
r = L3 / Σ L3 |
|
|
|
|
||
L13 = L33 = 83 = 512 |
|
|
|
|
||
L23 = 123 = 1728 |
|
|
|
|
||
∑ L3 = 512 + 1728 + 512 |
Σ L3 = 2752 |
|||||
r1 = 512 / 2752 |
r1 = 0.186 |
|||||
r2 = 1728 / 2752 |
r2 = 0.628 |
|||||
r3 = 512 / 2752 |
r3 = 0.186 |
|||||
|
|
|
|
|
|
|
Check Σ r |
Σ |
r = 1.000 |
|
|||
Total force F |
|
|
|
|
||
F = 1000 plf x (16’+14’) / 1000 |
|
|
F = 30 k |
|||
Wall reactions |
|
|
|
|
||
R1 = r1 F = 0.186 x 30 k |
R1 = 5.58 k |
|||||
R2 = r2 F = 0.628 x 30 k |
R2 = 18.84 k |
|||||
R3 = r3 F = 0.186 x 30 k |
R3 = 5.58 k |
|||||
|
|
|
|
|||
Check Σ R |
Σ R = 30,00 k |
|||||
9-19 DESIGN METHODS Lateral Force Design
IBC table 2306.4.1 excerpts
Allowable shear for wood panels with Douglas-Fir-Large or Southern Pine
|
|
|
|
Nail spacing at panel edge (inches) |
|||||
Panel |
Panel |
Nail |
Nail size |
6 |
|
4 |
3 |
|
2 * |
grade |
thickness |
penetration |
|
Allowable shear (lbs / foot) |
|
||||
|
|
|
|||||||
StructuralI sheathing |
5/16 in |
1 1/4 in |
6d |
200 |
|
300 |
390 |
|
510 |
3/8 in |
1 3/8 in |
8d |
230 |
|
360 |
460 |
|
610 |
|
7/16 in |
1 3/8 in |
8d |
280 |
|
430 |
550 |
|
730 |
|
|
1 3/8 in |
8d |
255 |
|
395 |
505 |
|
670 |
|
|
15/32 in |
|
|
|
|
|
|
|
|
|
1 1/2 in |
10d |
340 |
|
510 |
665 |
|
870 |
|
|
|
|
|
||||||
* Requires 3 x framing and staggered nailing
Example: Flexible diaphragm |
|
|
|
|
|
|
|
||||||
Assume: plywood diaphragm, plywood shear walls on light wood framing |
|
|
|||||||||||
Dead load |
|
|
|
|
|
|
|
|
|
DL= 23 psf |
|||
Seismic factor (adjusted for ASD) |
|
|
|
|
|
Cs = 0.15 |
|||||||
Dead load per level |
|
|
|
|
|
|
|
|
|
||||
W = 23 psf x 68’ x 150’ / 1000 |
|
|
|
|
|
W = 235 k |
|||||||
Total DL (3 levels) |
|
|
|
|
|
|
|
|
|
||||
∑ W = 3 x 245 k |
|
|
|
|
|
|
|
∑ W = 705 k |
|||||
Base shear |
|
|
|
|
|
|
|
|
|
|
|
||
V = W Cs = 705 x 0.15 |
|
|
|
|
|
|
|
V = 106 k |
|||||
Force distribution |
|
|
|
|
|
|
|
|
|
||||
Level |
|
Wx |
|
hx |
|
Wxhx |
wxhx/Σwihi |
Fx=V(wxhx/Σwihi) |
Vx =Σ Fx |
||||
|
2 |
|
247 k |
|
27’ |
|
6669 k’ |
0.50 |
|
|
53 k |
53 k |
|
|
1 |
|
247 k |
|
18’ |
|
4446 k’ |
0.33 |
|
|
35 k |
88 k |
|
|
0 |
|
247 k |
|
9’ |
|
2223 k’ |
0.17 |
|
|
18 k |
106 k |
|
|
|
|
|
|
Σwih |
I = 13,338 k’ |
|
|
|
|
V = 106 k |
||
Area per level A = 68 (150) |
|
|
|
|
|
A= 10200 ft2 |
|||||||
Shear per square foot v |
|
|
|
|
v = V / A |
v (psi) |
|||||||
|
|
|
|
|
|
|
|
|
|||||
V0 = 106 k = 106000 lbs |
|
|
|
v0 = 106000/10200 |
v0=10.4 psf |
||||||||
V1 = |
88 k = |
88000 lbs |
|
|
|
v1 = 88000/10200 |
v1 = 8.6 psf |
||||||
V2 = |
53 k = |
53000 lbs |
|
|
|
v2 = 53000/10200 |
v2 = 5.2 psf |
||||||
Level 0 shear walls |
|
|
|
|
|
Wall A = 10.4 psf (15’)30’/12’ = |
390 plf |
use 5/16, 6d @ 3” = |
390 plf |
||
Wall B = 10.4 psf (19’)30’/24’ = |
247 plf |
use 7/16, 8d @ 6” = |
255 plf |
||
Wall C = 10.4 psf (34’)15’/30’ = |
177 plf |
use 5/16, 6d @ 6” = |
200 plf |
||
Wall D = 10.4 psf (34’)30’/30’ = |
354 plf |
use 3/8, 8d @ 4” = |
360 plf |
||
Level 1 shear walls |
|
|
|
|
|
Wall A = 8.6 psf (15’)30’/12’ = |
323 plf |
use 15/32, 10d |
@ 6” = |
340 plf |
|
Wall B = 8.6 psf (19’)30’/24’ = |
204 plf |
use 3/8, |
8d |
@ 6” = |
230 plf |
Wall C = 8.6 psf (34’)15’/30’ = |
146 plf |
use 5/16, |
6d |
@ 6” = |
200 plf |
Wall D = 8.6 psf (34’)30’/30’ = |
292 plf |
use 5/16, |
6d |
@ 4” = |
300 plf |
Level 2 shear walls |
|
|
|
|
|
Wall A = 5.2 psf (15’)30’/12’ = |
195 plf |
use 5/16, 6d @ 6” = |
200 plf |
||
Wall B = 5.2 psf (19’)30’/24’ = |
124 plf |
use 5/16, 6d @ 6” = |
200 plf |
||
Wall C = 5.2 psf (34’)15’/30’ = |
89 plf |
use 5/16, 6d @ 6” = |
200 plf |
||
Wall D = 5.2 psf (34’)30’/30’ = |
177 plf |
use 5/16, 6d @ 6” = |
200 plf |
||
Note: To simplify construction, fewer wall types could be selected
9-20 DESIGN METHODS Lateral Force Design
|
|
Example: Rigid diaphragm |
|
|
|
|
|
|
|||||
|
|
Assume: concrete slab on CMU shear walls |
|
|
|
|
|||||||
|
|
Allowable masonry shear stress |
|
|
Fv = 85 psi |
||||||||
|
|
Seismic factor Cs = 0.17x1.5 |
|
|
|
|
Cs = 0.26 |
||||||
|
|
Note: increase Cs by 1.5 per IBC 2106.5.1 for ASD method |
|
|
|||||||||
|
|
Dead Load |
|
|
|
|
|
|
|
|
|||
|
|
Wall lengths L = 12 (30’)+14 (12)+8 (24) |
|
|
L= 720’ |
||||||||
|
|
Wall DL = (720’) 8’(7.625”/12”) 120 pcf / (68x150) |
|
DL = 43 psf |
|||||||||
|
|
Floor/roof (12” slab) |
|
|
|
|
|
|
150 psf |
||||
|
|
Miscellaneous |
|
|
|
|
|
|
7 psf |
||||
|
|
Σ DL |
|
|
|
|
|
|
|
|
|
Σ DL = 200 psf |
|
|
|
DL / level: W = 200 psf x 68’ x 150’/ 1000 |
|
|
W = 2,040 k |
||||||||
|
|
DL for 3 Levels: W = 3 x 2040 k |
|
|
W = 6,120 k |
||||||||
|
|
Base shear V = Cs W = 0.26 x 6120 |
|
|
V = 1,591 k |
||||||||
|
|
Force distribution |
|
|
|
|
|
|
|
|
|||
|
|
Level |
|
Wx |
|
hx |
|
Wxhx |
|
wxhx/Σwihi |
Fx= V(wxhx/Σwihi) |
Vx = Σ Fx |
|
|
|
2 |
|
2,040 k |
|
27’ |
|
55,080 k’ |
|
1591x0.50 |
796 k |
796 k |
|
|
|
1 |
|
2,040 k |
|
18’ |
|
36,720 k’ |
|
1591x0.33 |
525 k |
1,321 k |
|
|
|
0 |
|
2,040 k |
|
9’ |
|
18,360 k’ |
|
1591x0.17 |
270 k |
1,591 k |
|
|
|
|
|
|
|
Σwih |
I = 110,169 k’ |
|
|
|
V = 1,591 k |
||
|
|
Relative wall stiffness: |
|
|
|
|
|
|
|
|
|||
|
|
R = L3 / Σ L3 |
|
|
|
|
|
|
|
|
|||
|
|
Wall B: r = 123 / [123+243] |
|
|
|
|
r = 0.11 |
||||||
|
|
Wall C: r = 243 / [123+243] |
|
|
|
|
r = 0.89 |
||||||
|
|
Wall cross section areas: |
|
|
|
|
|
|
|||||
|
|
A walls = 12(30’)12”(7.625”) |
|
|
|
|
A = 32940 in2 |
||||||
|
|
B walls = 14(12’)12”(7.625”) |
|
|
|
|
B = 15372 in2 |
||||||
|
|
C walls = 8(24’)12”(7.625”) |
|
|
|
|
C = 17568 in2 |
||||||
|
|
Level 0 (V0 = 1591 k) |
|
|
|
|
|
|
48 psi < 85 |
||||
|
|
Wall A = (1591) 1000 / 32940 |
|
|
|
|
|||||||
|
|
Wall B = (1591) 1000 (0.11) / 15372 |
|
|
11 psi < 85 |
||||||||
|
|
Wall C = (1591) 1000 (0.89) / 17568 |
|
|
81 psi < 85 |
||||||||
|
|
Level 1 (V1 = 1321 k) |
|
|
|
|
|
|
40 psi < 85 |
||||
|
|
|
|
|
|
|
|
||||||
|
|
Wall A = (1321) 1000 / 32940 |
|
|
|
|
|||||||
|
|
Wall B = (1321) 1000 (0.11) / 15372 |
|
|
10 psi < 85 |
||||||||
|
|
Wall C = (1321) 1000 (0.89) / 17568 |
|
|
67 psi < 85 |
||||||||
|
|
Level 2 (V2 = 796 k) |
|
|
|
|
|
|
24 psi < 85 |
||||
|
|
Wall A = (796) 1000 / 32940 |
|
|
|
|
|||||||
|
|
Wall B = (796) 1000 (0.11) / 15372 |
|
|
6 psi < 85 |
||||||||
|
|
Wall C = (796) 1000 (0.89) / 17568 |
|
|
40 psi < 85 |
||||||||
|
|
9-21 |
DESIGN METHODS |
Lateral Force Design |
|
|
|
||||||
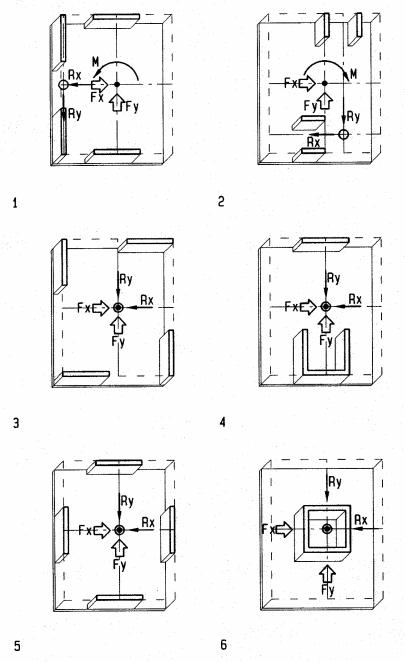
Seismic design issues
Eccentricity
Offset between center of mass and center of resistance causes eccentricity which causes torsion under seismic load. The plans at left identify concentric and eccentric conditions:
1 X-direction concentric Y-direction eccentric
2 X-direction eccentric Y-direction eccentric
3 X-direction concentric Y-direction concentric 4 X-direction concentric Y-direction concentric
5 X-direction concentric Y-direction concentric 6 X-direction concentric Y-direction concentric
Note:
Plan 5 provides greater resistance against torsion than plan 6 due to wider wall spacing Plan 6 provides greater bending resistance because walls act together as core and thus provide a greater moment of inertia
9-22 DESIGN METHODS Lateral Force Design
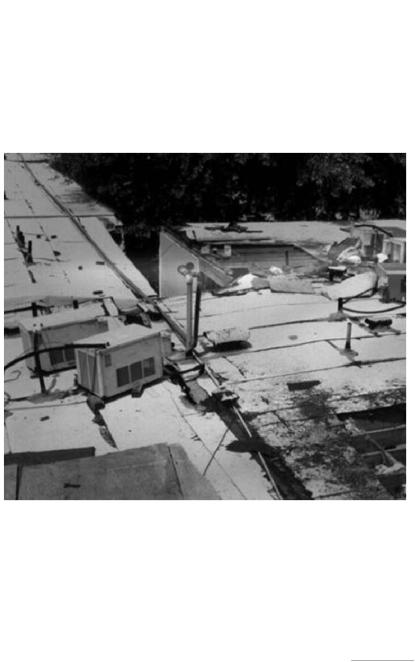
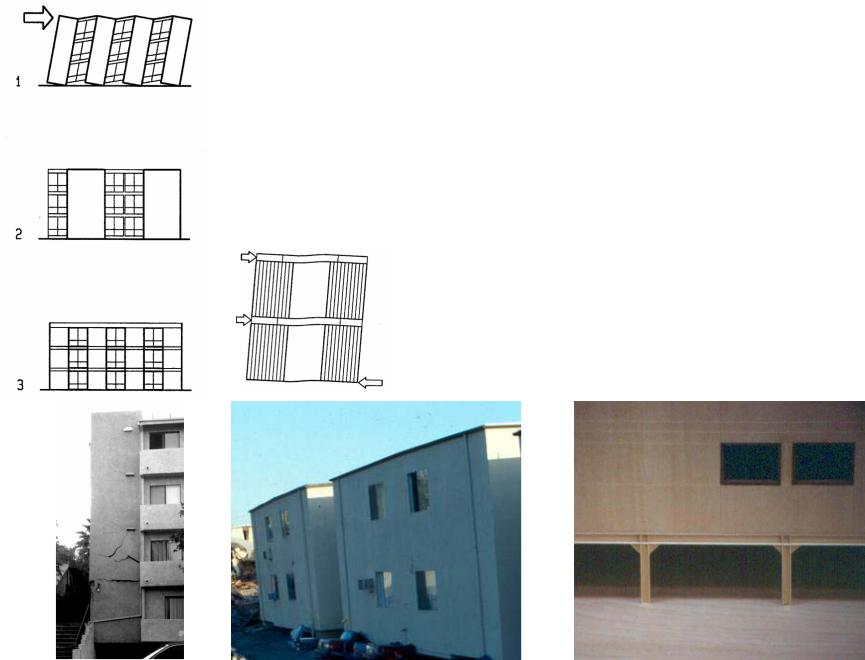
Hazard Configurations
Irregular configurations, such as H, L,T, and U-shapes, may split at intersections of wings due to differential movement in earthquakes.
Differential periods split wing intersections during Northridge Earthquake
Mitigation:
•Provide seismic joints at low-rise wing intersections
•Reinforce high-rise intersections (to avoid pounding of adjacent wings)
9-23 DESIGN METHODS Lateral Force Design
Stability Issues
1 Narrow shear walls are vulnerable to overturning
2 Architectural mitigation:
Combine adjacent windows to provide wider shear walls
3 Structural mitigation:
Attach shear walls to edge beams designed to resists wall overturning in bending
4 Slender wall failure
5 Soft-story tuck-under parking collapse
6 Moment frames to stabilize tuck-under parking
4 |
5 |
6 |
9-24 DESIGN METHODS Lateral Force Design