

Architectural Structures
.pdfVector components
Vector components have the same effect on a body as the initial vector. Thus components relate to a vector as two vectors relate to a resultant or equilibriant.
1The component forces C1 and C2 in two cables supporting a load P are found by drawing a force triangle [B] with corresponding lines parallel to the those in the vector plan [A].
2Forces in more than two cables supporting a load P are indeterminate [C] and cannot be found by graphic vector method since there are infinite number of solutions [D]. A problem with more than two unknown force components requires consideration of relative cable stiffness (cross-section area, length, and stiffness). Hence we can state:
Only two components can be found by graphic vector method
3This example demonstrates graphic vector analysis: Forces are drawn on a vector plan with line of action and direction [E]. The magnitude may be written on each vector or the vector may be drawn at a force scale. A force polygon [F] is drawn next at a force scale, such as 1” = 1k. For good accuracy, the force scale should be as large as space permits. The line of action of the equilibriant (or resultant) is then transposed into the vector plan at the intersection of all force vectors [E].
4-14 MECHANICS Statics
Truss Analysis
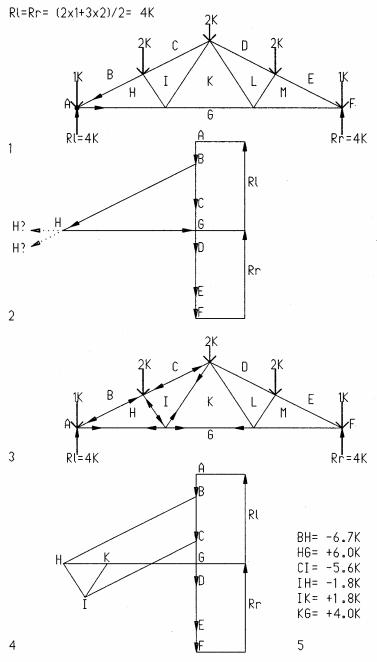
Graphic truss analysis (Bow’s Notation) is a method to find bar forces using graphic vectors as in the following steps:
ADraw a truss scaled as large as possible (1) and compute the reactions as for beams (by moment method for asymmetrical trusses).
BLetter the spaces between loads, reactions, and truss bars. Name bars by adjacent letters: bar BH between B and H, etc.
CDraw a force polygon for external loads and reactions in a force scale, such as 1”=10 pounds (2). Use a large scale for accuracy. A closed polygon with head-to- tail arrows implies equilibrium. Offset the reactions to the right for clarity.
DDraw polygons for each joint to find forces in connected bars. Closed polygons with head-to-tail arrows are in equilibrium. Start with left joint ABHG. Draw a vector parallel to bar BH through B in the polygon. H is along BH. Draw a vector parallel to bar HG through G to find H at intersection BH-HG.
EMeasure the bar forces as vector length in the polygon.
F |
Find bar tension and compression. Start with direction of load AB and follow |
|
polygon ABHGA with head-to-tail arrows. Transpose arrows to respective bars in |
|
the truss next to the joint. Arrows pushing toward the joint are in compression; |
|
arrows pulling away are in tension. Since the arrows reverse for adjacent joints, |
|
draw them only on the truss but not on the polygon. |
GDraw equilibrium arrows on opposite bar ends; then proceed to the next joint with two unknown bar forces or less (3). Draw polygons for all joints (4), starting with known loads or bars (for symmetrical trusses half analysis is needed).
1Truss diagram
2Force polygon for loads, reactions, and the first joint polygon
3Truss with completed tension and compression arrows
4Completed force polygon for left half of truss
5Tabulated bar forces (- implies compression)
4-15 MECHANICS Statics
Truss Example
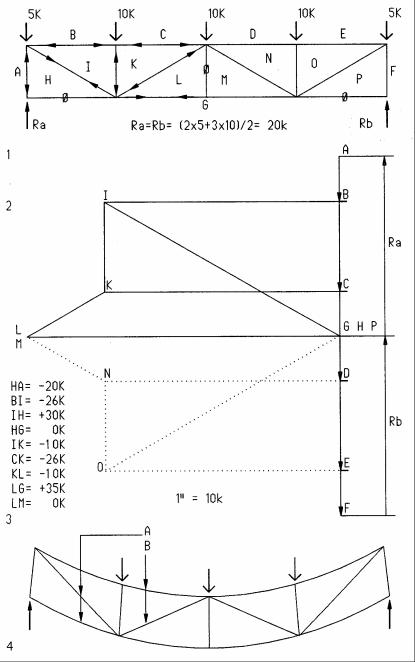
Some trusses have bars with zero force under certain loads. The example here has zero force in bars HG, LM, and PG under the given load. Under asymmetrical loads these bars would not be zero and, therefore, cannot be eliminated. Bars with zero force have vectors of zero length in the equilibrium polygon and, therefore, have both letters at the same location.
Tension and compression in truss bars can be visually verified by deformed shape (4), exaggerated for clarity. Bars in tension will elongate; bars in compression will shorten. In the truss illustrated the top chord is in compression; the bottom chord is in tension; inward sloping diagonal bars in tension; outward sloping diagonal bars in compression.
Since diagonal bars are the longest and, therefore, more likely subject to buckling, they are best oriented as tension bars.
1Truss diagram
2Force polygon
3Tabulated bar forces (+ implies tension, - compression)
4Deformed truss to visualize tension and compression bars
ABar elongation causes tension
BBar shortening causes compression
4-16 MECHANICS Statics
Funicular
Graphic vector are powerful means to design funicular structures, like arches and suspension roofs; providing both form and forces under uniform and random loads.
Arch
Assume:
Arch span L = 150, arch spacing e = 20’ DL = 14 psf
LL = 16 psf Σ = 30 psf
Uniform load |
|
w = 30 psf x 20’ / 1000 |
w = 0.6 klf |
Vertical reactions |
|
R = w L /2 = 0.6 x 150 / 2 |
R = 45 k |
Draw vector polygon, starting with vertical reaction R |
|
Horizontal reaction |
H = 56 k |
Max. arch force (diagonal vector parallel to arch tangent) |
F = 72 k |
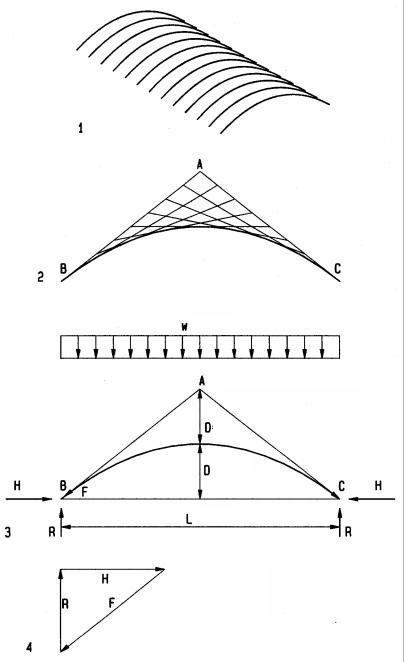
1Arch structure
2Parabolic arch by graphic method Process:
Draw AB and AC (tangents of arch at supports) Divide tangents AB and AC into equal segments
Lines connecting AB to AC define parabolic arch envelope
3Arch profile Process:
Define desired arch rise D (usually D = L/5) Define point A at 2D above supports
AB and AC are tangents of parabolic arch at supports Compute vertical reactions R = w L /2
4Equilibrium vector polygon at supports (force scale: 1” = 50 k) Process:
Draw vertical vector (reaction R)
Complete vector polygon (diagonal vector parallel to tangent) Measure vectors (H = horizontal reaction, F = max. arch force)
Note:
The arch force varies from minimum at crown (equal to horizontal reaction), gradually increasing with arch slope, to maximum at the supports.
4-17 MECHANICS Statics
Suspension roof
Assume:
Span L = 300, cable spacing e = 10’, sag f = 30’, height difference h = 50’ DL = 14 psf
LL = 16 psf Σ = 30 psf
|
Uniform load |
|
|
w = 30 psf x 10’ / 1000 |
w = 0.3 klf |
|
Total load |
|
|
W = w L = 0.3 x 300 |
R = 90 k |
|
Draw vector polygon, starting with total load W |
|
|
Horizontal reaction |
H = 113 k |
|
Vertical reactions |
|
|
Left reactions |
Rl = 26 k |
|
Right reaction |
Rr = 64 k |
|
Cable tension |
|
|
At left support |
Tl =115 k |
|
At right support (maximum) |
Tr = 129 k |
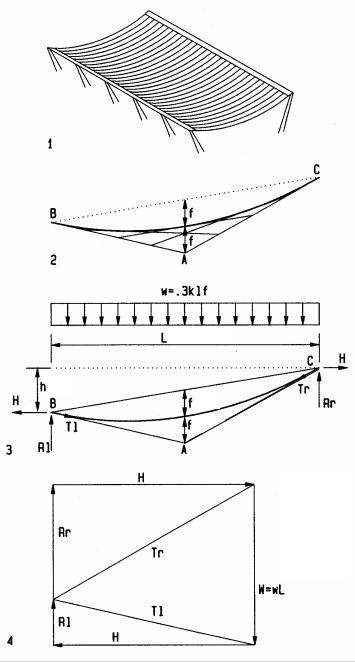
1Cable roof structure
2Parabolic cable by graphic method Process:
Draw AB and AC (tangents of cable at supports) Divide tangents AB and AC into equal segments
Lines connecting AB to AC define parabolic cable envelop
3Cable profile Process:
Define desired cable sag f (usually f = L/10) Define point A at 2f below midpoint of line BC
AB and AC are tangents of parabolic cable at supports Compute total load W = w L
4Equilibrium vector polygon at supports (force scale: 1” = 50 k) Process:
Draw vertical vector (total load W) Draw equilibrium polygon W-Tl-Tr
Draw equilibrium polygons at left support Tl-H-Rl
Draw equilibrium polygons at right support Tr-Rr-H
Measure vectors H, Rl, Rr at force scale
Note:
This powerful method finds five unknowns: H, Rl, Rr. Tl. Tr
The maximum cable force is at the highest support
4-18 MECHANICS Statics
5
Strength Stiffness Stability
This chapter introduces the theory and examples of strength, stiffness, and stability described n the following sections: Force types; force vs. stress; allowable stress; axial stress; shear stress; principle stress and Mohr’s circle; torsion; strain; Hooke’s law; Poisson’s ratio; creep, elastic modulus; thermal strain; thermal stress; and stability.
5-1 MECHANICS Strength Stiffness Stability
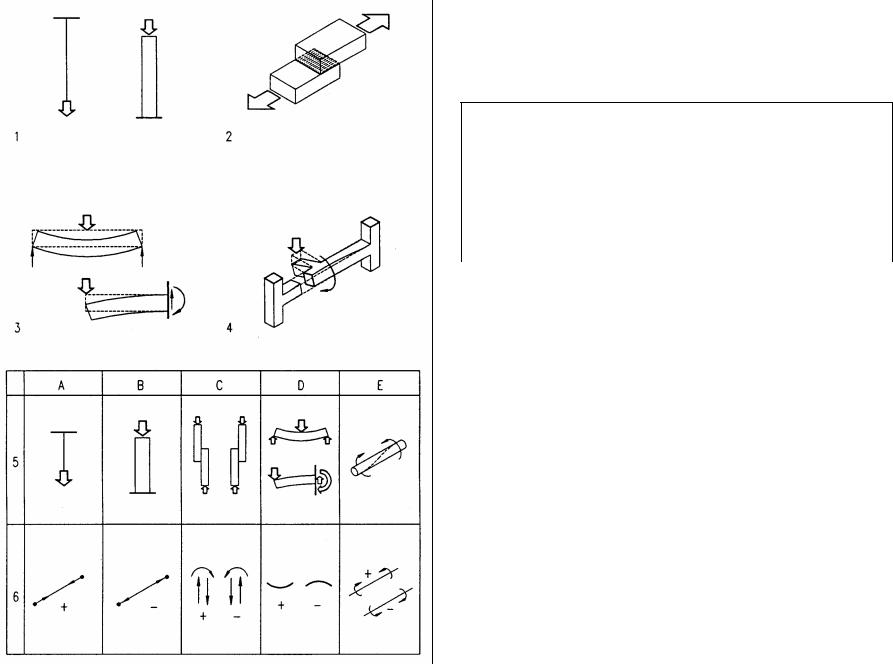
Force types
Forces on structures include tension, compression, shear, bending, and torsion. Their effects and notations are tabulated below and all but bending and related shear are described on the following pages. Bending and related shear are more complex and further described in the next chapter.
Type of forces
Force type |
Action |
Symbol |
Notation |
|
Tension |
Elongates |
Internal reaction |
+ |
|
arrows |
||||
|
|
|
||
Compression |
Shortens |
Internal reaction |
- |
|
arrows |
||||
|
|
|
||
Shear |
Sliding force |
Arrow couple |
Clockwise couple + |
|
Bending |
Elongates one side |
Concave and |
Concave arc + |
|
shortens other side |
convex arcs |
Convex arc - |
||
|
||||
Torsion |
Twists |
Bar with arrows |
Right-hand-rule + |
1Axial force (tension and compression)
2Shear
3Bending
4Torsion
5Force actions
6Symbols and notations
ATension
BCompression
CShear
DBending
ETorsion
5-2 MECHANICS Strength Stiffness Stability
Force vs. stress
Force and stress refer to the same phenomena, but with different meanings. Force is an external action, measured in absolute units: # (pound), k (kip); or SI units: N (Newton), kN (kilo Newton). Stress is an internal reaction in relative units (force/area ), measured in psi (pound per square inch), ksi (kip per square inch); or SI units: Pa (Pascal), kPa (kilo
Pascal). Axial stress is computed as:
f = P / A where
f = stress P = force
A = cross section area
Note: stress can be compared to allowable stress of a given material.
•Force is the load or action on a member
•Stress can be compared to allowable stress for any material, expressed as: F ≥ f (Allowable stress must be equal or greater than actual stress) where
F = allowable stress f = actual stress
The type of stress is usually defined by subscript:
Fa, fa Fb, fb Fv, fv
(axial stress, capital F = allowable stress) (bending stress, capital F = allowable stress) (shear stress, capital F = allowable stress)
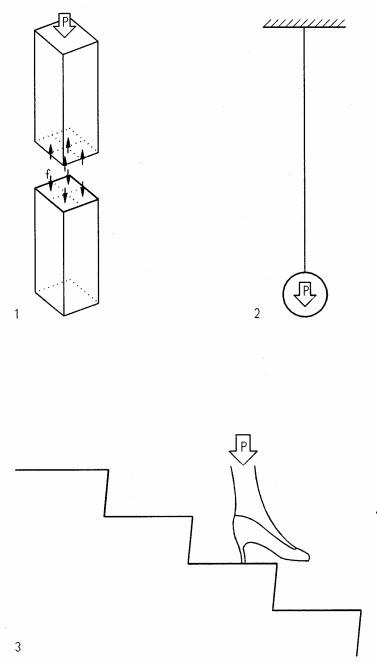
The following examples of axial stress demonstrate force and stress relations:
1 |
Wood column (compression) |
|
|
Assume: Force P = 2000#, allowable stress F = 1000 psi |
|
|
A = 2 x 2 = 4 in2 (cross section area) |
|
|
Stress f = P / A ‘ 2000# / 4 |
f = 500 psi |
|
|
1000 > 500, ok |
2 |
Steel rod (tension) |
|
|
Assume: P = 6 k, ½” rod, Fa = 30 ksi |
A = 0.2 in2 |
|
Cross section area A = π r2 = (0.5/2)2 π |
|
|
Stress f = P / A = 5 k / 0.2 |
f = 25 ksi |
|
|
25 < 30, ok |
3 Spiked heel on wood stair (compression)
Assume: P = 200# (impact load), A = 0.04 in2, Fa= 400 psi
Stress f = P / A = 200 / 0.04 f = 5000 psi 5000 >> 400. NOT ok
Note: The heel would sink into the wood, yield it and mark an indentation
5-3 MECHANICS Strength Stiffness Stability
Axial stress
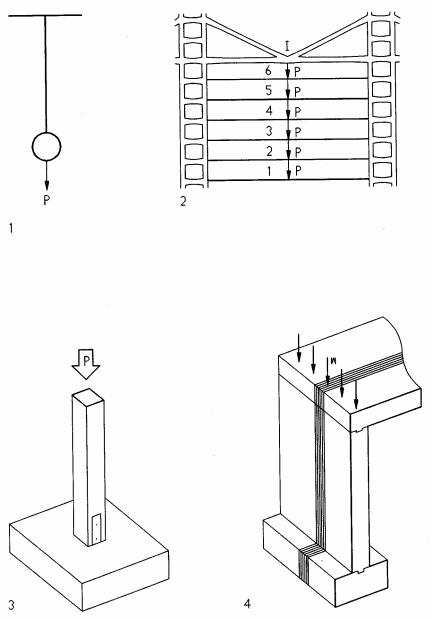
Axial stress acts in the axis of members, such as columns. Axial tension is common in rods and cables; wile axial compression is common in walls and columns. The following examples illustrates axial design and analysis. Analysis determines if an element is ok; design defines the required size. The equation, fa = P/A, is used for analysis. The equation A = P/Fa, is used for design. Allowable stress, Fa, includes a factor of safety.
1Crane cable design
Assume: P = 12 k, Fa = 70 ksi Find required cable size
Metallic cross section Am (cables are about 60% metallic)
|
Am = P / Fa = 12 k / 70 ksi |
Am = 0.17 in2 |
|
Gross cable area |
|
|
Ag = Am/ 0.6 = 0.17 / 0.6 |
Ag = 0.28 in2 |
|
Cable size |
|
|
φ= 2 (A/π)1/2 = 2 (0.28 / π)1/2 = 0.6” |
use φ= 5/8” |
2 |
Suspension hanger analysis (Hong Kong-Shanghai bank) |
|
|
Assume: load per floor P=227 k, Fa=30 ksi, level 1 A = 12 in2. level 6 A = 75 in2 |
|
|
Hanger stress |
|
|
Level 1: fa = P / A = 227 / 12 |
fa = 19 ksi < 30 |
|
Level 6: fa = 6 P / A = 6 x 227 / 75 |
fa = 18 ksi < 30 |
3Post/footing analysis
Assume: P = 12,000 #, 3’x3’x2’ footing at 150 pcf, 4x4 post (3.5”x3.5” actual) Allowable post stress Fa = 1000 psi, allowable soil pressure Fs = 2000 psf Post stress
P/A = 12,000 # / (3.5”x 3.5”) Soil pressure
fs = P/A = (12,000 # + 3’x3’x2’x150 pcf)/ (3’x3’)
4Slab/wall/footing, analyze a 1’ wide strip
Assume: allowable wall stress Fa = 360 psi; allowable soil pressure Fs=1500 psf Concrete slab, t =8” thick, L = 20’ span
CMU wall, h =10’, DL = 80 psf, t = 8” nominal (7 5/8” = 7.625” actual)
Slab load |
|
100 psf DL+ 40 psf LL |
DL+LL =140 psf |
Load at wall base |
|
P = 140psf (20’/2) + 80 psf (10’) |
P = 2,200 # |
Wall stress |
|
fa = P / A = 2200 # / (12”x7.625”) |
fa = 24 psi < 360 |
Load on soil |
|
P = 2200 + 150 pcf x 2’ x 1’ |
P = 2,500 # |
Soil pressure |
|
fs = 2,500 # / (1’ x2’) |
fs = 1250 psf < 1500 |
5-5 MECHANICS Strength Stiffness Stability |
|
Shear stress
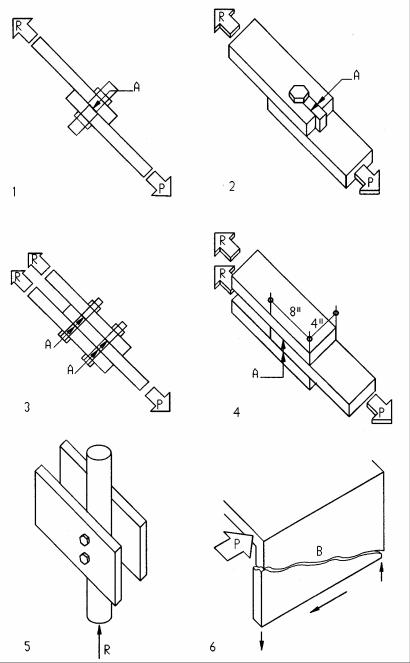
Shear stress occurs in many situations, including the following examples, but also in conjunction with bending, described in the next chapter on bending. Shear stress develops as a resistance to sliding of adjacent parts or fibers, as shown on the following examples. Depending on the number of shear planes (the joining surface [A] of connected elements) shear is defined as single shear or double shear.
AShear plane
BShear crack
1Single shear
Assume: P = 3 k = 3000 #, 2”x4” wood bars with ½” bolt of Fv = 20 ksi Shear area (bolt cross section)
A = π r2 = π (0.5/2)2 |
A = 0.2 in2 |
Shear stress fv = P / A = 3/ 0.2 |
fv = 15 ksi < 20 |
2Check end block (A)
Assume: Block length 6”, wood Fv = 95 psi, all other as above
End block shear area A = 2x 2” x 6” |
A =24 in2 |
Shear stress fv = P / A = 3000# / 24 |
fv =125 psi > 95 |
|
NOT ok |
Required block length e = 125 x 6”/ 95 = 7.9: |
use e = 8 |
3Double shear
Assume: P = 22 k, 2 5/8” bolts of Fv = 20 ksi
Shear area A = 4π r2 = 4 π (0.625/2)2 |
A = 1.2 in2 |
Shear stress fv = P / A = 22 / 1.2 |
fv = 18 ksi < 20 |
4Double shear, glued
Assume: P = 6000 #, Wood bars, Fv = 95 psi
Shear area A = 2 x 4” x 8” |
A = 64 in2 |
Shear stress Fv = P / A = 6000 / 64 |
fv =94 psi < 95 |
5Twin beam double shear
Assume: P = R = 12 k, 2 ½“ bolts, Fv = 20 ksi
Shear area A = 4π r2 = 4 π (0.5/2)2 |
A = 0.79 in2 |
Shear stress fv = P / A = 12 / 0.79 |
fv = 15 ksi < 20 |
6Shear wall
Assume: P = 20 k, 8” CMU wall, t = 7.625”, L = 8’, Fv = 30 psi
Shear area A = 7.625” x 12” x 8 ‘ |
A =732 in2 |
Shear stress fv = P / A = 20,000 # / 732 |
fv = 27 psi < 30 |
5-6 MECHANICS Strength Stiffness Stability |
|