

Architectural Structures
.pdfIBC Fig. 1609. Basic wind speed (3-second gust)
Map values are nominal design 3-second gust wind speeds in mph (m/s) at 33 ft (10 m) above ground for Exposure C. Mountains, gorges, ocean promontories, and special wind regions shall be examined for special wind conditions.
Steady winds are static |
Gusty winds are dynamic |
Design for Wind
Wind forces are very complex, effected by building form, height, flexibility and openness, as well as topography, environment, wind velocity and direction. Tornadoes are the most destructive. United States tornados occur between Rocky mountains and Appalachian mountains with speeds over 200 mph. However, the probability of any building to be hit is remote. Hurricanes along the Atlantic coast range from 90 to 150 mph. Typhoons, similar to hurricanes, occur in the Pacific, Indian Ocean, Arabian Sea, and Australia.
Wind speed increases with height. Wind load is defined by speed, both constant velocity and dynamic gusts. As air moves along the earth it is slowed near the ground due to friction, which also makes wind more erratic. Wind speed is less in cities but gusts are greater. When wind encounters a building it flows around and over it, causing pressure on the windward side, negative suction on the leeward side and side walls, and pressure or suction on the roof. Flat roofs and leeward slopes are subject to suction, as well as shallow windward slopes, but steep windward roofs have pressure. Wind flow is effected by form; square plans have greater pressure than round ones. Forms like aircraft wings streamline air flow with least resistance. Buildings drift in wind and vibrate in gusts. Wind pressure on edges, ridges and eaves is greater than the mean surface pressure. This is important for cladding and curtain walls.
Wind design methods assume pressure increases with height. However, wind tunnel tests show maximum wind pressure at about 2/3 the building height, reducing toward the top due to air flow over the roof. Regular buildings are designed for wind in two orthogonal directions. Unusual forms may require to investigate other directions, such as 45 degrees. Unusual forms may also require wind tunnel tests. For example wind tunnel tests for the unique Toronto City Hall showed wind load greater than required by code. Structures sensitive to dynamic behavior may also require wind tunnel tests. Wind resistance is effected by type of construction. Buildings of heavy material resist wind better than light buildings. Skeleton buildings with light curtain walls are more vulnerable to wind load than old bearing wall buildings. Flexible structures may sway and vibrate under wind gusts.
Lateral drift is an important issue in tall buildings to assure human comfort and prevent damage or failure of curtain walls, partitions, and other architectural items. IBC tables 1604.3 and 1617.3.1 limit allowable deflection and drift. However, less than code drift may be desirable to prevent damage or failure of curtain walls, partitions and other items and assure occupant comfort. Story drift of h/400 implies about 0.4 inch drift; greater drift could dislodge glass panels. Total drift of h/400 in a 60-story building implies about 2 foot drift each way on top; more drift might cause discomfort for occupants. Given the complexity of computing drift, it is best analyzed by computer.
9-2 DESIGN METHODS Lateral Force Design
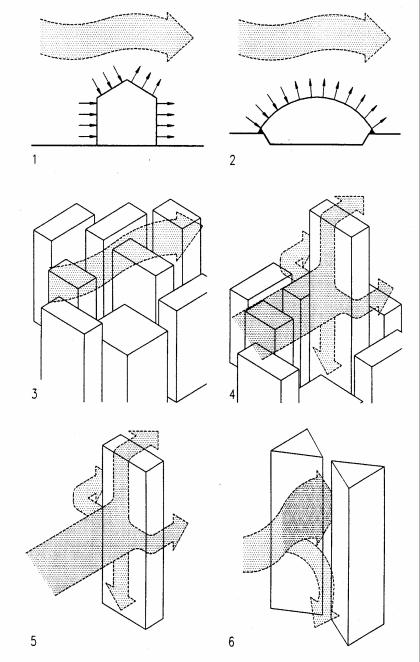
Wind load
1Wind load on gabled building
2Wind load on dome or vault
3Protected buildings inside a city
4Exposed tall building inside a city
5Wind flow around and above exposed building
6Wind speed amplified by building configuration
Wind channeled between buildings causes a Venturi effect of increased wind speed. Air movement through buildings causes internal pressure that effects curtain walls and cladding design. Internal pressure has a balloon-like effect, acting outward if the wind enters primarily on the windward side. Openings on leeward or side walls cause inward pressure. In tall buildings with fixed curtain wall the difference between outside wind pressure and interior pressure causes air movement from high pressure to low pressure. This causes air infiltration on the windward side and outflow on the leeward side. In highrise buildings, warm air moving from lower to upper levels causes pressures at top levels on the leeward face and negative suction on lower levels. Wind pressure is based on the equation developed by Daniel Bernoulli (1700-1782). For steady air flow of velocity V, the velocity pressure, q, on a rigid body is
q = pV2 / 2
p = air density |
(air weight divided by the acceleration of gravity g = 32.2 ft/sec2) |
Air of 15°C at sea level weighs 0.0765 Ib/ft3, which yields:
q = 0.00256V2 |
(q in psf) |
The American National Standards Institute (ANSI) Minimum design loads for buildings and other structures (ANSI A58.1 - 1982), converted dynamic pressure to velocity pressure qz (psf) at height z as
qz = 0.00256 Kz (I V)2 |
|
|
Kz = 2.58(z/zg)2/a |
(for buildings of 15 ft or higher) |
|
a |
= Power coefficient |
(see exposures A – D below) |
Z = |
Height above ground |
|
Zg = Height at which ground friction no longer effects the wind speed |
||
|
|
(see exposures A - D below) |
I |
= Importance factor |
(see IBC table 1604.5) |
ANSI A58.1 defined exposures A, B, C, D (IBC uses B, C, D only): |
a = 3.0, Zg = 1500 ft |
|
Exposure A |
Large city centers |
|
Exposure B |
Urban and suburban areas, wooded areas |
a = 4.5, Zg = 1200 ft |
Exposure C |
Flat, open country with minimal obstructions |
a = 7.0, Zg = 900 ft |
Exposure D |
Flat, unobstructed coastal areas |
a = 10.0, Zg = 700 ft |
9-3 DESIGN METHODS Lateral Force Design
Wind effect
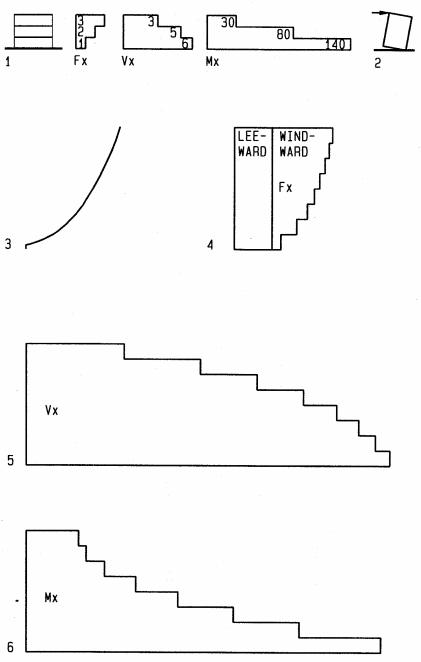
A building in the path of wind causes wind pressure which in turn causes force, shear, and overturn moment at each level that must be resisted, following a load path to the foundations (wind wall pressure transfers to horizontal diaphragms, then to shear walls, finally to foundation). Wind pressure times tributary area per level causes lateral force per level. Shear per level, the sum of wind forces above, defines required resistance. Overturn moment per level is the sum of forces above times their height above the respective level.
1Wind force, shear, and overturn moment per level
Fx = wind force = wind pressure times tributary area per level exposed to wind VX = shear per level = sum of Fx above
Mx = overturn moment = sum of all forces above times their distance above level x.
2Overturn effect
3Windward pressure increase with height
4Wind force
Fx = (windward pressure + leeward suction) times tributary area per level (leeward wind suction is assumed constant for full height)
Fx = P A
P = wind pressure and suction in psf (Pa) A = tributary area exposed to wind
(tributary area = building width times half the story height above and below)
5Shear
Wind shear per level = sum of all wind forces above Wind shear is the integration of wind forces above
Vx = ∑n Fi
i=x
6Overturn moment
Overturn moment per level = sum of all forces above times their distance Overturn moment per level = integration of shear diagram above respective level
Mx = ∑n Fi (h i - hx )
i=x
Fi = Force at level i h i = height of level i h x = height of level x n = top level
9-4 DESIGN METHODS Lateral Force Design
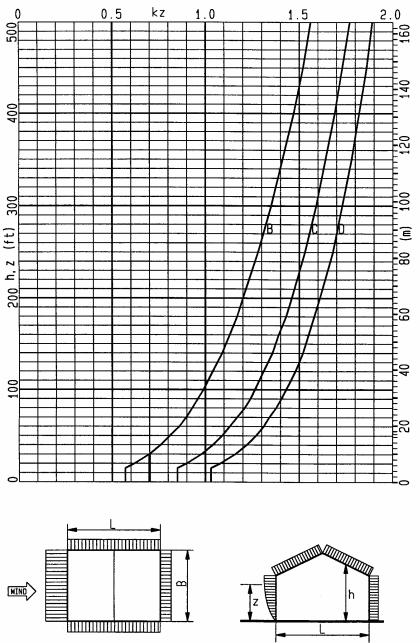
Kz graph |
Wind pressure |
|
|
|
ASCE 7 provides three methods to define wind pressure: |
||
|
Method 1 |
– Simplified Design |
(limited to mean roof height h ≤ 60 ft [18 m]) |
|
Method 2 |
– Analytical Procedure |
(briefly described below) |
|
Method 3 |
– Wind-tunnel Procedure |
|
|
The Analytical Procedure includes figures and tables for wind speed, exposure, building |
||
|
form, roof slope, enclosure, dynamic behavior and topography. |
||
|
p = qG Cp – qi(GCpi) |
(ASCE 7 6.5.12..2.1, minimum p = 10 psf [480 Pa]) |
|
q |
velocity pressure |
(defined below) |
G |
gust factor |
(ASCE 7, 6.5.8) |
G |
= 0.85 |
(for rigid structures > 1 Hz, usually < 10 stories) |
G |
= 1.5 to 2.0 |
(for fabric structures, depending on form, etc) |
Cp |
Pressure coefficient |
(ASCE 7 figures and tables) |
Cp |
= 0.8 |
(windward walls, varies with height z) |
Cp |
= - 0.7 |
(side walls - constant - based on height h) |
Cp |
= - 0.2 to - 0.5 |
(leeward walls - constant - based on height h) |
Cp |
= - 1.3 to + 0.4 |
(windward and flat roofs) |
Cp |
= - 0.3 to - 0.7 |
(leeward roof) |
GCpi Internal pressure factor |
(ASCE 7 Fig. 6-5, based on highest opening) |
|
GCpi = 0 |
(open structures) |
|
GCpi = ± 0.18 |
(enclosed buildings) |
|
q = 0.00256 I Kz Kz t Kd V2 |
(Velocity pressure in psf) |
|
q = 0.613 I Kz Kz t Kd V2 |
(SI units: velocity pressure in Pa) |
|
V = wind speed in mph [m/s] |
(IBC Fig. 1609 wind speed map or local data) |
|
I = Importance factor |
(IBC table 1604.5) |
|
I = 1 |
(all structures not listed below) |
|
I = 1.15 |
(essential facilities: hospitals, police and fire stations) |
|
I = 1.15 |
(facilities presenting hazards to human life) |
|
I = 0.87 |
(agricultural and some temporary facilities) |
|
KZt |
Topography factor |
(ASCE 7 Fig. 6.4) |
KZt = 1 |
(for regular flat sites, assumed in graphs) |
|
Kd |
Directionality factor |
(ASCE 7 Table 6-4) |
kd = 0.85 |
(for building structures) |
|
KZ |
Exposure factor |
(ASCE 7 Table 6-3) |
|
KZ graph (left): |
(Exposure B cladding minimum KZ = 0.7) |
|
B = Exposure B, inner city, protected by other buildings or trees |
|
|
C = Exposure C, open area, unprotected buildings |
|
|
D = Exposure D, near ocean or large lakes |
|
Note: |
The following graphs assume: |
|
|
Regular flat sites (KZT =1) |
|
|
Interior, leeward, and side wall pressure, constant, based on height h |
|
|
Positive values for pressure, negative values for suction |
|
9-5 DESIGN METHODS Lateral Force Design
|
|
Exposure C wind pressure for 10' to 100' height and 85 to 150 mph wind speed |
|
||||||||
|
45.0 |
|
|
|
|
|
|
|
|
|
|
(psf) |
40.0 |
|
|
|
|
|
|
|
|
|
|
35.0 |
|
|
|
|
|
|
|
|
|
|
|
30.0 |
|
|
|
|
|
|
|
|
|
|
|
pressure |
|
|
|
|
|
|
|
|
|
|
|
25.0 |
|
|
|
|
|
|
|
|
|
|
|
20.0 |
|
|
|
|
|
|
|
|
|
|
|
|
|
|
|
|
|
|
|
|
|
|
|
Windward |
15.0 |
|
|
|
|
|
|
|
|
|
|
10.0 |
|
|
|
|
|
|
|
|
|
|
|
5.0 |
|
|
|
|
|
|
|
|
|
|
|
0.0 |
|
|
|
|
|
|
|
|
|
|
|
|
10 |
20 |
30 |
40 |
50 |
60 |
70 |
80 |
90 |
100 |
|
|
|
||||||||||
|
85 |
9.1 |
9.6 |
10.5 |
11.1 |
11.7 |
12.1 |
12.5 |
12.9 |
13.3 |
13.5 |
|
90 |
10.2 |
10.8 |
11.7 |
12.5 |
13.1 |
13.5 |
14.0 |
14.5 |
14.9 |
15.1 |
|
100 |
12.6 |
13.3 |
14.5 |
15.4 |
16.1 |
16.7 |
17.3 |
17.9 |
18.3 |
18.6 |
|
110 |
15.2 |
16.1 |
17.5 |
18.6 |
19.5 |
20.2 |
20.9 |
21.7 |
22.2 |
22.6 |
|
120 |
18.1 |
19.2 |
20.9 |
22.2 |
23.2 |
24.1 |
24.9 |
25.8 |
26.4 |
26.8 |
|
130 |
21.3 |
22.5 |
24.5 |
26.0 |
27.3 |
28.3 |
29.3 |
30.3 |
31.0 |
31.5 |
|
140 |
24.7 |
26.1 |
28.4 |
30.2 |
31.6 |
32.8 |
33.9 |
35.1 |
36.0 |
36.5 |
|
150 |
28.3 |
30.0 |
32.6 |
34.6 |
36.3 |
37.6 |
39.0 |
40.3 |
41.3 |
41.9 |
Windward pressure (psf)
|
|
|
|
85 |
5.7 |
6.0 |
6.5 |
6.9 |
|
7.3 |
7.6 |
|
7.8 |
8.1 |
8.3 |
8.4 |
|
|
|
|
|
|
|
||||||||||||
|
|
|
|
90 |
6.4 |
6.7 |
7.3 |
7.8 |
|
8.2 |
8.5 |
|
8.8 |
9.1 |
9.3 |
9.4 |
|
|
|
|
|
|
|||||||||||||
|
|
100 |
7.9 |
8.3 |
9.1 |
9.6 |
|
10.1 |
10.5 |
|
10.8 |
11.2 |
11.5 |
11.7 |
|
||
|
|
|
|
||||||||||||||
110 |
9.5 |
10.1 |
11.0 |
11.6 |
|
12.2 |
12.6 |
|
13.1 |
13.5 |
13.9 |
14.1 |
|
||||
120 |
11.3 |
12.0 |
13.1 |
13.8 |
|
14.5 |
15.0 |
|
15.6 |
16.1 |
16.5 |
16.8 |
|
||||
|
|
130 |
13.3 |
14.1 |
15.3 |
16.3 |
|
17.0 |
17.7 |
|
18.3 |
18.9 |
19.4 |
19.7 |
|
||
|
|
|
|
||||||||||||||
|
|
140 |
15.4 |
16.3 |
17.8 |
18.9 |
|
19.8 |
20.5 |
|
21.2 |
21.9 |
22.5 |
22.8 |
|
||
|
|
|
|
||||||||||||||
|
|
150 |
17.7 |
18.7 |
20.4 |
21.6 |
|
22.7 |
23.5 |
|
24.3 |
25.2 |
25.8 |
26.2 |
|
||
|
|
|
|
||||||||||||||
|
|
|
|
|
|
|
|
|
Leeward pressure (psf) |
|
|
|
|
|
|||
|
|
|
|
|
|
|
|
|
|
|
|
|
|
|
|
|
|
|
|
|
|
|
|
|
|
|
|
|
|
|
|||||
|
|
85 |
2.4 |
2.5 |
2.8 |
2.9 |
|
3.1 |
3.2 |
|
3.3 |
3.4 |
3.5 |
3.6 |
|
||
|
|
|
|
||||||||||||||
|
|
|
|
90 |
2.7 |
2.9 |
3.1 |
3.3 |
|
3.5 |
3.6 |
|
3.7 |
3.8 |
3.9 |
4.0 |
|
|
|
|
|
|
|||||||||||||
|
|
100 |
3.3 |
3.5 |
3.8 |
4.1 |
|
4.3 |
4.4 |
|
4.6 |
4.7 |
4.9 |
4.9 |
|
||
|
|
|
|
||||||||||||||
110 |
4.0 |
4.3 |
4.6 |
4.9 |
|
5.2 |
5.4 |
|
5.5 |
5.7 |
5.9 |
6.0 |
|
||||
120 |
4.8 |
5.1 |
5.5 |
5.9 |
|
6.1 |
6.4 |
|
6.6 |
6.8 |
7.0 |
7.1 |
|
||||
|
|
130 |
5.6 |
6.0 |
6.5 |
6.9 |
|
7.2 |
7.5 |
|
7.7 |
8.0 |
8.2 |
8.3 |
|
||
|
|
|
|
||||||||||||||
|
|
140 |
6.5 |
6.9 |
7.5 |
8.0 |
|
8.4 |
8.7 |
|
9.0 |
9.3 |
9.5 |
9.7 |
|
||
|
|
|
|
||||||||||||||
|
|
150 |
7.5 |
7.9 |
8.6 |
9.2 |
|
9.6 |
10.0 |
|
10.3 |
10.7 |
10.9 |
11.1 |
|
||
|
|
|
|
||||||||||||||
Interior pressure (psf)
Example: Wood shear walls
Assume: 66’x120’x27’ high, 3 shear walls, L=3x30’=90’, wind speed 90 mph, exposure C, Importance factor I = 1, gust factor G = 0.85 (ASCE 7, 6.5.8 for rigid structures > 1 Hz)
For each level in width direction find: wind pressure P, force F, shear V, shear wall type
Interior pressure (from graph for h = 30’) |
|
|
|
|
p = 3.1 psf |
||||||
Leeward suction (from graph for h = 30’ |
|
|
|
|
P= 7.3 psf |
||||||
Level 3 (h = 29 – use 30’ pressure) |
|
|
|
|
|
|
|
|
|||
Wind pressure (windward + leeward + interior) |
|
|
|
|
|
|
|||||
p = 11.7+7.3 + 3.1 |
|
|
|
|
|
|
|
|
p = 22.1 psf |
||
Force F = 22.1x120x10’/2 |
|
|
|
|
|
|
F = 13,260 # |
||||
Shear V = F |
|
|
|
|
|
|
|
|
V = 13,260 # |
||
Required wall strength = 13,260 / 90’ = 147 plf; use 5/16”, 6d at 6” |
|
200 > 147 |
|||||||||
Level 2 (h = 19’ – use 20’ pressure) |
|
|
|
|
|
|
|
|
|||
p = 10.8+7.3+3.1 |
|
|
|
|
|
|
|
|
p = 21.2 psf |
||
Force F = 21.2 x 120 x 10’ |
|
|
|
|
|
|
F = 25,440 # |
||||
Shear V = 13,260 + 25,440 |
|
|
|
|
|
|
V = 38,700 # |
||||
Required wall strength = 38,700 / 90’ = 430 plf; use 15/32”, 8d at 4” |
|
430 = 430 |
|||||||||
Level 1 (h = 9’ – use 10’ pressure’) |
|
|
|
|
|
|
|
|
|||
p = 10.2+7.3+3.1 |
|
|
|
|
|
|
|
|
p = 20.6 psf |
||
Force F = 23.7x120x10’ |
|
|
|
|
|
|
F = 24,720 # |
||||
Shear V = 38,700 + 24,720 |
|
|
|
|
|
|
V = 63.420 # |
||||
Required strength = 63,420 / 90’ = 705 plf; use 15/32”, 8d at 2” |
|
730 > 705 |
|||||||||
Note: |
|
|
|
|
|
|
|
|
|
|
|
The results are very similar to 9.1 with less computation |
|
|
|
|
|
||||||
See Appendix C for exposure B and D graphs |
|
|
|
|
|
|
|||||
|
|
|
|
|
|
|
|
|
|
|
|
IBC table 2306.4.1 excerpts |
|
|
|
|
|
|
|
|
|||
Allowable shear for wood panels with Douglas-Fir-Large or Southern Pine |
|
|
|
||||||||
|
|
|
|
|
|
Nail spacing at panel edge (inches) |
|||||
Panel |
Panel |
Nail |
|
Nail size |
|
6 |
|
4 |
3 |
|
2 |
grade |
thickness |
penetration |
|
|
|
Allowable shear (lbs / foot) |
|||||
|
|
|
|
||||||||
StructuralI sheathing |
5/16 in |
1 1/4 in |
|
6d |
|
200 |
|
300 |
390 |
|
510 |
3/8 in |
1 3/8 in |
|
8d |
|
230 |
|
360 |
460 |
|
610 |
|
7/16 in |
1 3/8 in |
|
8d |
|
280 |
|
430 |
550 |
|
730 |
|
|
1 3/8 in |
|
8d |
|
255 |
|
395 |
505 |
|
670 |
|
|
15/32 in |
|
|
|
|
|
|
|
|
|
|
|
1 1/2 in |
|
10d |
|
340 |
|
510 |
665 |
|
870 |
|
|
|
|
|
|
|
||||||
* Requires 3 x framing and staggered nailing |
|
|
|
|
|
|
|||||
9-6 DESIGN METHODS Lateral Force Design
Exposure D wind pressure for 10' to 100' height and 85 to 150 mph wind speed
50.0 |
|
|
|
|
|
|
|
|
|
|
45.0 |
|
|
|
|
|
|
|
|
|
|
40.0 |
|
|
|
|
|
|
|
|
|
|
35.0 |
|
|
|
|
|
|
|
|
|
|
30.0 |
|
|
|
|
|
|
|
|
|
|
25.0 |
|
|
|
|
|
|
|
|
|
|
20.0 |
|
|
|
|
|
|
|
|
|
|
15.0 |
|
|
|
|
|
|
|
|
|
|
10.0 |
|
|
|
|
|
|
|
|
|
|
5.0 |
|
|
|
|
|
|
|
|
|
|
0.0 |
10 |
20 |
30 |
40 |
50 |
60 |
70 |
80 |
90 |
100 |
|
||||||||||
85 |
11.0 |
11.5 |
12.4 |
13.0 |
13.6 |
14.0 |
14.3 |
14.8 |
15.0 |
15.3 |
90 |
12.3 |
12.9 |
13.9 |
14.6 |
15.2 |
15.7 |
16.1 |
16.5 |
16.8 |
17.1 |
100 |
15.2 |
16.0 |
17.2 |
18.1 |
18.8 |
19.4 |
19.8 |
20.4 |
20.7 |
21.2 |
110 |
18.4 |
19.3 |
20.8 |
21.8 |
22.7 |
23.5 |
24.0 |
24.7 |
25.1 |
25.6 |
120 |
21.9 |
23.0 |
24.7 |
26.0 |
27.1 |
27.9 |
28.6 |
29.4 |
29.8 |
30.5 |
130 |
25.8 |
27.0 |
29.0 |
30.5 |
31.8 |
32.8 |
33.5 |
34.5 |
35.0 |
35.8 |
140 |
29.9 |
31.3 |
33.6 |
35.4 |
36.8 |
38.0 |
38.9 |
40.0 |
40.6 |
41.5 |
150 |
34.3 |
36.0 |
38.6 |
40.6 |
42.3 |
43.6 |
44.6 |
45.9 |
46.6 |
47.6 |
|
|
|
|
|
Winward pressure (psf) |
|
|
|
|
|
85 |
6.9 |
7.2 |
7.8 |
8.2 |
8.5 |
8.8 |
9.0 |
9.2 |
9.4 |
9.6 |
90 |
7.7 |
8.1 |
8.7 |
9.1 |
9.5 |
9.8 |
10.0 |
10.3 |
10.5 |
10.7 |
100 |
9.5 |
10.0 |
10.7 |
11.3 |
11.7 |
12.1 |
12.4 |
12.8 |
12.9 |
13.2 |
110 |
11.5 |
12.1 |
13.0 |
13.7 |
14.2 |
14.7 |
15.0 |
15.4 |
15.7 |
16.0 |
120 |
13.7 |
14.4 |
15.4 |
16.2 |
16.9 |
17.4 |
17.8 |
18.4 |
18.6 |
19.0 |
130 |
16.1 |
16.9 |
18.1 |
19.1 |
19.8 |
20.5 |
20.9 |
21.6 |
21.9 |
22.3 |
140 |
18.7 |
19.6 |
21.0 |
22.1 |
23.0 |
23.7 |
24.3 |
25.0 |
25.4 |
25.9 |
150 |
21.4 |
22.5 |
24.1 |
25.4 |
26.4 |
27.3 |
27.9 |
28.7 |
29.1 |
29.8 |
Leeward pressure (psf)
|
|
|
|
85 |
2.9 |
3.1 |
3.3 |
3.5 |
3.6 |
3.7 |
3.8 |
3.9 |
4.0 |
4.0 |
|
|
|
||||||||||||
|
|
|
|
90 |
3.3 |
3.4 |
3.7 |
3.9 |
4.0 |
4.2 |
4.3 |
4.4 |
4.4 |
4.5 |
|
|
|||||||||||||
|
|
100 |
4.0 |
4.2 |
4.5 |
4.8 |
5.0 |
5.1 |
5.2 |
5.4 |
5.5 |
5.6 |
||
|
||||||||||||||
110 |
4.9 |
5.1 |
5.5 |
5.8 |
6.0 |
6.2 |
6.4 |
6.5 |
6.6 |
6.8 |
||||
120 |
5.8 |
6.1 |
6.5 |
6.9 |
7.2 |
7.4 |
7.6 |
7.8 |
7.9 |
8.1 |
||||
|
|
130 |
6.8 |
7.1 |
7.7 |
8.1 |
8.4 |
8.7 |
8.9 |
9.1 |
9.3 |
9.5 |
||
|
||||||||||||||
|
|
140 |
7.9 |
8.3 |
8.9 |
9.4 |
9.7 |
10.1 |
10.3 |
10.6 |
10.7 |
11.0 |
||
|
||||||||||||||
|
|
150 |
9.1 |
9.5 |
10.2 |
10.8 |
11.2 |
11.5 |
11.8 |
12.2 |
12.3 |
12.6 |
||
|
||||||||||||||
Interior pressure (psf)
Example: CMU shear walls
Assume: Regular flat site
Office building: 6-story, 90’x90’x60’, 30’x30’ core 30’ CMU walls, 8” nominal (7.625”)
Shear wall length L = 2 x (30’– 6’ doors) = 48’ Shear walls resist all lateral load
Roof fabric canopy, 50’x50’x10’, gust factor G = 1.8 Wind speed V = 100 mph
Exposure D Importance factor I = 1
Interior pressure (assume conservative opening height h = 60’) |
p = 5.1 psf |
Leeward pressure (for h = 60’) |
|
P = 12.1 psf + 5.1 psf |
p = 17.2 psf |
Average windward pressure (h = 10 to 60’) |
|
P = (15.2+16.0+17.2+18.1+18.8+19.4) / 6 |
p = 17.5 psf |
Average combined wind pressure |
|
P = 17.5+17.2+5.1 |
P = 39.8 psf |
Roof canopy pressure P canopy = (12.1)(1.8) |
P canopy = 21.8 psf |
Base shear |
|
V = A P = 90’ x (60’-5’) x 39.8 + (50’x10’/2)x21.8 |
V = 202,460 # |
Core shear stress |
|
v =V/A = 202,460 / (48’x12”x7.625”) |
v = 46 psi |
Note:
Wind on lower half of first floor, resisted by footing, has no effect on shear walls
9-7 DESIGN METHODS Lateral Force Design
Seismic Design
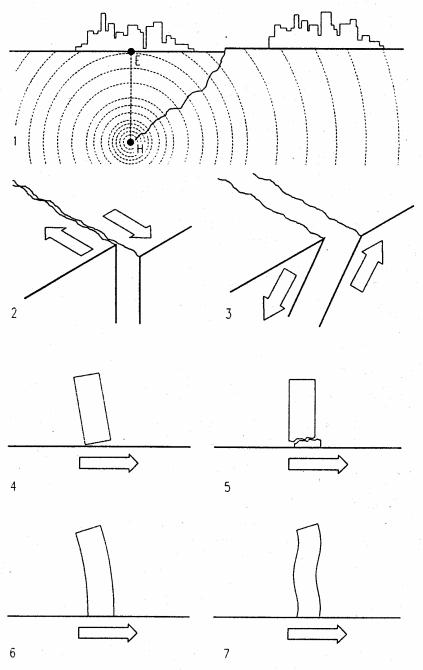
Earthquakes are caused primarily by release of shear stress in seismic faults, such as the San Andreas fault, that separates the Pacific plate from the North American plate, two of the plates that make up the earth’s crust according to the plate tectonics theory. Plates move with respect to each other at rates of about 2-5 cm per year, building up stress in the process. When stress exceeds the soil’s shear capacity, the plates slip and cause earthquakes. The point of slippage is called the hypocenter or focus, the point on the surface above is called the epicenter. Ground waves propagate in radial pattern from the focus. The radial waves cause shaking somewhat more vertical above the focus and more horizontal far away; yet irregular rock formations may deflect the ground waves in random patterns. The Northridge earthquake of January 17, 1994 caused unusually strong vertical acceleration because it occurred under the city.
Occasionally earthquakes may occur within plates rather than at the edges. This was the case with a series of strong earthquakes in New Madrid, along the Mississippi River in Missouri in 1811-1812. Earthquakes are also caused by volcanic eruptions, underground explosions, or similar man-made events
Buildings are shaken by ground waves, but their inertia tends to resists the movement which causes lateral forces. The building mass (dead weight) and acceleration effects these forces. In response, structure height and stiffness, as well as soil type effect the response of buildings to the acceleration. For example, seismic forces for concrete shear walls (which are very stiff) are considered twice that of more flexible moment frames. As an analogy, the resilience of grass blades will prevent them from breaking in an earthquake; but when frozen in winter they would break because of increased stiffness.
The cyclical nature of earthquakes causes dynamic forces that are best determined by dynamic analysis. However, given the complexity of dynamic analysis, many buildings of regular shape and height limits, as defined by codes, may be analyzed by a static force method, adapted from Newton’s law F= ma (Force = mass x acceleration).
1Seismic wave propagation and fault rupture
2Lateral slip fault
3Thrust fault
4Building overturn
5Building shear
6Bending of building (first mode)
7Bending of building (higher mode)
E Epicenter
H Hypocenter
9-8 DESIGN METHODS Lateral Force Design
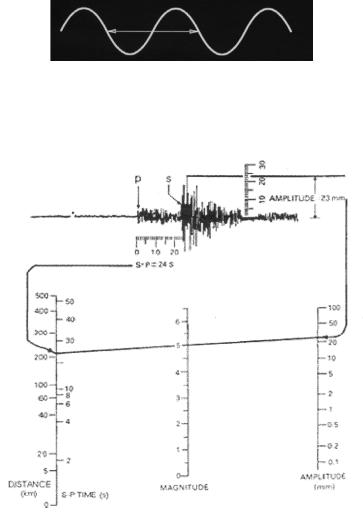
 Amplitude
Period
Richter scale method, courtesy US Geological Survey
Seismic terms
The following seismic terms are important to understanding seismic design:
Period is the time interval of one cycle a wave or a building sways back and forth. A building period resonant with the earthquake period can cause collapse.
Amplitude is the displacement of a wave perpendicular to the direction it moves
Richter scale
The Richter scale was developed in 1935 by Charles Richter of the California Institute of Technology to compare the magnitude of earthquakes. The Richter scale is determined from the logarithm of the amplitude of waves recorded by seismographs; adjusted for the distance to the earthquake epicenter. The Richter Scale gives magnitude in whole numbers and decimal fractions. For example, magnitude 5 is a moderate earthquake, but magnitude 7 is a strong one. Because of the logarithmic scale, each whole number increase represents a tenfold increase in amplitude and force and 31 times more energy.
Velocity is the shaking speed of an earthquake (meter/ second)
Acceleration is velocity increase (or decrease), like car acceleration (meter / second2)Spectral acceleration is what is experienced by a building, modeled by a
particle on a
mass-less vertical rod of the same period as the building
PGA (peak ground acceleration) is experienced by a particle on the ground (without damping)
Body waves
Body waves are seismic waves that move through the interior of the earth, as opposed to surface waves that travel near the earth's surface. P and S waves are body waves. Each type of wave shakes the ground in different ways.
P waves are high-speed seismic body waves, traveling at about 26000 mph (42000 km), that shake the ground in the same and opposite direction as the waves move.
S waves (shear waves) are seismic body waves that shake back and forth perpendicular to the direction the wave is moving.
Surface waves
Surface waves are seismic waves that are trapped near the surface of the earth
Rayleigh waves are seismic surface waves causing the ground to shake in an elliptical motion, with no transverse, or perpendicular, motion.
Love waves are surface waves with a horizontal motion transverse (perpendicular) to the direction the wave is traveling.
9-12 DESIGN METHODS Lateral Force Design
SD Graphs (Seismic Design Graphs)
by G G Schierle
adapted from IBC Equivalent Lateral Force Analysis Load Resistance Factor Design (LRFD)
to
Allowable Stress Design (ASD) assuming ASD = LRFD / 1.4
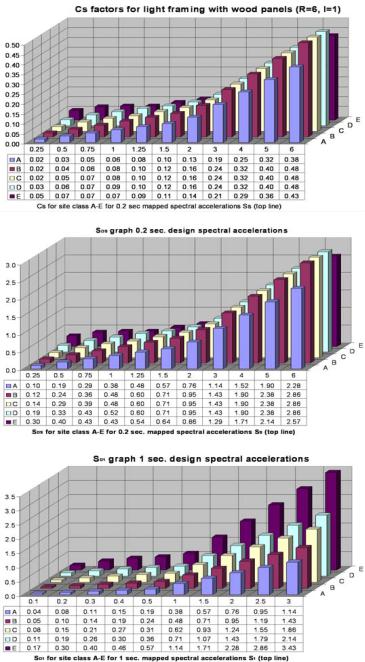
CS Graph for light framing with wood panels (R=6, I=) Used to compute base shear V
V = I CS W
I = Importance factor (see IBC table 1604.5) CS = Seismic coefficient
W = Building mass (dead load + some live loads)
SDS Graph: 0.2 seconds Design Spectral Acceleration Used for low-rise structures
CS = I SDS / R
R = Reduction factor for structure systems (see IBC table 1617.6.2)
SD1 Graph for 1 second Design Spectral Acceleration Used for high-rise structures (T > TS ) (TS = SDS/SD1)
CS = I SD1 / (TR)
T = building period (approximately 0.1 seconds per story height)
9-13 DESIGN METHODS Lateral Force Design
Spectral acceleration
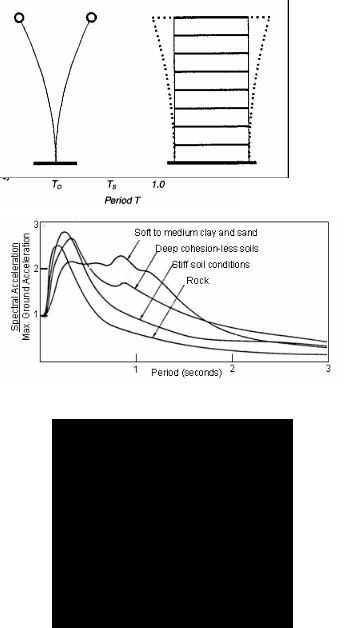
Acceleration spectra for four soil types (by Seed)
IBC Design Response Spectrum
Basic concepts
Earthquake ground shaking generates forces on structures. Though these forces act in all direction, the horizontal (lateral) forces are usually most critical. Seismic forces are
f = m a (Force = mass x acceleration ) where
Mass = building dead weight Acceleration
Note:
PGA (Peak ground Acceleration) is experienced by a particle on the ground Spectral Acceleration approximates the acceleration of a building, as modeled by a particle on a mass-less vertical rod of the same period of vibration as the building.
Acceleration Spectra (left)
Based on the 1971 San Fernando and other Earthquakes Seed (1976) developed Acceleration Spectra to correlate time period (X-axis) with acceleration for four soil types. Other studies by Hall, Hayashi, Kuribayashi, and Mohraz demonstrated similar results. Equivalent Lateral Force Analysis is based on Acceleration Spectra, abstracted as
Design Response Spectrum
Design Response Spectrum (left)
The IBC Design Response Spectrum correlate time period T and Spectral Acceleration, defining three zones. Two critical zones are:
T < TS
T > TS where
T = time period of structure (T ~ 0.1 sec. per story - or per ASCE 7 table 1615.1.1) TS = SDS/SD1 (See the following graphs for SDS and SD1)
9-14 DESIGN METHODS Lateral Force Design