

Environmental Biotechnology - Jordening and Winter
.pdf294 11 Bioreactors
Fig. 11.6 Decontamination time course in (a) batch processing of soil (4 L),
(b) batch processing of sediment (650 L).
a
b
of 3500 mg kg–1. Within 30 d the concentration dropped to about 500 mg kg–1, but during the following period (up to day 56) no significant degradation was measured.
Figure 11.6b shows a batch degradation curve for a heavily polluted harbor sediment, as measured on the pilot scale (650 L) in an air-agitated slurry reactor (the dual injected turbulent separation (DITS) reactor). The DITS reactor was originally the first reactor unit in the Slurry Decontamination Process (Fig. 11.7). But for this experiment the DITS reactor was disconnected and used as a standalone batch reactor. The batch process showed a decrease from 10 000 mg kg–1 of mineral oil contaminant to 6000–7000 mg kg–1.
Other batch processes have been carried out (see also Section 11.3.3). Generalizing the results of these batch experiments enables a ‘typical’ batch curve to be constructed (Fig. 11.8): extensive breakdown in the first few days is followed by slower degradation during the second stage. In this stage only a small percentage of the contaminant is degraded over a relatively long time period.
The exact shape of the curve and the conversion level at which breakdown stops vary with the composition and age of the solids and the type of contaminant.
To understand the typical batch curve, three major phenomena have to be considered:
11.3 Slurry Bioreactors 295
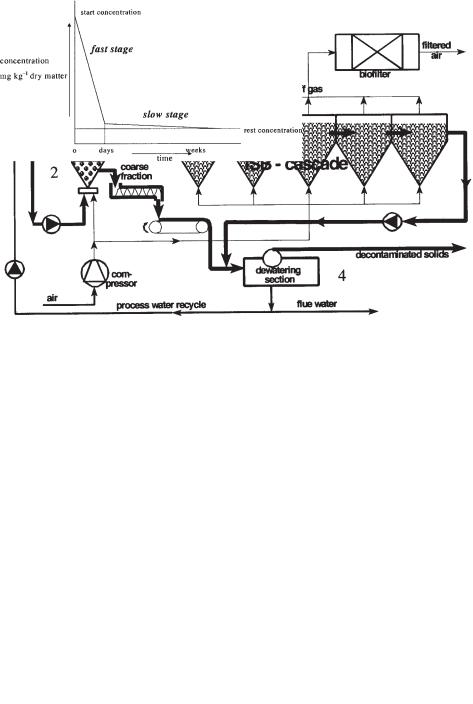
Fig. 11.7 Slurry decontamination process (SDP), including dual injected turbulent separation reactor (DITS) and a cascade of interconnected suspension bioreactors (ISB cascade).
•In batch processing the biomass, growing on a complex substrate, has to adapt continuously to different components, since the ‘easy’ parts are degraded first (Teschner and Wehner, 1985). This pattern inevitably leads to increasing difficulties for the resident microbial population. The adaptation rate of the population to the available contaminants is insufficient.
•The contaminant desorption kinetics are of such an order that at lower concentrations there is a limited ‘driving force’ for the adsorbed contaminants to be released
Fig. 11.8 Generalized curve for decontamination during batch operation.
296 11 Bioreactors
from the solids (Di Toro and Horzempa, 1982). Since microbial breakdown proceeds only if the contaminant is dissolved in the water phase, this type of kinetics does not allow for easy breakdown at low concentrations of contaminant.
•During batch processing. inhibitory side products of the microbial breakdown may be increasingly released into the medium; in addition, the physical condition of the solids may change (e.g., attrition), which may lead to unfavorable conditions for the microorganisms. An example would be the drop in pH due to humification processes, which can accompany contaminant breakdown.
11.3.3
Full Scale Batch Processes
11.3.3.1 The DMT–Biodyn Process
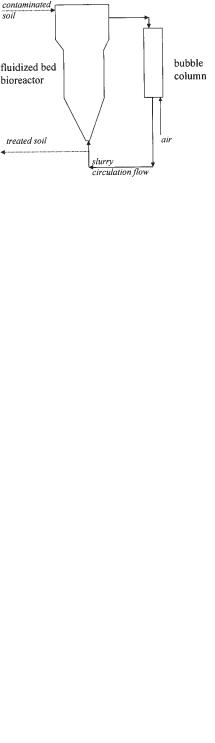
A full scale batch process has been implemented as the DMT–Biodyn process (Sinder et al., 1999). The process consists of a fluidized-bed slurry reactor in which finedgrained contaminated soils are treated. For aeration, the slurry circulation loop is treated in an external bubble column (Fig. 11.9). The reactor configuration allows a high solids loading, up to 50 wt%. The DMT–Biodyn process was designed by the Deutsche Montan Technologie GmbH to treat PAH-polluted sites at former coal facilities in the Federal Republic of Germany (Nitschke, 1994).
On a pilot scale (a 1.2 m3 reactor) various technological parameters were investigated and the hydraulic feed system at the bottom was optimized. Experiments showed that PAH degraded rapidly without a noticeable lag phase; the measured oxygen consumption rate correlated with the PAH degradation rate. For this specific soil (starting concentration of PAH about 250 mg kg–1), the target levels were reached after 6 d. Comparison of the pilot results with results on a laboratory scale using a respirometer showed that the degradation of this test soil in each of these systems was similar. With a higher level of PAH contamination (starting at 1100 mg kg–1), the target levels could not be reached (treatment time, 30 d). The researchers concluded that, for this specific soil, “adsorption of the PAH to the organic matrix results in a reduced bioavailability”. Later experiments on this contaminated soil, in
Fig. 11.9 DMT–Biodyn process configuration.

11.3 Slurry Bioreactors 297
which bioprocessing and soil washing was combined, resulted in final contaminant levels below target values.
In Sweden a full scale (55 m3) DMT–Biodyn processor was installed to treat a contaminated gas plant area. The first trials on this scale have been successfully completed (Sinder et al., 1999).
11.3.3.2The FORTEC Process
In the Netherlands the FORTEC process (fast organic removal technology) for treating contaminated sediments combines several separation technologies with bioreactor treatment (ten Brummelen et al., 1997). The first step in the process is the use of hydrocyclones to remove the sand fractions. The efficiency of the separation step is optimized by a multistage hydrocyclone configuration, and separation down to a particle size of 20 µm is achieved. After the sand separation, the contaminated fine fraction is fed to the bioreactor section. Based on initial experiments with aerated stirred-tank bioreactors, a full scale bioreactor section with a total volume of 300 m3 (several reactors) was constructed (RIZA, 1997).
A heavily contaminated harbor sediment (port of Amsterdam) was treated with the FORTEC process. After sand removal, the fine fraction (<20 µm) was treated batchwise in full scale bioreactors. On this scale 85% of the PAH and 78% of the mineral oil were removed after 15 d of batch processing (ten Brummelen et al., 1997).
11.3.3.3The OMH Process
In the United States a large scale slurry bioreactor (750 m3) was used to treat creo- sote-contaminated lagoon solids stabilized with fly ash (total PAH was 11 g kg–1). An extensive pretreatment to classify the material was combined with an aerated and stirred (900 rpm) bioreactor (20% solids load). Remediation with respect to the PAH contaminants was determined to be 82%–99% conversion for the 3- and 4-ring PAHs and 34%–78% for PAHs having more rings (Jerger et al., 1993).
11.3.3.4 The Huber Process
On a scale of 30 m3, a batch process for treating the fine fraction (<200 µm) of a diesel oil-contaminated soil was carried out in an air-lift bioreactor. The oil concentration dropped from 12 000 to 2000 mg kg–1 after 2 weeks of residence time (BlankHuber et al., 1992). Stripping effects of the diesel oil contaminant were determined at about 20% by laboratory experiments.
11.3.4
Sequential Batch Operation (Semicontinuous)
To overcome some of the limitations of batch processing, continuous operation in a plug-flow system is considered. As the contaminated solids travel through the
298 11 Bioreactors
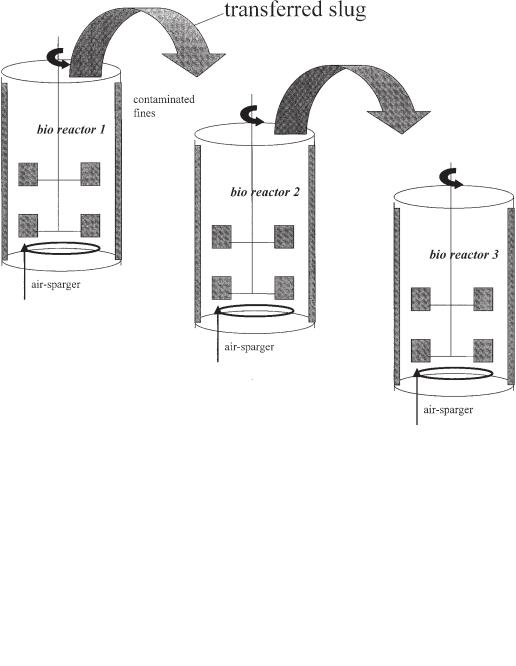
system, specific conditions in the successive reactors develop. A practical way of achieving a plug flow system is to use a sequence of batch reactors (Fig. 11.10). In an experimental cascade of three stirred-batch slurry reactors, the contaminated solids (oil contamination) are periodically transferred to the next step (only part of the reactor slurry content is transferred, the so-called ‘slug’) (Apitz et al., 1994).
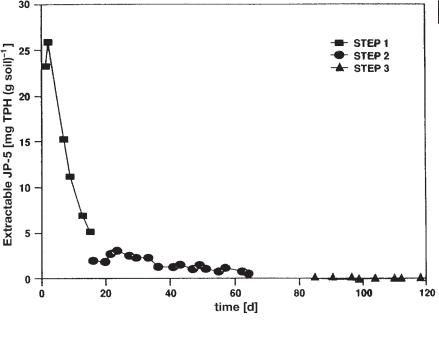
Figure 11.11 shows the breakdown pattern in the transferred slug during its residence in each individual reactor. The authors explained “that each successive stage of the cascade maintains a microbial consortium that is optimized to consume organic compounds of increasing complexity. When compared to the batch process the biocascade was shown to be more effective, both in terms of the rate and degree of degradation” (Apitz et al., 1994).
Fig. 11.10 Cascade of three batch reactors in sequence.
11.3 Slurry Bioreactors 299
Fig. 11.11 Level of contamination in one slug of material traveling through the sequenced batch process (three-step biocascade). Successive steps reflect the degradation of more recalcitrant components (Apistz et al., 1994; with permission).
11.3.5
Continuous Operation
In the Netherlands a continuous plug-flow system has been achieved with the Slurry Decontamination Process (SDP) (Fig. 11.7). This process contains four major unit operations (Kleijntjens, 1991).
1.The contaminated solids are mixed with (process) water to form a slurry and are sized by passage over a vibrating screen. In this wet sieving step, debris is removed and a slurry having the proper density (about 30 w/w%) is prepared.
2.In the first reactor/separator (a tapered air-lifted bioreactor: the DITS reactor), the sand fractions are removed by means of a fluidized bed. Extensive organic material is removed by fine screening of the light material. In addition, agglomerates of contaminated fines are demolished owing to the power input and are thereby opened to biological breakdown (inoculation with the active biomass also takes place here).
3.In a second reactor stage, the contaminated fine fraction is treated. The second stage consists of a cascade of interconnected bioreactors (ISB cascade).
4.A dewatering stage completes the process; the water released is partly recirculated as process water to mix fresh solids into a slurry.
300 11 Bioreactors
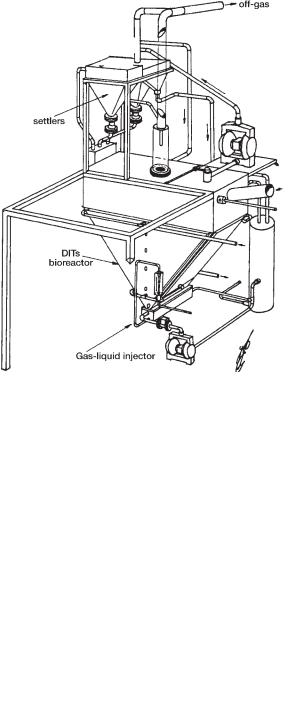
Figure 11.12 shows the configuration of the DITS bioreactor (Luyben and Kleijntjens, 1988). In the tapered bioreactor system, energy is introduced at the bottom by the simultaneous injection of compressed air and slurry that was recycled from the reactor content itself. Shown are the dual injectors, the settlers (used in the recycle flow), and the tapered vessel. This system has been built on scales of 400 L, 800 L, and 4 m3. It has been operated for 2.5 years to test various solid waste streams. The integral process was operated semicontinuously on a pilot scale (3 m3 working reactor volume).
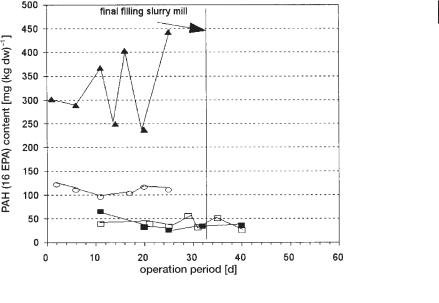
Figure 11.13 shows the experimental results for a heavily polluted harbor sediment during a steady-state period of six weeks. Nutrients (nitrogen, phosphorous, and potassium) were added and the temperature was kept at 30 °C. The steady-state PAH concentration in the solids is shown as a function of time. The upper symbols show the feed concentrations in the slurry mill, which have an average of about 350 mg kg–1 (the input data are scattered because of the heterogeneous feedstock). In the DITS reactor the steady-state concentration dropped to around 100 mg kg–1 (first part of the microbial breakdown).
In the ISB cascade the average concentration dropped to 30–40 mg kg–1. After dewatering, the final concentration increased somewhat in the filter cake. The overall
Fig. 11.12 Technical schema of the DITS bioreactor.
11.3 Slurry Bioreactors 301
PAH breakdown pattern during steady-state treatment of sediment by the SDP process: E slurry mill, F DITS reactor, ISB reactor, press cake.
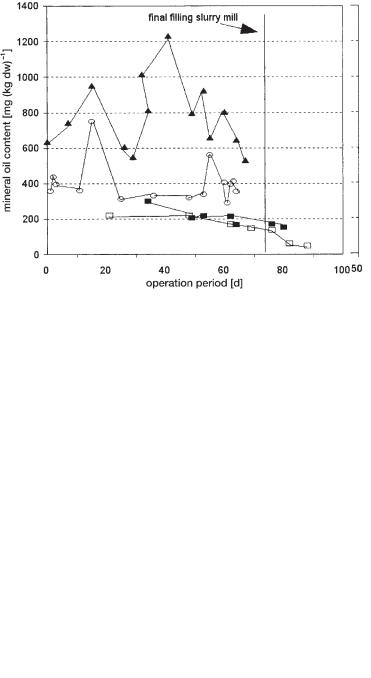
PAH degradation level was about 92% for an overall residence time of 16 d. No significant evaporation was measured in the off-gas. In this sediment, the degradation of mineral oil showed a similar pattern (Fig. 11.14); however, an overall degradation level of only 65% was achieved. Final concentrations after dewatering were around 3000 mg kg–1. In this sediment, mineral oil seems to be less available for microbial breakdown than the PAH. Recycling standards for PAH could be achieved, but levels of oil contamination remained too high.
A contaminated soil treated by the slurry process showed a steady-state breakdown pattern (Fig. 11.15). Starting at moderate contamination levels of 1200–1300 mg kg–1 mineral oil, final concentrations of <50 mg kg–1 were achieved, which is well below the recycling standards.
Comparing the steady-state continuous results (Fig. 11.14) with the batch results (Fig. 11.6b) for the same sediment and contaminant, we can clearly see that the continuous mode results in much better conversion (final concentration in continuous mode is ±3000 mg kg–1 vs. 7000 mg kg–1 in batch mode). This improvement due to continuity is in accordance with observations on cascade breakdown (Apitz et al., 1994). However, despite the improvement shown in Figure 11.14, the Dutch recycling standard (mineral oil = 500 mg kg–1) for this specific sediment was not met.
For a less contaminated solid waste (Fig. 11.15), the recycling standard was met without difficulty: a mineral oil starting concentration of 900 mg kg–1 was decreased to an output concentration <50 mg kg–1. If this oil conversion is compared with the results in Figure 11.14 (8000 mg kg–1 of mineral oil input was decreased to 3000 mg kg–1 output), we can see that, at higher concentrations, limited bioavailability seriously hinders microbial breakdown. As a consequence, it is often difficult to
302 11 Bioreactors
Mineral oil breakdown pattern during steady-state treatment of sediment by the SDP process: E slurry mill, F DITS reactor, ISB reactor, press cake.
Mineral oil breakdown pattern during steady-state treatment of soil by the SDP process: E slurry mill, F DITS reactor, cascade, press cake.

11.4 Solid-State Bioreactors 303
achieve complete conversion and achieve low end concentrations when starting with high input concentrations.
We should note that analytical difficulties (especially for oil) in the handling of wet samples can easily lead to incorrect data. For example, in addition to a standard deviation of 20% within one laboratory, sample-exchange assays between various laboratories led to results that had a variation of more than 75% (Warbout and Ouboter, 1988). Bearing in mind these variations, analytical results should be regarded with care. This holds even more when samples of processed solids are compared to recycling standards.
11.4
Solid-State Bioreactors
11.4.1
Process Configuration
Systems operating under conditions of restricted moisture can be referred to as sol- id-state fermentations. A solid-state fermentation includes the growth of microorganisms, both fungi and bacteria, on a moist solid. In contrast to the slurry systems, solid-state systems operate with:
•limited pretreatment
•restricted energy input (no intense multiphase mixing)
•a limited amount of unit operations (the solids remain as a ‘solid phase’)
In a solid-state fermenter, process conditions are maintained by controlling the temperature, humidity, and aeration. In contrast to slurry systems, a compact, moist, solid phase dominates the reactor physics. Because handling the moist mass is tedious, solid-state fermentation typically takes place as a batch operation. Continuous operation depends on the possibility of practical and smooth loading and unloading procedures.
11.4.2
Batch Operation: Composting
In line with its traditional role as a soil fertilizer, compost has been used as an additive in soil remediation. Composting mostly takes place in fixed-bed reactors (Fig. 11.3a). Basically, the compost is added to stimulate microbial breakdown. In experiments, soil contaminated with hydrocarbons has been mixed with compost in various ratios (soil–compost ratios of 2 :1, 3 : 1, and 4 :1). In 3-L test batch reactors, the hydrocarbon degradation was >90% after a period of 44 d. Compared with the results in the absence of added compost, soil–compost systems had a much faster degradation rate and a lower end concentration (Lotter et al., 1990). In addition to composting, experiments focusing on the use of white-rot fungi have also been carried out (Schaeffer et al., 1995).