


|
|
show and debug Commands 159 |
|
|
|
Table 4-3 |
Cisco IOS File Manipulations |
|
|
|
|
|
IOS Command |
Meaning |
|
|
|
|
copy running-config startup-config |
Copies the configuration file from RAM to NVRAM. |
|
|
|
|
write memory |
Copies the running configuration to NVRAM. (Superseded by |
|
|
the new command, copy running-config startup-config.) |
|
|
|
|
copy startup-config running-config |
Copies the configuration file from NVRAM to RAM. |
|
|
|
|
write terminal |
Displays the current configuration file in RAM. (Superseded |
|
|
by the new command, show running-config.) |
|
|
|
|
show config |
Displays the current configuration file in NVRAM. |
|
|
(Superseded by the new command, show startup-config.) |
|
|
|
|
copy running-config tftp |
Copies the configuration file stored in RAM to a TFTP server. |
|
|
Can also be copied to an FTP or RCP server. |
|
|
|
|
copy tftp running-config |
Copies a configuration file from a TFTP server to the running |
|
|
configuration. |
|
|
|
show and debug Commands
Cisco IOS CLI has an enormous amount of show and debug commands available to the privileged EXEC user. This section covers the show and debug commands most often used to manage Cisco IOS devices.
Router CLI
Cisco IOS routers allow network administrators access to a wide range of show and debug commands. The show command displays various information about the router’s state of play, such as the Ethernet collisions on a particular interface or a router’s configuration file. Only a subset of show commands is available when in User EXEC mode. The full range is available when in privilege EXEC mode (PRIV EXEC mode).
The debug command is a more advanced IOS command that allows the administrator to view the router’s analyses of packets or buffering mechanisms and is used only to troubleshoot a device or complete network. The debug command is very CPU-intensive.
show Commands
The best method to appreciate the use of show commands is to display sample output from a Cisco IOS router.

160 Chapter 4: Cisco IOS Specifics and Security
Example 4-6 displays a list of truncated show commands available from the CLI on a Cisco router in PRIV EXEC mode.
Example 4-6 show Commands
R1#show ? |
|
access-expression |
List access expression |
access-lists |
List access lists |
accounting |
Accounting data for active sessions |
adjacency |
Adjacent nodes |
aliases |
Display alias commands |
arp |
ARP table |
async |
Information on terminal lines used as router |
|
interfaces |
backup |
Backup status |
bgp |
BGP information |
bridge |
Bridge Forwarding/Filtering Database [verbose] |
buffers |
Buffer pool statistics |
caller |
Display information about dialup connections |
cef |
Cisco Express Forwarding |
class-map |
Show QoS Class Map |
clock |
Display the system clock |
configuration |
Contents of Non-Volatile memory |
connection |
Show Connection |
context |
Show context information |
controllers |
Interface controller status |
cops |
COPS information |
crypto |
Encryption module |
debugging |
State of each debugging option |
derived-config |
Derived operating configuration |
dhcp |
Dynamic Host Configuration Protocol status |
diag |
Show diagnostic information for port |
|
adapters/modules |
dial-peer |
Dial Plan Mapping Table for, e.g. VoIP Peers |
dialer |
Dialer parameters and statistics |
dialplan |
Voice telephony dial plan |
diffserv |
Differentiated services |
dlsw |
Data Link Switching information |
dnsix |
Shows Dnsix/DMDP information |
docsis |
Show DOCSIS |
drip |
DRiP DB |
dspu |
Display DSPU information |
dxi |
atm-dxi information |
entry |
Queued terminal entries |
environment |
Environmental monitor statistics |
exception |
exception informations |
file |
Show filesystem information |
flash: |
display information about flash: file system |
frame-relay |
Frame-Relay information |
fras |
FRAS Information |
fras-host |
FRAS Host Information |
gateway |
Show status of gateway |
history |
Display the session command history |

|
|
show and debug Commands 161 |
|
|
|
|
|
Example 4-6 show Commands (Continued) |
|
|
|
|
hosts |
IP domain-name, lookup style, nameservers, and host |
|
|
|
||
|
|
table |
|
|
html |
HTML helper commands |
|
|
idb |
List of Hardware Interface Descriptor Blocks |
|
|
interfaces |
Interface status and configuration |
|
|
|
|
|
|
ip |
IP information (show ip route follows) |
|
|
ipv6 |
IPv6 information |
|
|
key |
Key information |
|
|
line |
TTY line information |
|
|
llc2 |
IBM LLC2 circuit information |
|
|
lnm |
IBM LAN manager |
|
|
local-ack |
Local Acknowledgement virtual circuits |
|
|
location |
Display the system location |
|
|
logging |
Show the contents of logging buffers |
|
|
memory |
Memory statistics |
|
|
mgcp |
Display Media Gateway Control Protocol information |
|
|
microcode |
show configured microcode for downloadable hardware |
|
|
modemcap |
Show Modem Capabilities database |
|
|
mpoa |
MPOA show commands |
|
|
ncia |
Native Client Interface Architecture |
|
|
netbios-cache |
NetBIOS name cache contents |
|
|
ntp |
Network time protocol |
|
|
num-exp |
Number Expansion (Speed Dial) information |
|
|
parser |
Display parser information |
|
|
pas |
Port Adaptor Information |
|
|
pci |
PCI Information |
|
|
policy-map |
Show QoS Policy Map |
|
|
ppp |
PPP parameters and statistics |
|
|
printers |
Show LPD printer information |
|
|
privilege |
Show current privilege level |
|
|
processes |
Active process statistics |
|
|
protocols |
Active network routing protocols |
|
|
registry |
Function registry information |
|
|
reload |
Scheduled reload information |
|
|
rmon |
rmon statistics |
|
|
route-map |
route-map information |
|
|
running-config |
Current operating configuration |
|
|
sessions |
Information about Telnet connections |
|
|
sgbp |
SGBP group information |
|
|
snmp |
snmp statistics |
|
|
spanning-tree |
Spanning tree topology |
|
|
srcp |
Display SRCP Protocol information |
|
|
ssh |
Status of SSH server connections |
|
|
ssl |
Show SSL command |
|
|
stacks |
Process stack utilization |
|
|
standby |
Hot standby protocol information |
|
|
startup-config |
Contents of startup configuration |
|
|
tcp |
Status of TCP connections |
|
|
tech-support |
Show system information for Tech-Support |
|
|
terminal |
Display terminal configuration parameters |
|
|
traffic-shape |
traffic rate shaping configuration |
|
|
|
|
|
continues

162 Chapter 4: Cisco IOS Specifics and Security
Example 4-6 show Commands (Continued)
users |
Display |
information |
about terminal lines |
|
version |
System hardware |
and software status |
||
vlans |
Virtual LANs Information |
|||
vtemplate |
Virtual Template interface information |
|||
whoami |
Info on current |
tty line |
||
|
|
|
|
|
This section briefly covers the highlighted commands in Example 4-6.
Example 4-7 displays sample output from the most widely used IOS command, show ip route.
Example 4-7 show ip route Command
R1#show ip route
Codes: C - connected, S - static, I - IGRP, R - RIP, M - mobile, B - BGP D - EIGRP, EX - EIGRP external, O - OSPF, IA - OSPF inter area
N1 - OSPF NSSA external type 1, N2 - OSPF NSSA external type 2 E1 - OSPF external type 1, E2 - OSPF external type 2, E - EGP
i - IS-IS, L1 - IS-IS level-1, L2 - IS-IS level-2, ia - IS-IS inter area * - candidate default, U - per-user static route, o - ODR
P - periodic downloaded static route Gateway of last resort is not set
131.108.0.0/16 is variably subnetted, 3 subnets, 2 masks
C131.108.255.0/30 is directly connected, Serial0/0
O 131.108.2.0/24 [110/400] via 131.108.255.2, 00:00:03, Serial0/0 C 131.108.1.0/24 is directly connected, Ethernet0/0
R1#show ip route ?
Hostname or A.B.C.D bgp
connected egp eigrp igrp
isis list mobile odr ospf profile rip static summary
supernets-only vrf
|
<cr>
R1#show ip route ospf
131.108.0.0/16 is variably subnetted, 3 subnets, 2 masks 131.108.2.0/24 [110/400] via 131.108.255.2, 00:00:30, Serial0/0

show and debug Commands 163
Example 4-7 displays three IP routing entries. The more specific command, show ip route ospf, only displays remote OSPF entries. Every IOS command can be used with the ? character to display more options. In this case, the network administer used it to identify the ospf option and then typed show ip route ospf to view only remote OSPF entries.
Example 4-8 displays the output from the show ip access-lists IOS command.
Example 4-8 show ip access-lists
R1#show ip access-lists ?
<1-199> |
Access list number |
|
<1300-2699> |
Access list number (expanded range) |
|
WORD |
Access list name |
|
| |
Output modifiers |
|
<cr> |
|
|
R1#show ip access-lists |
|
|
Standard IP access list |
1 |
|
permit 131.108.0.0, |
wildcard bits 0.0.255.255 |
|
Extended IP access list |
100 |
|
permit tcp any host |
131.108.1.1 eq telnet |
|
Example 4-8 enables the network administrator to quickly verify any defined access lists. Example 4-8 includes two access lists numbered 1 and 100.
Use the show debugging command to display any debug commands in use. This verifies if any debugging is currently enabled.
Example 4-9 displays the sample output when debug ip routing is enabled.
Example 4-9 show debugging Command
R1#show debugging
IP routing:
IP routing debugging is on
R1#undebug all
All possible debugging has been turned off
Currently, the router in Example 4-9 is enabled for debugging IP routing. To turn off the debugging, apply the undebug all command, as shown in Example 4-9. This command ensures all debug options are disabled. You can specify the exact debug option you want to disable with the no options; for example, to disable the IP packet option, the IOS command is no debug ip packet.
To display the hardware interfaces on the router, use the show interfaces command to explore the physical and statistical state.

164 Chapter 4: Cisco IOS Specifics and Security
Example 4-10 displays the show interfaces command on a router named R1.
Example 4-10 show interfaces
R1#show interfaces
Ethernet0/0 is up, line protocol is up --physical status
Hardware is AmdP2, address is 0002.b9ad.5ae0 (bia 0002.b9ad.5ae0) Internet address is 131.108.1.1/24
MTU 1500 bytes, BW 10000 Kbit, DLY 1000 usec, reliability 255/255, txload 1/255, rxload 1/255
Encapsulation ARPA, loopback not set Keepalive set (10 sec)
ARP type: ARPA, ARP Timeout 04:00:00
Last input 00:00:00, output 00:00:01, output hang never Last clearing of "show interface" counters 00:00:05 Queueing strategy: fifo
Output queue 0/40, 0 drops; input queue 0/75, 0 drops 5 minute input rate 0 bits/sec, 0 packets/sec
5 minute output rate 0 bits/sec, 0 packets/sec
1 packets input, 366 bytes, 0 no buffer
Received 1 broadcasts, 0 runts, 0 giants, 0 throttles 0 input errors, 0 CRC, 0 frame, 0 overrun, 0 ignored 0 input packets with dribble condition detected
3 packets output, 202 bytes, 0 underruns(0/0/0)
0 output errors, 0 collisions, 0 interface resets
0 babbles, 0 late collision, 0 deferred
0 lost carrier, 0 no carrier
0 output buffer failures, 0 output buffers swapped out Serial0/0 is up, line protocol is up
Hardware is PowerQUICC Serial Internet address is 131.108.255.1/30
MTU 1500 bytes, BW 256 Kbit, DLY 20000 usec, reliability 255/255, txload 1/255, rxload 1/255
Encapsulation FRAME-RELAY, loopback not set Keepalive set (10 sec)
LMI enq sent 0, LMI stat recvd 0, LMI upd recvd 0, DTE LMI up LMI enq recvd 0, LMI stat sent 0, LMI upd sent 0
LMI DLCI 0 LMI type is ANSI Annex D frame relay DTE
Broadcast queue 0/64, broadcasts sent/dropped 1/0, interface broadcasts 1 Last input 00:00:02, output 00:00:00, output hang never
Last clearing of "show interface" counters 00:00:07
Input queue: 0/75/0/0 (size/max/drops/flushes); Total output drops: 0 Queueing strategy: weighted fair
Output queue: 0/1000/64/0 (size/max total/threshold/drops) Conversations 0/1/256 (active/max active/max total) Reserved Conversations 0/0 (allocated/max allocated) Available Bandwidth 192 kilobits/sec
5 minute input rate 0 bits/sec, 0 packets/sec
5 minute output rate 0 bits/sec, 0 packets/sec
2 packets input, 86 bytes, 0 no buffer

show and debug Commands 165
Example 4-10 show interfaces (Continued)
Received 0 broadcasts, 0 runts, 0 giants, 0 throttles
0 input errors, 0 CRC, 0 frame, 0 overrun, 0 ignored, 0 abort 2 packets output, 86 bytes, 0 underruns
0 output errors, 0 collisions, 0 interface resets
0 output buffer failures, 0 output buffers swapped out
0 carrier transitions
DCD=up DSR=up DTR=up RTS=up CTS=up
Ethernet0/1 is administratively down, line protocol is down Hardware is AmdP2, address is 0002.b9ad.5ae1 (bia 0002.b9ad.5ae1) MTU 1500 bytes, BW 10000 Kbit, DLY 1000 usec,
reliability 255/255, txload 1/255, rxload 1/255 Encapsulation ARPA, loopback not set
Keepalive set (10 sec)
ARP type: ARPA, ARP Timeout 04:00:00
Last input never, output never, output hang never Last clearing of "show interface" counters 00:00:10 Queueing strategy: fifo
Output queue 0/40, 0 drops; input queue 0/75, 0 drops 5 minute input rate 0 bits/sec, 0 packets/sec
5 minute output rate 0 bits/sec, 0 packets/sec
0 packets input, 0 bytes, 0 no buffer
Received 0 broadcasts, 0 runts, 0 giants, 0 throttles 0 input errors, 0 CRC, 0 frame, 0 overrun, 0 ignored 0 input packets with dribble condition detected
0 packets output, 0 bytes, 0 underruns(0/0/0)
0 output errors, 0 collisions, 0 interface resets
0 babbles, 0 late collision, 0 deferred
0 lost carrier, 0 no carrier
0 output buffer failures, 0 output buffers swapped out
Example 4-10 displays a router with two Ethernet interfaces and one serial interface. Interface Ethernet 0/0 is enabled and is currently running packets over the wire, while Ethernet 0/1 is not enabled. Interface Serial 0/0 is configured for Frame Relay and the physical layer (Layer 1) details are displayed. Other possible physical states are as follows:
Ethernet0/1 is up, line protocol is up—The Ethernet Interface is active, sending and receiving Ethernet frames.
Ethernet0/1 is up, line protocol is down—The Ethernet Interface is cabled but no keepalives are received, and no Ethernet frames are sent or received (possible cable fault).
Ethernet0/1 is administratively down, line protocol is down—Ethernet Interface is not enabled administratively; typically an interface not configured as yet.
Ethernet 0/1 is down, line protocol is up—A physical condition is not possible, for example.

166 Chapter 4: Cisco IOS Specifics and Security
To display the system log (syslog), use the show logging command. Example 4-11 displays a sample output taken from a router name R1.
Example 4-11 show logging Command
R1#show logging
Syslog logging: enabled (0 messages dropped, 0 messages rate-limited, 0 flushes, 0 overruns)
Console logging: level debugging, 27 messages logged
Monitor logging: level debugging, 0 messages logged
Buffer logging: level debugging, 1 messages logged
Logging Exception size (4096 bytes)
Trap logging: level debugging, 31 message lines logged Log Buffer (60000 bytes):
2d20h: %SYS-5-CONFIG_I: Configured from console by console
2d20h: %CLEAR-5-COUNTERS: Clear counter on all interfaces by console
Example 4-11 shows that 27 message have been logged and the logging level is debugging, which entails the following log message types:
•
•
•
•
•
•
•
•
Emergencies—System is unusable (severity = 0)
Alerts—Immediate action needed (severity = 1)
Critical—Critical conditions (severity = 2)
Errors—Error conditions (severity = 3)
Warnings—Warning conditions (severity = 4)
Notifications—Normal but significant conditions (severity = 5)
Informational—Informational messages (severity = 6)
Debugging—Debugging messages (severity = 7)
Two messages have also been displayed on the terminal: the first message is a configuration change, and the second appears when a PRIV EXEC user cleared the counters on all the interfaces.
The show route-map command displays any policy route maps configured. Policy route maps override routing decisions on Cisco routers. Route maps basically allow an administrator to access the route manipulation.
The show version command displays the system’s hardware configuration, the software version, the names and sources of configuration files, and the boot images. Issue the show version EXEC command to accomplish this.
Example 4-12 displays a sample output.

show and debug Commands 167
Example 4-12 show version Command on R1
R1#show version
Cisco Internetwork Operating System Software
IOS (tm) C2600 Software (C2600-IK8O3S-M), Version 12.2(2)T, RELEASE SOFTWARE (f c1)
TAC Support: http://www.cisco.com/cgi-bin/ibld/view.pl?i=support Copyright (c) 1986-2001 by cisco Systems, Inc.
Compiled Sat 02-Jun-01 15:47 by ccai
Image text-base: 0x80008088, data-base: 0x813455F8
ROM: System Bootstrap, Version 11.3(2)XA4, RELEASE SOFTWARE (fc1)
ROM: C2600 Software (C2600-IK8O3S-M), Version 12.2(2)T, RELEASE SOFTWARE (fc1) R1 uptime is 2 days, 20 hours, 15 minutes
System returned to ROM by reload at 14:57:18 UTC Mon Mar 1 1993
System restarted at 10:00:02 UTC Mon Mar 1 1993
System image file is "flash:c2600-ik8o3s-mz.122-2.T.bin"
cisco 2611 (MPC860) processor (revision 0x203) with 61440K/4096K bytes of memory Processor board ID JAD043000VK (1947766474)
M860 processor: part number 0, mask 49 Bridging software.
X.25 software, Version 3.0.0.
2 Ethernet/IEEE 802.3 interface(s)
32K bytes of non-volatile configuration memory.
16384K bytes of processor board System flash (Read/Write) Configuration register is 0x2102
Example 4-12 displays a number of key hardware data about the router. For example, the IOS software version is 12.2T, the router’s uptime is 2 days, 20 hours, 15 minutes, and the memory installed on the router is 64 MB. There is 16 MB of System Flash, and the current configuration register is 0x2102.
NOTE The alias command creates a custom shortcut to IOS commands so the EXEC user does not have to type the complete IOS command. For example, show ip route is already defined in IOS with the shortcut sh ip ro (not an alias command but rather a shortcut command). You can define your own alias with the global IOS command:
alias EXEC alias-name IOS-command
View the predefined aliases with the following command:
Router#show aliases |
|
EXEC mode aliases: |
|
h |
help |
lo |
logout |
p |
ping |
r |
resume |
s |
show |
u |
undebug |
un |
undebug |
w |
where |
168 Chapter 4: Cisco IOS Specifics and Security
For example, you could make the command ospf display only OSPF routes by issuing the following command:
alias EXEC ospf show ip route ospf
Debugging Cisco Routers
The debug command is one of the best set of tools you will encounter on Cisco routers. The debug command is available only from privilege mode.
Cisco IOS router’s debugging includes hardware and software to aid in troubleshooting internal problems and problems with other hosts on the network. The debug privileged EXEC mode commands start the console display of several classes of network events.
For debug output to display on a console port, you must ensure that debugging to the console has not been disabled or sent to the logging buffer with the logging console debug command.
If you enable any debug commands through a console and no debug output is displayed, it might be because logging has been disabled.
Check the running configuration for the line no logging debugging console, and remove this line (by typing logging debugging console) to enable debug messages to be viewed by the console port.
Remember to turn off console logging when you are done troubleshooting the problem. The router will continue to send to the console even if nobody is there, tying up valuable CPU resources.
On virtual lines (VTY lines), you must enable the terminal monitor command to view the debug output. You use VTY lines when you telnet to a remote Cisco router.
NOTE Refer to the Cisco IOS Debug Command Reference at the following URL for the most updated debug command information: www.cisco.com/univercd/cc/td/doc/product/software/ios122/122sup/122debug/index.htm.
When debugging data, you must also be aware of the switching method used by the router (for example, fast or process switches) because the CPU will use the same method when sending debug output to the console or vty line.
The ip route-cache IOS command with no additional keywords enables fast switching. When debug ip packet flow is enabled, make sure you disable fast switching so you can view packet-by-packet flow through the router. Search the Cisco website for the keywords “Process” and “fast switching” for more details on switching methods. The following URL provides quality information on switching methods available on Cisco 7200 routers:
www.cisco.com/en/US/customer/products/sw/iosswrel/ps1831/products_configuration_ guide_chapter09186a00800ca6c7.html#xtocid6.

|
|
show and debug Commands 169 |
|
|
|
|
Table 4-4 displays the debug commands and the system debug message feature. |
|
Table 4-4 |
debug Command Summary |
|
|
|
|
|
IOS Command |
Purpose |
|
|
|
|
show debugging |
Displays the state of each debugging option |
|
|
|
|
debug ? |
Displays a list and brief description of all the debug command |
|
|
options |
|
|
|
|
debug command |
Begins message logging for the specified debug command |
|
|
|
|
no debug command (or undebug all) |
Turns message logging off for the specified debug command |
|
|
or turns off all debug messages with the undebug all |
|
|
command |
|
|
|
Example 4-13 displays the list of debug command options covered in this section.
Example 4-13 debug Command Options
R1#debug ? |
|
all |
Enable all debugging |
ip |
IP information |
list |
Set interface or/and access list for the next debug |
|
command |
R1#debug ip ? |
|
audit |
IDS audit events |
auth-proxy |
Authentication proxy debug |
bgp |
BGP information |
cache |
IP cache operations |
cef |
IP CEF operations |
cgmp |
CGMP protocol activity |
dhcp |
Dynamic Host Configuration Protocol |
drp |
Director response protocol |
dvmrp |
DVMRP protocol activity |
egp |
EGP information |
eigrp |
IP-EIGRP information |
error |
IP error debugging |
flow |
IP Flow switching operations |
ftp |
FTP dialogue |
html |
HTML connections |
http |
HTTP connections |
icmp |
ICMP transactions |
igmp |
IGMP protocol activity |
igrp |
IGRP information |
inspect |
Stateful inspection events |
interface |
IP interface configuration changes |
mbgp |
MBGP information |
mcache |
IP multicast cache operations |
mhbeat |
IP multicast heartbeat monitoring |
mobile |
IP Mobility |
continues

170 Chapter 4: Cisco IOS Specifics and Security
Example 4-13 debug Command Options (Continued)
mpacket |
IP multicast packet debugging |
mrm |
IP Multicast Routing Monitor |
mrouting |
IP multicast routing table activity |
msdp |
Multicast Source Discovery Protocol (MSDP) |
mtag |
IP multicast tagswitching activity |
nat |
NAT events |
nbar |
StILE - traffic classification Engine |
ospf |
OSPF information |
packet |
General IP debugging and IPSO security transactions |
peer |
IP peer address activity |
pim |
PIM protocol activity |
policy |
Policy routing |
postoffice |
PostOffice audit events |
rgmp |
RGMP protocol activity |
rip |
RIP protocol transactions |
routing |
Routing table events |
rsvp |
RSVP protocol activity |
rtp |
RTP information |
scp |
Secure Copy |
sd |
Session Directory (SD) |
security |
IP security options |
socket |
Socket event |
ssh |
Incoming ssh connections |
tcp |
TCP information |
tempacl |
IP temporary ACL |
trigger-authentication |
Trigger authentication |
udp |
UDP based transactions |
urd |
URL RenDezvous (URD) |
wccp |
WCCP information |
|
|
This section covers the debug commands highlighted in Example 4-13.
CAUTION The CPU system on Cisco routers gives the highest priority to debugging output. For this reason, debugging commands should be turned on only for troubleshooting specific problems or during troubleshooting sessions with technical support personnel. Excessive debugging output can render the system inoperable.
Try to use the most specific debug command possible to reduce the load on the CPU. For example, the debug all command will surely disable a router. You should use only the debug all command in a lab environment.
Typically, the console port is used for debugging major faults because the CPU places debugging messages to the console port as the highest priority. Sometimes, debugging messages can overwhelm a network administrator’s ability to monitor the router, and the IOS command, logging synchronous, can limit the messages to the console.

show and debug Commands 171
When synchronous logging of unsolicited messages and debug output is turned on (the line console is configured with the logging synchronous IOS command), unsolicited Cisco IOS Software output is displayed on the console or printed after solicited Cisco IOS Software output is displayed or printed. Unsolicited messages and debug output is displayed on the console after the prompt for user input is returned. This keeps unsolicited messages and debug output from being interspersed with solicited software output and prompts. After the unsolicited messages are displayed, the console displays the user prompt again. The IOS commands logging trap can be used to limit the logging of error messages sent to syslog servers to only those messages at the specified level (levels range from 0 to 7). The lowest level is 7 (debugging messages, greatest level of messages, as level 7 encompasses all levels possible from 0 to 7), and the highest level is 0, or emergencies (system is unusable).
The debug all command turns on all possible debug options available to a Cisco router. This will crash any router in a busy IP network, so we strongly recommended that you never apply this command in a working network environment.
Example 4-14 displays the options when enabling IP packets through a Cisco router.
Example 4-14 debug ip packet ?
R1#debug ip packet ?
<1-199> |
Access list |
<1300-2699> Access list (expanded range)
detail |
Print more debugging detail |
<cr> |
|
You can define an access list so that only packets that satisfy the access list are sent through to the console or vty line.
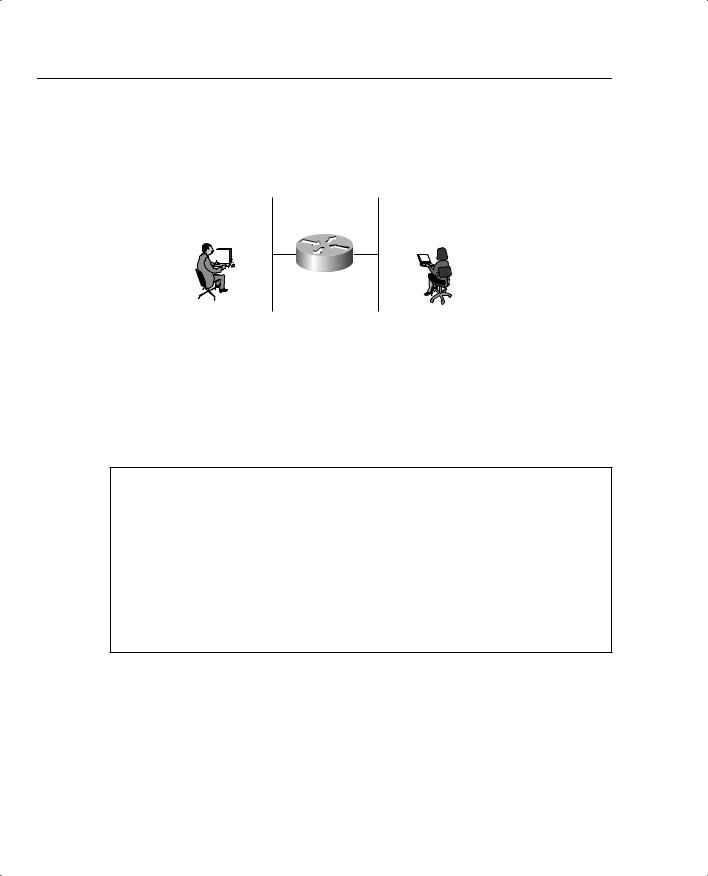
Figure 4-3 displays a typical example where Simon, a user on one Ethernet (Ethernet 0/0), is advising you that packets from users on Ethernet 0/1 (Melanie’s PC) are not reaching each other. To view the routing packet flow through Router R1, you can debug the IP packets and use a standard access list or an extended one (access lists are covered later in this chapter).
To view the IP packet flow and ensure that you view only packets from Melanie’s PC to Simon’s PC, you can define an extended access list matching the source address, 131.108.2.100 (Melanie’s PC), to the destination address, 131.108.1.100 (Simon’s PC).
172 Chapter 4: Cisco IOS Specifics and Security
Figure 4-3 IP Data Flow from One Segment to Another
Users Report
No Packet Flow
Application Layer Errors 
 Application Layer Errors
131.108.1.100/24 |
131.108.2.100/24 |
|||
|
|
|
|
R1 |
|
|
|
|
|
|
|
|
|
|
|
|
|
|
|
E0/0 E0/1
User Simon |
User Melanie |
|
interface Ethernet0/0
ip address 131.108.1.1 255.255.255.0 interface Ethernet0/1
ip address 131.108.2.1 255.255.255.0
Example 4-15 displays the debug command configuration on Router R1.
Example 4-15 Enabling debug ip packet with Access-list 100
R1#config terminal
Enter configuration commands, one per line. End with CNTL/Z.
R1(config)#access-list 100 permit ip host 131.108.2.100 host 131.108.1.100
R1#debug ip packet ?
<1-199> |
Access list |
<1300-2699> |
Access list (expanded range) |
detail |
Print more debugging detail |
<cr> |
|
R1#debug ip packet 100 ?
detail Print more debugging detail <cr>
R1#debug ip packet 100 detail
IP packet debugging is on (detailed) for access list 100
Applying the exact debug command for only traffic generated from one device to another ensures that the router is not using too many CPU cycles to generate the debug output to the console. When a ping request is sent from Melanie’s PC to Simon’s PC, debug output displays a successful ping request.
Example 4-16 displays the sample debug output matching access-list 100 when 5 ping packets are sent.

show and debug Commands 173
NOTE When debugging with a specific IP access list, be sure to stop all debugging options with the undebug all IOS command before removing IP access lists; Cisco IOS routers are prone to failure if the access list is removed before the debugging options are disabled. For example, no debug output will be captured and sent to the console if no access list is defined but referenced by a debug command (for example, debug ip packet 100, when access-list 100 is not defined). Also, remember that the default, deny not specifically permitted, is the default behavior for Cisco IOS access lists. Make sure you permit only traffic for which you are interested in viewing debug messages like the example shown in Figure 4-3.
Example 4-16 Ping Request
R1#ping 131.108.1.100
2d22h: IP: s=131.108.2.100 (local), d=131.108.1.100 (Ethernet0/0), len 100, sending
2d22h: ICMP type=8, code=0
2d22h: IP: s=131.108.2.100 (Ethernet0/0), d=131.108.1.100 (Ethernet0/0), len 100, rcvd 3
2d22h: ICMP type=8, code=0
2d22h: IP: s=131.108.2.100 (local), d=131.108.1.100 (Ethernet0/0), len 100, sending
2d22h: ICMP type=8, code=0
2d22h: IP: s=131.108.2.100 (Ethernet0/0), d=131.108.1.100 (Ethernet0/0), len 100, rcvd 3
2d22h: ICMP type=8, code=0
2d22h: IP: s=131.108.2.100 (local), d=131.108.1.100 (Ethernet0/0), len 100, sending
2d22h: ICMP type=8, code=0
2d22h: IP: s=131.108.2.100 (Ethernet0/0), d=131.108.1.100 (Ethernet0/0), len 100, rcvd 3
2d22h: ICMP type=8, code=0
2d22h: IP: s=131.108.2.100 (local), d=131.108.1.100 (Ethernet0/0), len 100, sending
2d22h: ICMP type=8, code=0
2d22h: IP: s=131.108.2.100 (Ethernet0/0), d=131.108.1.100 (Ethernet0/0), len 100, rcvd 3
2d22h: ICMP type=8, code=0
2d22h: IP: s=131.108.2.1 (local), d=131.108.1.1 (Ethernet0/0), len 100, sending
2d22h: ICMP type=8, code=0
2d22h: IP: s=131.108.2.100 (Ethernet0/0), d=131.108.1.100 (Ethernet0/0), len 100, rcvd 3
2d22h: ICMP type=8, code=0