

3.3. SEA-FLOOR FEATURES |
25 |
|
0 |
|
|
|
|
Depth (km) |
-2 |
|
|
|
|
-4 |
|
|
|
|
|
|
-6 |
|
|
|
|
|
-45 o |
-30 o |
-15 o |
0 o |
15 o |
|
|
|
Longitude |
|
|
6km
|
|
|
|
6 |
km |
|
|
|
|
|
|
-45 o |
-30 o |
-15 o |
0 o |
15 o |
|
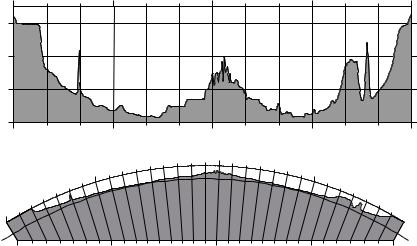
Figure 3.4 Cross-section of the south Atlantic along 25◦S showing the continental shelf o shore of South America, a seamount near 35◦W, the mid-Atlantic Ridge near 14◦W, the Walvis Ridge near 6◦E, and the narrow continental shelf o South Africa. Upper Vertical exaggeration of 180:1. Lower Vertical exaggeration of 30:1. If shown with true aspect ratio, the plot would be the thickness of the line at the sea surface in the lower plot.
than horizontal velocities. Even over distances of a few hundred kilometers, the vertical velocity must be less than 1% of the horizontal velocity. I will use this information later to simplify the equations of motion.
The relatively small vertical velocities have great influence on turbulence. Three dimensional turbulence is fundamentally di erent than two-dimensional turbulence. In two dimensions, vortex lines must always be vertical, and there can be little vortex stretching. In three dimensions, vortex stretching plays a fundamental role in turbulence.
3.3Sea-Floor Features
Earth’s rocky surface is divided into two types: oceanic, with a thin dense crust about 10 km thick, and continental, with a thick light crust about 40 km thick. The deep, lighter continental crust floats higher on the denser mantle than does the oceanic crust, and the mean height of the crust relative to sea level has two distinct values: continents have a mean elevation of 1100 m, the ocean has a mean depth of -3400 m (figure 3.5).
The volume of the water in the ocean exceeds the volume of the ocean basins, and some water spills over on to the low lying areas of the continents. These shallow seas are the continental shelves. Some, such as the South China Sea, are more than 1100 km wide. Most are relatively shallow, with typical depths of 50–100 m. A few of the more important shelves are: the East China Sea, the Bering Sea, the North Sea, the Grand Banks, the Patagonian Shelf, the Arafura Sea and Gulf of Carpentaria, and the Siberian Shelf. The shallow seas help dissipate tides, they are often areas of high biological productivity, and they are usually included in the exclusive economic zone of adjacent countries.
26 |
CHAPTER 3. THE PHYSICAL SETTING |
|
|
|
|
|
Frequency (% Area) |
|
|
|
|
||
|
0.00% |
0.50% |
1.00% |
1.50% |
2.00% |
2.50% |
3.00% |
3.50% |
4.00% |
4.50% |
5.00% |
|
10,000 |
|
|
|
|
|
|
|
|
|
|
|
8,000 |
|
|
|
|
|
|
|
|
|
|
|
6,000 |
|
|
|
|
|
|
|
|
|
|
(meters) |
4,000 |
|
|
|
|
|
|
|
|
|
|
2,000 |
|
|
|
|
|
|
|
|
|
|
|
|
|
|
|
|
|
|
|
|
|
|
|
Elevation |
0 |
|
|
|
|
|
|
|
|
|
|
-2,000 |
|
|
|
|
|
|
|
|
|
|
|
|
|
|
|
|
|
|
|
|
|
|
|
|
-4,000 |
|
|
|
|
|
|
|
|
|
|
|
-6,000 |
|
|
|
|
|
|
|
|
|
|
|
-8,000 |
|
|
|
|
|
|
|
|
|
|
|
-10,000 |
|
|
|
|
|
|
|
|
|
|
|
0% |
10% |
20% |
30% |
40% |
50% |
60% |
70% |
80% |
90% |
100% |
Cumulative (% Area)
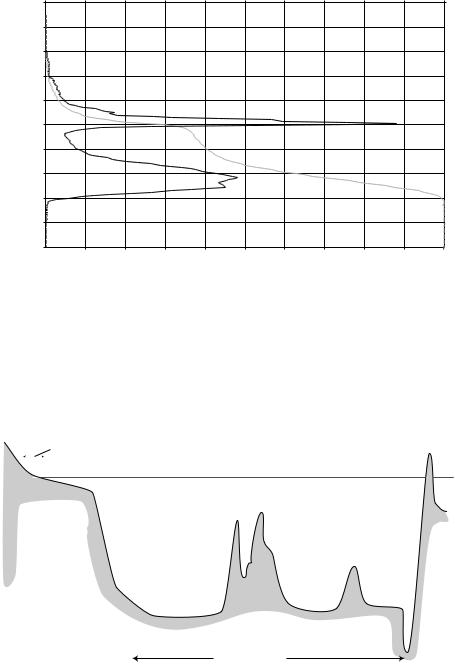
Figure 3.5 Histogram of height of land and depth of the sea as percentage of area of earth in 100 m intervals, showing the clear distinction between continents and sea floor. The cumulative frequency curve is the integral of the histogram. The curves are calculated from the etopo 2 data set by George Sharman of the noaa National Geophysical Data Center.
The crust is broken into large plates that move relative to each other. New crust is created at the mid-ocean ridges, and old crust is lost at trenches. The relative motion of crust, due to plate tectonics, produces the distinctive features of the sea floor sketched in figure 3.6, including mid-ocean ridges, trenches, is-
CONTINENT
|
Shore |
|
|
|
|
||
|
|
|
|
|
High Water |
Sea Level |
|
|
|
|
|
|
|||
|
|
|
|
||||
|
|
|
|
|
Low Water |
|
|
SHELF |
|
|
|||||
|
|
|
|
||||
(Gravel, |
|
|
|
OCEAN |
|||
|
|
|
|
||||
Sand |
|
|
|
|
|||
Av slope |
SLOPE |
|
|
||||
1 in 500) |
|
|
|||||
|
|
|
|
||||
|
(Mud |
|
|
|
|
||
|
av slope |
|
|
||||
|
1 in 20) |
RISE |
MID-OCEAN |
||||
|
|
|
|
|
|
||
|
|
|
|
|
|
|
|
RIDGE
BASIN
(Clay & Oozes)
Mineral Organic
DEEP SEA
SEAMOUNT
ARC
ISLAND TRENCH
Figure 3.6 Schematic section through the ocean showing principal features of the sea floor. Note that the slope of the sea floor is greatly exaggerated in the figure.
3.3. SEA-FLOOR FEATURES |
27 |
land arcs, and basins. The names of the sub-sea features have been defined by the International Hydrographic Organization (1953), and the following definitions are taken from Sverdrup, Johnson, and Fleming (1942), Shepard (1963), and Dietrich et al. (1980).
Basins are deep depressions of the sea floor of more or less circular or oval form.
Canyons are relatively narrow, deep furrows with steep slopes, cutting across the continental shelf and slope, with bottoms sloping continuously downward.
Continental shelves are zones adjacent to a continent (or around an island) and extending from the low-water line to the depth, usually about 120 m, where there is a marked or rather steep descent toward great depths. (figure 3.7)
Continental slopes are the declivities seaward from the shelf edge into greater depth.
Plains are very flat surfaces found in many deep ocean basins.
Ridges are long, narrow elevations of the sea floor with steep sides and rough topography.
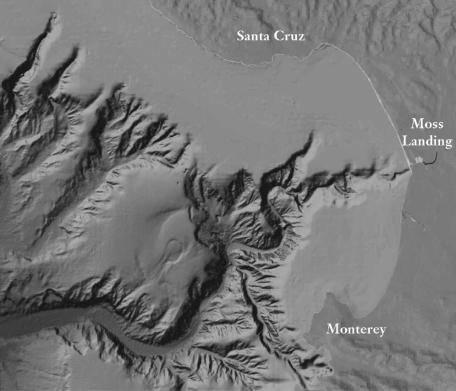
Figure 3.7 An example of a continental shelf, the shelf o shore of Monterey California showing the Monterey and other canyons. Canyons are common on shelves, often extending across the shelf and down the continental slope to deep water. Figure copyright Monterey Bay Aquarium Research Institute (mbari).
28 |
CHAPTER 3. THE PHYSICAL SETTING |
21.4 o |
|
|
|
|
|
|
|
|
40 |
|
|
|
|
|
|
|
|
|
|
48 |
21.3 o |
30 |
|
|
|
40 |
|
|
|
|
|
|
||
|
|
|
14 |
|
|
|
|
|
20 |
|
|
|
|
21.2 o |
|
|
|
|
|
|
21.1 o |
|
|
|
|
|
|
|
40 |
|
20 |
|
|
|
21.0 o |
|
|
|
|
|
|
|
|
30 |
|
|
40 |
|
|
|
|
|
|
|
|
20.9 o |
|
|
|
|
|
|
20.8 o |
|
|
|
|
|
|
163.0 o |
163.1 o |
163.2 o |
163.3 o |
163.4 o |
163.5 o |
163.6 o |
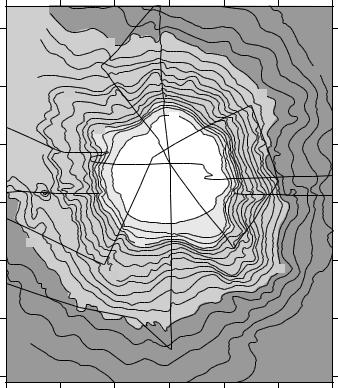
Figure 3.8 An example of a seamount, the Wilde Guyot. A guyot is a seamount with a flat top created by wave action when the seamount extended above sea level. As the seamount is carried by plate motion, it gradually sinks deeper below sea level. The depth was contoured from echo sounder data collected along the ship track (thin straight lines) supplemented with side-scan sonar data. Depths are in units of 100 m. From William Sager, Texas A&M University.
Seamounts are isolated or comparatively isolated elevations rising 1000 m or more from the sea floor and with small summit area (figure 3.8).
Sills are the low parts of the ridges separating ocean basins from one another or from the adjacent sea floor.
Trenches are long, narrow, and deep depressions of the sea floor, with relatively steep sides (figure 3.9).
Sub-sea features strongly influences the ocean circulation. Ridges separate deep waters of the ocean into distinct basins. Water deeper than the sill between two basins cannot move from one to the other. Tens of thousands of seamounts are scattered throughout the ocean basins. They interrupt ocean currents, and produce turbulence leading to vertical mixing in the ocean.