

Chapter 5
The Oceanic Heat Budget
About half the solar energy reaching earth is absorbed by the ocean and land, where it is temporarily stored near the surface. Only about a fifth of the available solar energy is directly absorbed by the atmosphere. Of the energy absorbed by the ocean, most is released locally to the atmosphere, mostly by evaporation and infrared radiation. The remainder is transported by currents to other areas especially mid latitudes.
Heat lost by the tropical ocean is the major source of heat needed to drive the atmospheric circulation. And, solar energy stored in the ocean from summer to winter helps ameliorate earth’s climate. The thermal energy transported by ocean currents is not steady, and significant changes in the transport, particularly in the Atlantic, may have been important for the development of the ice ages. For these reasons, oceanic heat budgets and transports are important for understanding earth’s climate and its short and long term variability.
5.1The Oceanic Heat Budget
Changes in energy stored in the upper ocean result from an imbalance between input and output of heat through the sea surface. This transfer of heat across or through a surface is called a heat flux . The flux of heat and water also changes the density of surface waters, and hence their buoyancy. As a result, the sum of the heat and water fluxes is often called the buoyancy flux .
The flux of energy to deeper layers is usually much smaller than the flux through the surface. And, the total flux of energy into and out of the ocean must be zero, otherwise the ocean as a whole would heat up or cool down. The sum of the heat fluxes into or out of a volume of water is the heat budget.
The major terms in the budget at the sea surface are:
1.Insolation QSW , the flux of solar energy into the sea;
2.Net Infrared Radiation QLW , net flux of infrared radiation from the sea;
3.Sensible Heat Flux QS , the flux of heat out of the sea due to conduction;
4.Latent Heat Flux QL, the flux of energy carried by evaporated water; and
5.Advection QV , heat carried away by currents.
51
52 |
CHAPTER 5. THE OCEANIC HEAT BUDGET |
|
30 o |
|
|
|
|
|
( Celsius) |
20 o |
|
|
|
|
|
|
|
|
|
|
|
|
Temperature |
10 o |
|
|
|
|
|
|
4.15 |
4.10 |
4.05 |
|
4.00 |
|
|
|
|
||||
|
|
4.20 |
|
|
|
|
|
0 o |
|
|
|
|
|
|
0 |
10 |
|
20 |
30 |
40 |
|
|
|
|
Salinity |
|
|
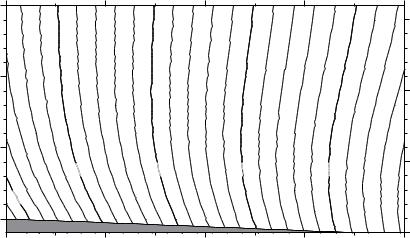
Figure 5.1 Specific heat of sea water at atmospheric pressure Cp in joules per gram per degree Celsius as a function of temperature in Celsius and salinity, calculated from the empirical formula given by Millero et al. (1973) using algorithms in Fofono and Millard (1983). The lower line is the freezing point of salt water.
Conservation of heat requires:
Q = QSW + QLW + QS + QL + QV |
(5.1) |
where Q is the resultant heat gain or loss. Units for heat fluxes are watts/m2. The product of flux times surface area times time is energy in joules. The change
in temperature t of the water is related to change in energy |
E through: |
E = Cp m t |
(5.2) |
where m is the mass of water being warmed or cooled, and Cp is the specific heat of sea water at constant pressure.
Cp ≈ 4.0 × 10³ J · kg−1 · ◦C−1 |
(5.3) |
Thus, 4,000 joules of energy are required to heat 1.0 kilogram of sea water by 1.0◦C (figure 5.1).
Importance of the Ocean in Earth’s Heat Budget To understand the importance of the ocean in earth’s heat budget, let’s make a comparison of the heat stored in the ocean with heat stored on land during an annual cycle. During the cycle, heat is stored in summer and released in the winter. The point is to show that the ocean store and release much more heat than the land.
To begin, use (5.3) and the heat capacity of soil and rocks
Cp(rock) = 800 J · kg−1 · ◦C−1 |
(5.4) |
to obtain Cp(rock) ≈ 0.2 Cp(water).
5.2. HEAT-BUDGET TERMS |
53 |
The volume of water which exchanges heat with the atmosphere on a seasonal cycle is 100 m3 per square meter of surface, i.e. that mass from the surface to a depth of 100 meters. The density of water is 1000 kg/m3, and the mass in contact with the atmosphere is density × volume = mwater = 100, 000 kg. The volume of land which exchanges heat with the atmosphere on a seasonal cycle is 1 m3. Because the density of rock is 3,000 kg/m3, the mass of the soil and rock in contact with the atmosphere is 3,000 kg.
The seasonal heat storage values for the ocean and land are therefore:
E |
ocean |
= C |
p(water) |
m |
water |
t |
t = 10◦C |
|
|
|
|
|
=(4000)(105)(10◦) Joules
=4.0 × 10⁹ Joules
E = C |
p(rock) |
m |
rock |
t |
t = 20◦C |
land |
|
|
|
=(800)(3000)(20◦) Joules
=4.8 × 10⁷ Joules
Eocean = 100
Eland
where t is the typical change in temperature from summer to winter.
The large storage of heat in the ocean compared with the land has important consequences. The seasonal range of air temperatures on land increases with distance from the ocean, and it can exceed 40◦C in the center of continents, reaching 60◦C in Siberia. Typical range of temperature over the ocean and along coasts is less than 10◦C. The variability of water temperatures is still smaller (see figure 6.3, bottom).
5.2Heat-Budget Terms
Let’s look at the factors influencing each term in the heat budget.
Factors Influencing Insolation Incoming solar radiation is primarily determined by latitude, season, time of day, and cloudiness. The polar regions are heated less than the tropics, areas in winter are heated less than the same area in summer, areas in early morning are heated less than the same area at noon, and cloudy days have less sun than sunny days.
The following factors are important:
1.The height of the sun above the horizon, which depends on latitude, season, and time of day. Don’t forget, there is no insolation at night!
2.The length of day, which depends on latitude and season.
3.The cross-sectional area of the surface absorbing sunlight, which depends on height of the sun above the horizon.
4.Attenuation, which depends on: i) Clouds, which absorb and scatter radiation. ii) Path length through the atmosphere, which varies as csc ϕ, where ϕ is angle of the sun above the horizon. iii) Gas molecules which absorb radiation in some bands (figure 5.2). H2O, O3, and CO2 are all

54 |
CHAPTER 5. THE OCEANIC HEAT BUDGET |
Spectral Irradiance E λ ( k W m - 2 µm - 1 )
2.0 |
|
|
Blackbody Radiation |
|
(5900 K) |
|
Solar Radiation |
|
above Atmosphere |
1.5 |
(m=0) |
1.0
Solar Radiation
at Surface (m=2)
0.5
0
0 |
0.5 |
1.0 |
1.5 |
Wavelength ( m)
Figure 5.2 Insolation (spectral irradiance) of sunlight at top of the atmosphere and at the sea surface on a clear day. The dashed line is the best-fitting curve of blackbody radiation the size and distance of the sun. The number of standard atmospheric masses is designated by m. Thus m = 2 is applicable for sunlight when the sun is 30◦above the horizon. After Stewart (1985: 43).
important. iv) Aerosols which scatter and absorb radiation. Both volcanic and marine aerosols are important. And v) dust, which scatters radiation, especially Saharan dust over the Atlantic.
5.Reflectivity of the surface, which depends on solar elevation angle and roughness of sea surface.
Solar inclination and cloudiness dominate. Absorption by ozone, water vapor, aerosols, and dust are much weaker.
The average annual value for insolation (figure 5.3) is in the range:
30 W/m2 < QSW < 260 W/m2 |
(5.5) |
Factors Influencing Infrared Flux The sea surface radiates as a blackbody having the same temperature as the water, which is roughly 290 K. The distribution of radiation as a function of wavelength is given by Planck’s equation. Sea water at 290 K radiates most strongly at wavelengths near 10 µm. These wavelengths are strongly absorbed by clouds, and somewhat by water vapor. A plot of atmospheric transmittance as a function of wavelength for a clear

5.2. HEAT-BUDGET TERMS |
55 |
Clear-Sky Downward Insolation ( W / m 2 )
90 o |
|
|
150 |
60 o |
|
30 o |
|
|
300 |
0 o |
|
-30 o |
|
-60 o |
150 |
|
0
-90 o
Mar Apr
350 |
150 |
350 |
|
|
300 |
300 |
|
|
50 |
|
|
150 |
|
|
|
|
|
May |
June |
July |
Aug |
Sep |
|
|
0 |
|
|
|
|
|
150 |
|
|
|
|
|
300 |
|
350 |
|
|
|
300 |
|
|
|
300 |
|
|
|
|
|
Oct |
Nov |
Dec |
Jan |
Feb |
Figure 5.3 Monthly average of downward flux of sunlight through a cloud-free sky and into the ocean in W/m2 during 1989 calculated by the Satellite Data Analysis Center at the nasa Langley Research Center (Darnell et al. 1992) using data from the International Satellite Cloud Climatology Project.
atmosphere but with varying amounts of water vapor (figure 5.4) shows the atmosphere is nearly transparent in some wavelength bands called windows.
The transmittance on a cloud-free day through the window from 8 µm to 13 µm is determined mostly by water vapor. Absorption in other bands, such as those at 3.5 µm to 4.0 µm depends on CO2 concentration in the atmosphere. As the concentration of CO2 increases, these windows close and more radiation is trapped by the atmosphere.
Because the atmosphere is mostly transparent to incoming sunlight, and somewhat opaque to outgoing infrared radiation, the atmosphere traps radiation. The trapped radiation, coupled with convection in the atmosphere, keeps earth’s surface 33◦ warmer than it would be in the absence of a convecting, wet atmosphere but in thermal equilibrium with space. The atmosphere acts like the panes of glass on a greenhouse, and the e ect is known as the greenhouse e ect . See Hartmann (1994: 24–26) for a simple discussion of the radiative balance of a planet. CO2, water vapor, methane, and ozone are all important greenhouse gasses.
The net infrared flux depends on:
1.Clouds thickness. The thicker the cloud deck, the less heat escapes to space.
2.Cloud height, which determines the temperature at which the cloud radiates heat back to the ocean. The rate is proportional to t4, where t is the temperature of the radiating body in Kelvins. High clouds are colder than low clouds.
3.Atmospheric water-vapor content. The more humid the atmosphere the
less heat escapes to space.

56 |
CHAPTER 5. THE OCEANIC HEAT BUDGET |
Transmittance
1 
Subarctic Winter
'62 U.S. Standard
Tropical
0 |
|
|
|
|
|
0 |
1 |
2 |
3 |
4 |
5 |
Wavlength ( m ) 1 


Transmittance
Subarctic Winter
Midlatitude Winter
1962 U.S. Standard
Subarctic Summer
Midlatitude Summer
Tropical
0 
6 |
8 |
10 |
12 |
14 |
16 |
18 |
20 |
22 |
24 |
26 |
28 |
|
|
|
|
|
Wavlength ( m ) |
|
|
|
|
|
|
Figure 5.4 Atmospheric transmittance for a vertical path to space from sea level for six model atmospheres with very clear, 23 km, visibility, including the influence of molecular and aerosol scattering. Notice how water vapor modulates the transparency of the 10-14 µm atmospheric window, hence it modulates QLW , which is a maximum at these wavelengths. After Selby and McClatchey (1975).
4.Water Temperature. The hotter the water the more heat is radiated. Again, radiation depends of t4.
5.Ice and snow cover. Ice emits as a black body, but it cools much faster than open water. Ice-covered seas are insulated from the atmosphere.
Water vapor and clouds influence the net loss of infrared radiation more than surface temperature. Hot tropical regions lose less heat than cold polar regions. The temperature range from poles to equator is 0◦C < t < 25◦C or 273K < t < 298K, and the ratio of maximum to minimum temperature in Kelvins is 298/273 = 1.092. Raised to the fourth power this is 1.42. Thus there is a 42% increase in emitted radiation from pole to equator. Over the same distance water vapor can change the net emitted radiance by 200%.
The average annual value for net infrared flux is in the narrow range:
− 60 W/m2 < QLW < −30 W/m2 |
(5.6) |
Factors Influencing Latent-Heat Flux Latent heat flux is influenced primarily by wind speed and relative humidity. High winds and dry air evaporate much more water than weak winds with relative humidity near 100%. In polar regions, evaporation from ice covered ocean is much less than from open water. In the arctic, most of the heat lost from the sea is through leads (ice-free areas). Hence the percent open water is very important for the arctic heat budget.