


Chapter 18 |
DIESEL ENGINE: POST-PROCESSING |
|
Creating a Scatter Plot |
Chapter 18 DIESEL ENGINE: POST-PROCESSING
The following tutorial data files are used in this chapter:
es-ice_phi-t.pos |
|
|
|
star.mdl |
|
|
|
star.evn |
|
(created in Chapter 15) |
|
star.ccmg |
|
||
|
|
||
star.ccmt |
|
|
|
star.trk |
|
|
|
SECTOR_TUTORIALS/droplets.inp
SECTOR_TUTORIALS/scriptDroplets.sh
This chapter presents a tutorial for post-processing solution data for diesel models in both es-ice and pro-STAR.
es-ice can create scatter plots from information contained within a scatter data file (es-ice_phi-t.pos). This file is used here to create a scatter plot of equivalence ratio vs. gas temperature for every cell in the cylinder. Individual data sets are supplied at the crank angles specified by using the Postsetup tool in the Star Controls panel (see Chapter 17, “Post setup” of this volume).
pro-STAR can produce three-dimensional images displaying droplets within the model geometry; a feature that can be used to analyse spray characteristics inside the engine cylinder at any time step. A series of images can also be exported at each time step so that you can create animations of the transient solution using third-party software.
The tutorial covers the following operations:
1.Creating a scatter plot displaying equivalence ratio versus temperature
2.Creating a three-dimensional animation of fuel spray inside the cylinder throughout the simulation
Examples of general post-processing techniques are also given in Chapter 9 of this volume.
Creating a Scatter Plot
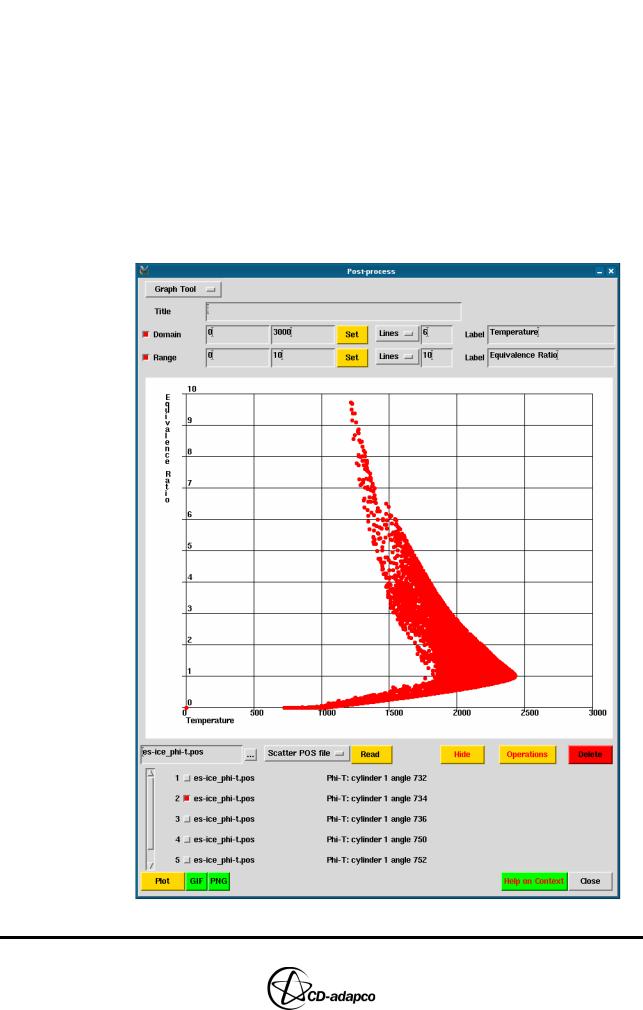
This section describes a scatter plot creation using the es-ice Graph Tool. The plot displays equivalence ratio versus temperature at 734 degrees CA.
First, load the es-ice scatter data file (es-ice_phi-t.pos) into the Graph Tool.
•Launch es-ice in the usual manner
•In the Select panel, click Post-process. The Graph Tool is included in the Post-process panel by default.
•Click the ellipsis (...) button and select es-ice_phi-t.pos from the file browser
•Select Scatter POS file from the drop-down menu
•Click Read
To plot a graph of equivalence ratio versus temperature at 734 degrees CA:
•Select item 2 in the list, labelled Phi-T: cylinder 1 angle 734
•Click Plot
Version 4.20 |
18-1 |
DIESEL ENGINE: POST-PROCESSING |
Chapter 18 |
Creating a Scatter Plot |
|
|
|
Now modify the data range and add grid lines and labels to improve the graph appearance, as shown in Figure 18-1.
•Select the Domain toggle button
•Enter 0 and 3000 in the next two text boxes to cover a suitable data range
•Select Lines (as opposed to Ticks) from the drop-down menu and enter 6 in the adjacent box
•Set the Label to Temperature
•Select the Range toggle button
•Enter 0 and 10 in the next two text boxes to cover a suitable data range
•Select Lines (as opposed to Ticks) from the drop-down menu and enter 10 in the adjacent box
•Set the Label to Equivalence Ratio
Figure 18-1 Equivalence ratio versus temperature scatter plot
18-2 |
Version 4.20 |

Chapter 18 |
DIESEL ENGINE: POST-PROCESSING |
|
Creating a Spray Droplet Animation |
|
|
Creating a Spray Droplet Animation
This section gives an example of how you can use a pro-STAR input file (droplets.inp) to create an animation of fuel injection during the simulation.
Opening the input file with a text editor will display its contents, as shown in the following section. For clarity, the full command names have been used although the usual four-letter abbreviations can be substituted for them.
•Connect the events file and load the transient data
RESUME, , EVFILE, CONNECT TRLOAD, ,
•Create a custom colour table for use with the colour scale
CLRTABLE, POST, 1, 1.00, 0.00, 0.00, 1.0 CLRTABLE, POST, 2, 1.00, 0.20, 0.00, 1.0 CLRTABLE, POST, 3, 1.00, 0.40, 0.00, 1.0 CLRTABLE, POST, 4, 1.00, 0.55, 0.00, 1.0 CLRTABLE, POST, 5, 1.00, 0.70, 0.00, 1.0 CLRTABLE, POST, 6, 1.00, 0.80, 0.00, 1.0 CLRTABLE, POST, 7, 1.00, 0.90, 0.00, 1.0 CLRTABLE, POST, 8, 1.00, 1.00, 0.00, 1.0 CLRTABLE, POST, 9, 0.85, 1.00, 0.10, 1.0 CLRTABLE, POST, 10, 0.70, 1.00, 0.25, 1.0 CLRTABLE, POST, 11, 0.55, 1.00, 0.40, 1.0 CLRTABLE, POST, 12, 0.40, 1.00, 0.55, 1.0 CLRTABLE, POST, 13, 0.25, 1.00, 0.70, 1.0 CLRTABLE, POST, 14, 0.10, 1.00, 0.85, 1.0 CLRTABLE, POST, 15, 0.00, 1.00, 1.00, 1.0 CLRTABLE, POST, 16, 0.00, 0.90, 1.00, 1.0 CLRTABLE, POST, 17, 0.00, 0.80, 1.00, 1.0 CLRTABLE, POST, 18, 0.00, 0.70, 1.00, 1.0 CLRTABLE, POST, 19, 0.00, 0.55, 1.00, 1.0 CLRTABLE, POST, 20, 0.00, 0.40, 1.00, 1.0
•Specify a 20-colour scale with a user-defined value range of 0 to 0.2
CSCALE, 20, USER, 0, 0.1
•Set up the display items
PLLOCALCOOR, OFF, ALL PLDISPLAY, OFF, ALL PLDISPLAY, ON, LOGO PLDISPLAY, ON, HEAD PLDISPLAY, ON, MINMAX PLDISPLAY, ON, SCALE, ,8 PLMESH, OFF
Version 4.20 |
18-3 |

DIESEL ENGINE: POST-PROCESSING |
Chapter 18 |
Creating a Spray Droplet Animation |
|
|
|
•Set up the viewing position
VIEW, -1, 1, 1 CENTER, 40, 0, -42 DISTANCE, 60
•Select the Extended Graphics option and set up image output with a 1024 x 768 image resolution
TERMINAL, , EXTE
HRSDUMP, IMAGE, 1024, 768
•Specify the cylinder geometry colour
CLRTABLE, GEOM, 10, 0.6, 0.6, 0.6, 0.3 CTABLE, 501, FLUID, 10
CSET, ALL CMODIFY, CSET
•Collect the piston surface data into a cell set
CTABLE, 502, FLUID BSET, NEWSET, REGION, 6 CSET, NEWSET, BSET CMODIFY, CSET
•Set up the droplet display options
DOPTION, EDGE, OFF DOPTION, PERIMETER, 1
DOPTION, RADIUS, CONSTANT, 0.1 DOPTION, VECTOR, NONE, 1
•Increase the memory allocation
MEMORY, MAXDRP, 500000 MEMORY, MAXSC2, 1E7
•Set up a variable, it, which is incremented at each loop iteration and begin the loop definition
*SET, it, 1, 1 *DEFINE, NOEXECUTE
•Store the next time step
STORE, NEXT
•Set up a crank angle display label positioned in the lower-right corner of the
18-4 |
Version 4.20 |

Chapter 18 |
DIESEL ENGINE: POST-PROCESSING |
|
Creating a Spray Droplet Animation |
|
|
screen
*GET, TIME, time
*SET, CRANK, 1100 * TIME * 6 + 680 TSCALE, 4, 15
PLLABEL, 1, FORMAT, , 4, 10, 0.5 CRANK
F6.1, ' degCA'
•Merge vertices for a clear view of the display
CSET, ALL
VSET, NEWSET, CSET VMERGE, VSET
•Read and plot droplets at the current time step
PTREAD, , TIME DSET, ALL POPTION, GEOM CPLOT
DOPTION, FILL, COLOR, 0 DPLOT
•Create a pro-STAR “layer” for the droplet display
LAYER, DROP, STORE LAYER, DROP, HIDE
•Plot cell-averaged fuel scalar data on the piston surface
GETCELL, CONC, 1
CSET, NEWSET, TYPE, 502 CAVERAGE, CSET
POPTION, CONT CPLOT
•Create a layer for the fuel scalar display
LAYER, CONT, STORE LAYER, CONT, HIDE
•Show all layers
LAYER, ALL, SHOW REPLOT
•Create a counter for the filenames
Version 4.20 |
18-5 |

DIESEL ENGINE: POST-PROCESSING |
Chapter 18 |
Creating a Spray Droplet Animation |
|
|
|
*SET, itn, 1000 + it *SCOPY, itn, sitn, i4
•Export the current plot to a .gif file
*SSET, sname, image_1_{sitn} HRSDUMP, GIF, {sname}
•End the loop definition and then execute the loop for all time steps
*END
*LOOP, 0, 60
Note that useful information on creating post-processing input files can be found in the pro-STAR Commands and Post-Processing User Guide volumes of the STAR-CD documentation set.
Input files can be used with pro-STAR in batch mode to generate images and animations without opening the GUI. This facility is useful for producing consistent output from a number of different models and thus simplifying the comparison of results.
For Windows systems, off-screen rendering using pro-STAR is not currently supported. This means that the ability to use pro-STAR in batch mode to generate images and animations is not available. However, you can use input files within the pro-STAR GUI by issuing the following command:
IFILE, droplets.inp
Note that when importing an input file via the pro-STAR GUI, you need to add a c after the TRLOAD, , and VMERGE, VSET commands as the software prompts you to continue listing. This addition is not required when pro-STAR is running in batch mode as the software does not prompt for input.
An example of a Linux script for creating a droplet movement animation in batch is given below. The script employs third-party software (Gifsicle) to create animations and uses several .gif files. This software can be substituted by a different application if Gifsicle is unavailable.
•Run pro-STAR in batch mode, with input redirection to disable prompts, and load the sector.mdl model file
$STARDIR/bin/prostar gl -b << EOF star
y y
•Import the input file and run the commands
IFILE, droplets.inp
•Quit pro-STAR without saving and complete the input redirection
QUIT, NOSAVE
18-6 |
Version 4.20 |
Chapter 18 |
DIESEL ENGINE: POST-PROCESSING |
|
Creating a Spray Droplet Animation |
|
|
EOF
•Create an animation called droplets.gif using Gifsicle gifsicle -d 10 -l -o droplets.gif image*.gif
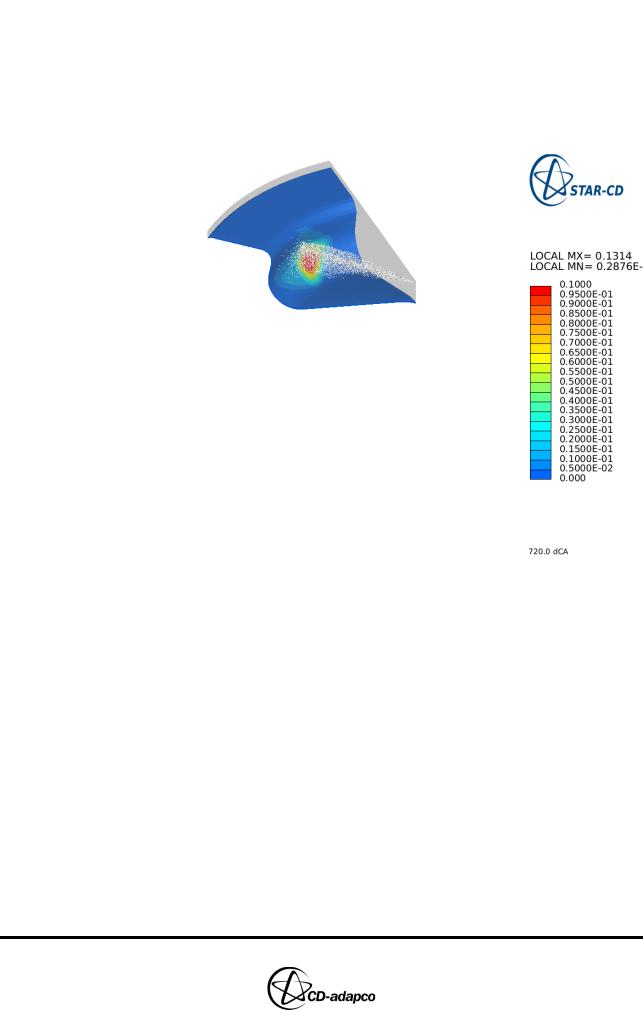
Figure 18-2 shows the fuel droplets and fuel concentration on the piston surface.
Figure 18-2 Fuel droplets and fuel distribution on piston surface.
Version 4.20 |
18-7 |