

24 |
2 Stochastic Model of the Diffusion of Pollutants in LandÞll Management |
|
|
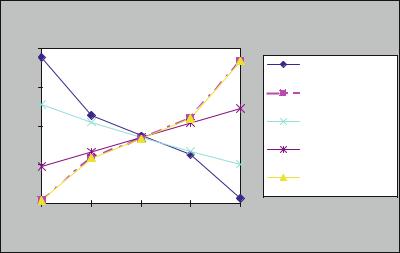
Z2 = (HG*HC/POROS)*TH/EDC |
||
50.00 |
|
|
|
|
|
|
|
|
Diffusion coefficient- |
45.00 |
|
|
|
EDC |
|
|
|
Hydraulic |
|
|
|
|
|
|
|
|
|
|
conductivity-HC |
40.00 |
|
|
|
porosity-POROS |
|
|
|
|
|
|
|
|
|
Thickness of the |
35.00 |
|
|
|
isolation barrier-TH |
|
|
|
hydraulic |
|
|
|
|
|
|
|
|
|
|
gradient-HG |
30.00 |
|
|
|
|
1.0% |
25.5% |
50.0% |
74.5% |
99.0% |
|
Percentiles of the variables |
|
||
Fig. 2.15 The sensitivity line graph (spider chart). (Source: Own work)
2.5The Results
Based on the obtained results, the following conclusions can be reached (Bieda 2000).
From the analysis of the frequency charts shown in Figs. 2.8 and 2.9, it appears that intervals equivalent to the 68th and 95th percentage level of conÞdence are equal to [31.62; 46.40] and [26.51; 55.99], respectively. The range width between the left and the right edge of the frequency chart (Figs. 2.8, 2.9) is 60.11 (Fig. 2.10); this is equivalent to the difference between the 0th and the 100th percentile, as can be seen in Fig. 2.11. The display range is between 19.45 and 58.72.
The evaluated value of the Þnal result of the Z2 expression, of 38.5714 (from a deterministic perspective, described as evaluated Ð see Biegus 1999), from the formula (2.9), after substituting the experimental data presented in Table 2.1, is smaller than the estimated forecast value of Z2 ¼ 39.09, calculated with the help of Crystal Ball (from a probabilistic perspective, described as estimated Ð see as above). The expectation that the Þnal resultÕs value of the Z2 expression will be within the assigned conÞdence intervals is fulÞlled. Therefore, the result of the stochastic analysis can be seen as conÞrmation that the conÞdence intervals of [31.62; 46.40], respectively, with the probability of p ¼ 0.95, indicated using MC method and Crystal Ball software, cover the mean value of Z2 (i.e. the value of Z2 is within these intervals). The application of computer simulation results in the information regarding MC method and the dynamics of the process becoming available.
2.6 Summary and Conclusion |
25 |
2.6Summary and Conclusion
The simulation results demonstrate that MC method, employed to solve stochastic models that describe the transport of contaminants in porous media, is a very useful tool applied to determine the life cycle of a modern landÞll, and may be valuable when it comes to simulation studies of modelling waste management, the two aspects that are extremely important in environmental management (Bieda 2004b, 2004d, 2006c). Previously, deterministic models were used in such cases. Yet, as is noted by Snopkowski (2007), one needs to realise that by using stochastic values, it should not be expected that the results are going to be too accurate. What is very beneÞcial, when it comes to stochastic simulation (and other types of simulations for that matter), is its ability to compare the values calculated under deÞned real conditions, with the values of the same attributes obtained by the means of simulation of this process. However, in the presented case of calculating the optimum liner thickness of a landÞll during its desired operational life, the modelled process will take place in the future and veriÞcation of such comparisons may be difÞcult, if not impossible (Bieda 2007b). Majer et al. (2007), draw attention to the fact that construction of landÞlls in recent years has grown to become an independent business. This work can, therefore, constitute a helpful method during the design and construction process of, for example, mineral liners. There are few publications and little research done in this area and the procedures described in international subject literature are not always adequate to Polish conditions. Another issue that needs recognition is the fact that many countries use different methods of how, for instance, soil properties are deÞned, and these inconsistencies may sometimes lead to conclusions that cannot be compared (Canarache and Simota 2002). Pilkey and Pilkey-Jarvis (2007), in their description of the Total System Performance Assessment (TSPA) model, a very sophisticated model whose architecture consists of 286 sub-models, applied in the study of radioactive waste, stored at Yucca Mountain in Arizona, USA, strongly emphasise the fact that if an assumption is made about a low value of rock permeability Ð a parameter that is involved in risk assessment of waste storage Ð then after a long period of time the numerical value of this parameter ought to be analysed due to the fact that during rainy seasons water Þlters through from desert regions to underground repositories. Consequently, the results achieved on the basis of the TSPA model used, may be unreliable. According to Moczko (1999), even a correct interpretation of obtained results would not improve the badly gathered experimental data. Moreover, the values of parameters published in the subject literature are often equivalent only to the conditions in which the research has been conducted. Empirical formulas, mentioned in literature, are characterised by large discrepancies. Nevertheless, simulation enhances understanding of what changes can be caused by a change of certain quantities taking part in simulation modelling. Deterministic analysis is based on an analytical description, or on a numerical approximation, of phenomena connected to transport and accumulation of pollutants. Stochastic analysis, however, makes use of the data that display the relations between available data and measurement
26 |
2 Stochastic Model of the Diffusion of Pollutants in LandÞll Management |
values. The abovementioned simulation method of transport of contaminants in porous media may, in addition, have practical signiÞcance in measuring the range of safety zones surrounding industrial plants, landÞlls, etc., in order to avoid contamination and degradation of the ground, a situation that occurred in the former Huta im. Lenina (LeninÕs Steel Plant), in Krako«w (today, ArcelorMittal Steel Poland), which was a cause of a serious source of contamination of the surrounding area (e.g. cadmium contamination in Kokoto«w, which is situated in the Krako«w area (Gaweþda 2009)). The application of a computer simulation method offers more possibilities, as it allows the ability to analyse a model in a situation where its parameters are assigned other probability distributions, such as normal distribution.
Chapter 3
The Role of Risk Assessment in Investment Costs Management, Based on the Example of Waste Treatment (Gasification) Facility in the City of Konin
3.1Introduction
The technology behind converting, disposal, and destruction of waste is constantly being modernised. The United States Environmental Protection Agency (EPA) sponsors competitions and finances a considerable number of innovative scientific-research studies in this field. As a result, various project ideas can be realised and the most interesting solutions can be turned into real technology, thanks to EPA funding. In Poland, the Article 1 of the Waste Management Act of 27 April (Official Journal ‘Dz. U.’ No. 62 2001) and the Directives 91/156/EEC, 91/ 689/EEC, and 94/67/EEC of the European Parliament and of the Council (Dyrektywa 2010), state the rules regarding waste procedures which ensure human life and health safety, as well as environmental protection, in accordance with the rules of sustainable development, and especially the rules establishing how waste production can be avoided, or rules limiting the amount of waste and its negative impact on the environment, as well as the waste recovery or waste neutralisation rules.
This chapter does not provide a more detailed description of risk management, and the nine theories, discussed by Hall (1997), which are of fundamental importance to risk management, are presented elsewhere (Bieda 2002, 2004e, 2006e), and their inclusion in this chapter goes beyond the framework of this project.
3.2Risk in Waste Management (Environmental Protection) in European Union and International Legislation
The main aim of the legislation is the minimisation of risk in the field of environmental protection and public health. Thus, it is crucial to differentiate between ‘danger’ and ‘risk’. In the context of waste management, a threat is a possible source of danger, whereas risk indicates the possibility of causing a threat
B. Bieda, Stochastic Analysis in Production Process and Ecology Under Uncertainty, |
27 |
DOI 10.1007/978-3-642-28056-6_3, # Springer-Verlag Berlin Heidelberg 2012 |
|
28 |
3 The Role of Risk Assessment in Investment Costs Management |
(Bradly and Goldman 2010; Champy 1995). The definition of risk consists of two elements: the threat, and the possibility of its occurrence. Consequently, the same level of risk may be resulting from a combination of high threat and low probability of its appearance, or low threat but with high probability of it being real. The United States Environmental Protection Agency (EPA) has developed the Waste Resource Allocation Program (WRAP), whose aim is to analyse the risk involved in transport, utilisation, and storage of hazardous waste (Nema and Gupta 1999). The function of the model’s aim is to minimise the cost and the risk, while dealing with a range of restrictions (the waste’s mass, the processing power of a waste treatment facility, utilisation technology, etc.) The definition of risk is similar to the definition of banking risk. It is measured by a product of:
•The probability of an event happening (the generation of hazardous waste),
•The consequence of an event happening.
In addition, the United States Environmental Protection Agency (EPA), in 1989, developed a Stochastic Risk Assessment model for hazardous waste (Valde´s et al. 1998). This model was built using Excel spreadsheet and Crystal Ball software (CB 2010).
3.3The Application of MC Simulation, Using Simlab® Software, in the Analysis of Investment Risk: Probabilistic Cost Model of the Construction Project of the Waste Treatment Facility in the City of Konin
Certainty is no doubt. In Webster’s New Collegiate Dictionary, one of its definitions of the word ‘certainty’ is that it is a state of ‘having no doubt’, a definition that can be treated as sufficient when it comes to studying risk management. The antonym of certainty is uncertainty, which is defined as ‘doubting in the ability to predict the consequences of current actions’ (Williams et al. 2002). Risk is the potential changeability of events. Risk is an objective term and, as such, it can be measured. The discussed problem of investment risk in the project of the Waste Treatment Facility in the City of Konin is based on the utilisation of theoretical distributions used in probability theory and in statistics. Probability is about evaluating the proportions of results concerning the given events’ chance of happening. The knowledge of the described probability distribution allows a probability assignment procedure to be applied in specific stages of risk management procedures, in order to set the overall budget of the project investment and construction of the Waste Treatment Facility in the City of Konin, as well as to predict the future effects of today’s decisions. If the person responsible for risk management knows the probability distribution of costs, the estimation of the investment’s budget at completion becomes a simple calculation (Bieda 2000; Williams et al. 2002). There is, however, little evidence in support of the statement that costs have a known theoretical distribution. In this chapter, the role