

82 |
4 Stochastic Analysis of the Environmental Impact of Energy Production |
4.12The Results of the Simulation
The results of the performed simulation (10,000 trials) can be presented in the form of frequency charts, reports, and sensitivity analyses. Below one can find frequency charts of the Forecast (Forecast TOTAL) as a summary of influence of the 11 impact categories on the environment, respectively, in Figs. 4.20–4.23 (68% confidence interval), and Figs. 4.24–4.27 (95% confidence interval). The sensitivity analysis and statistics reports as well as percentiles in the form of tables, are shown in Figs. 4.28–4.31, and in Figs. 4.32–4.35, respectively.
Fig. 4.17 (continued)
4.12 The Results of the Simulation |
83 |
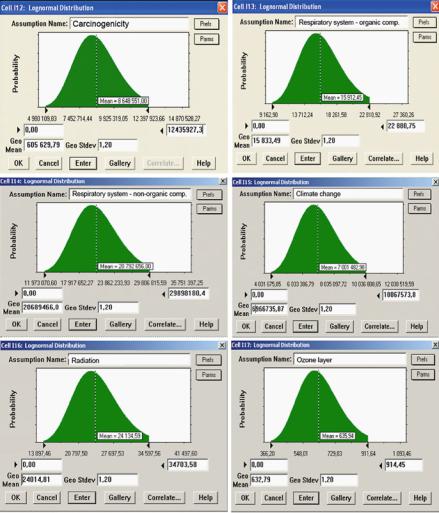
Fig. 4.17 The log-normal probability distributions tabs for the 11 impact categories, available in Crystal Ball software for the S2 scenario (Source: Own work)
As a result of the MC simulation, confidence intervals that estimate the values of the total influence of the impact category on the environment are formed, approximated with log-normal distribution at the significance level of 0.05. The confidence limits, presented in the frequency charts, are fixed using the minisliders, or grabbers (the area of the frequency chart covered by them is of a darker shade). The values of the obtained confidence intervals are shown below:
68% confidence interval
•Scenario S1: [33,227,982.17; 39,845,407.56] Pt
•Scenario S2: [40,789,087.31; 49,201,184.30] Pt
•Scenario S3: [30,645,422.13; 36,803,304.14] Pt
•Scenario S4: [26,311,943.73; 32,277,038.83] Pt
84 |
4 Stochastic Analysis of the Environmental Impact of Energy Production |
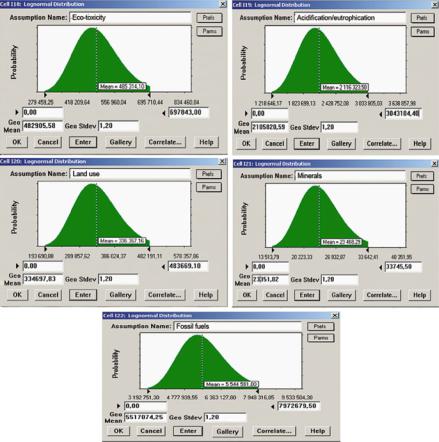
Fig. 4.18 (continued)
4.12 The Results of the Simulation |
85 |
Fig. 4.18 The log-normal probability distributions tabs for the 11 impact categories, available in Crystal Ball software for the S3 scenario (Source: Own work)
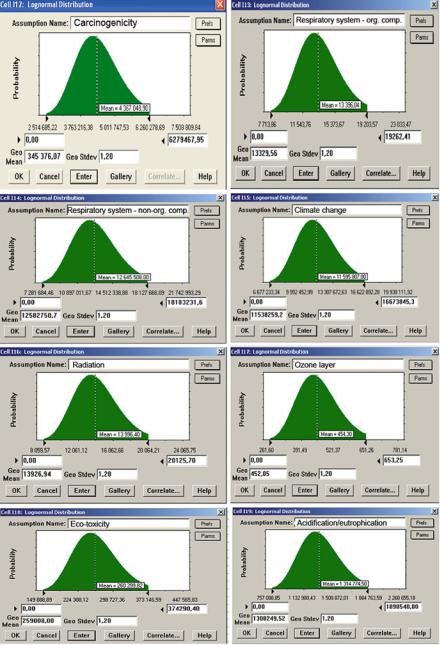
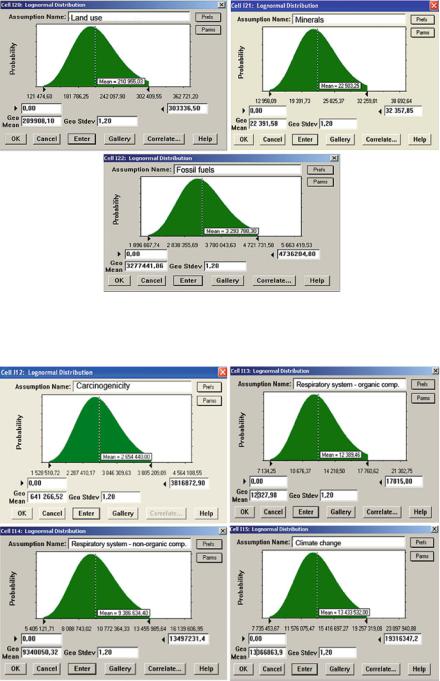
Fig. 4.19 (continued)
86 |
4 Stochastic Analysis of the Environmental Impact of Energy Production |
Fig. 4.19 The log-normal probability distributions tabs for the 11 impact categories, available in Crystal Ball software for the S4 scenario (Source: Own work)
95% confidence interval
•Scenario S1: [30,373,471.47; 43,138,235.52] Pt,
•Scenario S2: [37,234,891.94; 53,336,194.13] Pt
•Scenario S3: [27,933,420.50; 39,941,034.25] Pt
•Scenario S4: [23,719,134.55; 35,258,203.00] Pt