

4.13 Sensitivity Analysis |
87 |
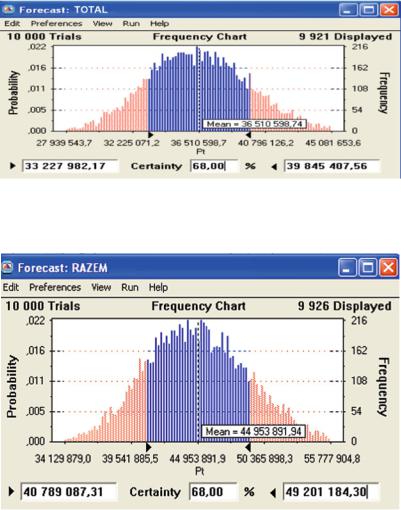
Fig. 4.20 The Forecast frequency chart: S1 scenario TOTAL (68% confidence level) (Source: Own work)
Fig. 4.21 The Forecast frequency chart: S2 scenario TOTAL (68% confidence level) (Source: Own work)
4.13Sensitivity Analysis
The results obtained in MC simulation have been used to carry out analysis in three different formats:
•Clustered bar charts (Sensitivity Chart)
•Tornado charts (Tornado Chart)
•Spider charts (Spider Chart).
88 |
4 Stochastic Analysis of the Environmental Impact of Energy Production |
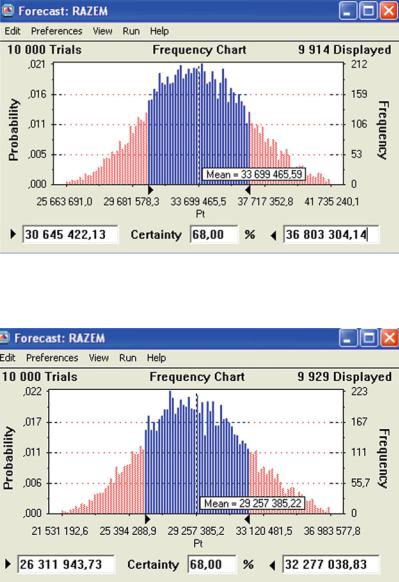
Fig. 4.22 The Forecast frequency chart: S3 scenario TOTAL (68% confidence level) (Source: Own work)
Fig. 4.23 The Forecast frequency chart: S4 scenario TOTAL (68% confidence level) (Source: Own work)
For an easier comparison of the sensitivity analyses in all of the four scenarios, the clustered bar charts of the scenarios mentioned above are shown in Figs. 4.36–4.39.
4.13 Sensitivity Analysis |
89 |
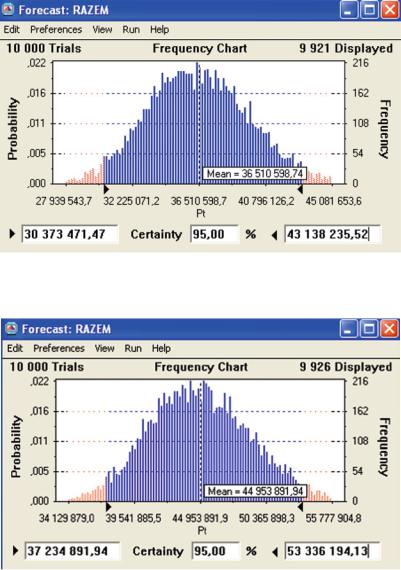
Fig. 4.24 The Forecast frequency chart: S1 scenario TOTAL (95% confidence level) (Source: Own work)
Fig. 4.25 The Forecast frequency chart: S2 scenario TOTAL (95% confidence level) (Source: Own work)
The MC simulation results have then been used to perform tornado sensitivity analyses, presented in the form of tornado charts (Figs. 4.40–4.43) and spider charts (Figs. 4.44–4.47). By presenting the usefulness of individual input variables, the sensitivity analysis indicates which variables can be omitted, without the loss of quality, and which cannot be omitted. A more in-depth analysis of the problem can
90 |
4 Stochastic Analysis of the Environmental Impact of Energy Production |
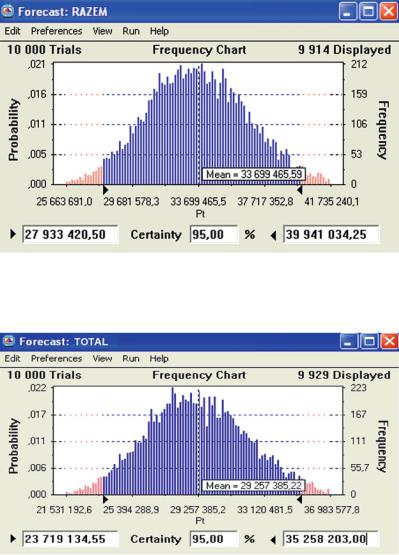
Fig. 4.26 The Forecast frequency chart: S3 scenario TOTAL (95% confidence level) (Source: Own work)
Fig. 4.27 The Forecast frequency chart: S4 scenario TOTAL (95% confidence level) (Source: Own work)
be found in ISO 14041 series (Kowalski et al. 2007). The variables with zero per cent usefulness, as indicated by sensitivity analysis (Figs. 4.36–4.39), are not included in the construction of tornado and spider charts. In all of the scenarios, this relates to: Respiratory system – organic compounds, Eco-toxicity, Ozone layer, Minerals, and Radiation.