

3.7 Summary and Conclusion |
41 |
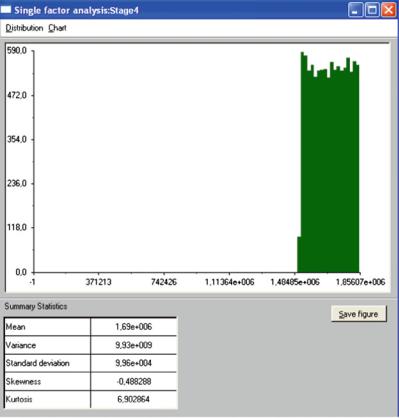
Fig. 3.17 Uncertainty analysis frequency chart – Stage 4 (Source: Own work)
3.7Summary and Conclusion
In the deterministic approach to investment design, a costs model is created by assuming constant values of individual elements in the financial plan. In the stochastic method of estimating the investment costs, the knowledge of probability distribution is required, as it is used to approximate the random values of partial costs, whose sum is the final cost of the investment. In order to describe the random nature of the elements in the financial plan (Stage 1–Stage 6), uniform distribution has been applied, based on the work of Liberman (2003).
When examining a given investment project, it is necessary to include the analysis and presentation of investment costs. The traditional methods of estimating costs do not provide answers to the following questions (Bieda 2005a, 2006a, 2006f, 2007a):
42 |
3 The Role of Risk Assessment in Investment Costs Management |
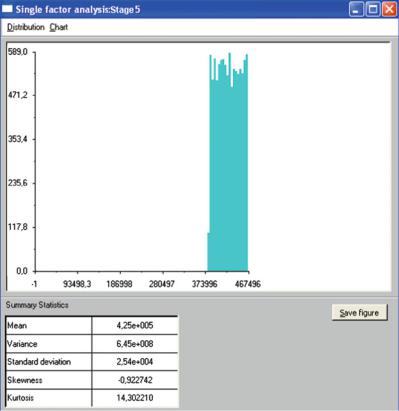
Fig. 3.18 Uncertainty analysis frequency chart – Stage 5 (Source: Own work)
1.What is the danger of cost overruns?
2.What can be considered as risk in both the project and the realisation of the investment?
The aim of the analysis of investment risk (of the total investment costs) is to deliver tools to the investment manager that would help them manage the risk.
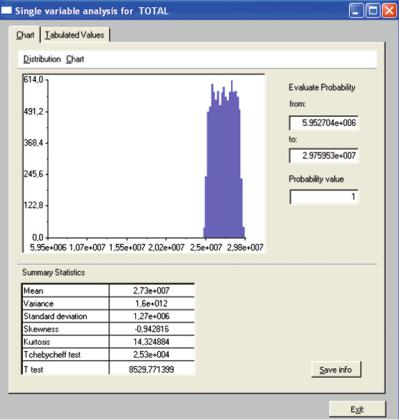
The above example illustrates that by employing Monte Carlo simulation, it becomes possible to include uncertainty in the evaluation of investment costs, consequently, the risk in the decision making process is considered as well (Bieda and Tadeusiewicz 2008). Moreover, on the basis of the same simulation results, each of the decision-makers is able to make an individual, and yet separate, decision.
If an assumption is made that the estimated values of the investment project’s partial costs (Stage 1–Stage 6) can be described with the help of uniform distribution, the total investment cost TOTAL is transformed from a specific deterministic
3.7 Summary and Conclusion |
43 |
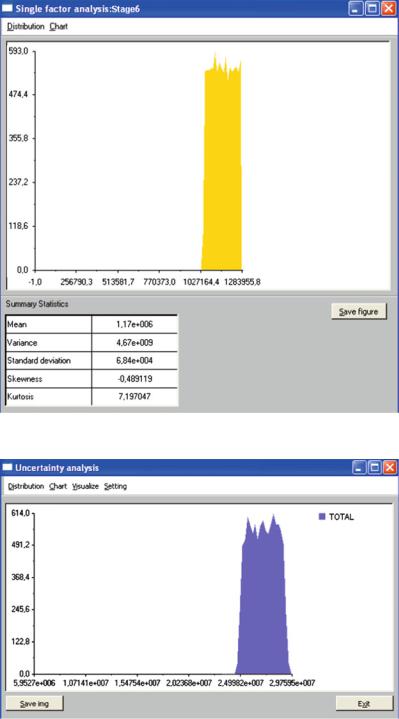
Fig. 3.19 Uncertainty analysis frequency chart – Stage 6 (Source: Own work)
Fig. 3.20 Uncertainty analysis with 95% confidence level (Source: Own work)
44 |
3 The Role of Risk Assessment in Investment Costs Management |
Fig. 3.21 Uncertainty analysis and distribution parameters with 95% confidence level (Source: Own work)
value into its probable distribution around the mean value. The probability distribution achieved in this way allows for a better understanding of the uncertainty level, which covers the interval range established using MC method with the help of SimLab® (see Fig. 3.12).
3.7 Summary and Conclusion |
45 |
Table 3.2 Supportive calculations made in the process of creating the uncertainty analysis charts. Stages of statistical calculations require verification
Source: Own work