

144 |
5 Stochastic Analysis, Using Monte Carlo (MC) Simulation |
Table 5.9 The MC simulation results, using CB software, of the tornado sensitivity analysis, of the human health damage category, on the change of input parameters (impact categories) of the characterisation model – sensitivity table
|
TOTAL – human health |
|
|
Input parameters |
|
||
|
|
|
|
|
|
|
|
Impact category |
Lower |
Upper |
Range |
|
Lower |
Upper |
Base value |
|
boundary |
boundary |
|
|
boundary |
boundary |
|
|
|
|
|
|
|
|
|
Respiratory |
217.613138 |
246.9073692 |
29.29423119 |
131.8240404 |
161.1182715 |
146.471156 |
|
system – |
|
|
|
|
|
|
|
non-organic |
|
|
|
|
|
|
|
compounds |
|
|
|
|
|
|
|
Carcinogenic |
225.8276374 |
238.6928698 |
12.86523238 |
57.89354573 |
70.75877811 |
64.32616192 |
|
agents |
|
|
|
|
|
|
|
Climate change |
230.1489832 |
234.371524 |
4.22254086 |
19.00143387 |
23.22397473 |
21.1127043 |
|
|
|
|
|
|
|
|
|
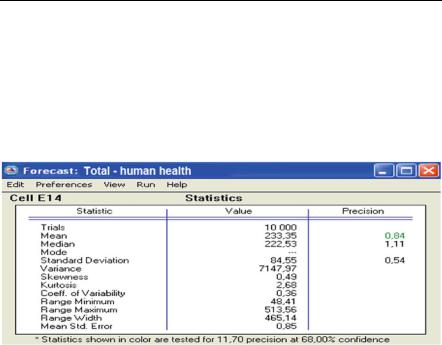
Fig. 5.19 The statistics report of the forecast of the total of six impact categories, that form the human health damage category, of the LCA analysis of waste management in the MSP Power Plant, in an annual cycle – Statistics (Source: Own work)
5.10The Results of the Simulation
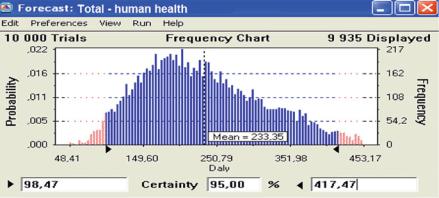
The simulation results, in the defined 10,000-randomisation cycle, are shown in Figs. 5.19 and 5.20. Figures 5.21 and 5.22 show the forecast frequency charts (Forecast: TOTAL – human health), which are the sum of six impact categories (carcinogenic agents, respiratory system – organic compounds, respiratory system – non-organic compounds, climate change, radiation, and ozone layer). This sum, equal to 232.26 DALY, forms the human health damage category. By setting the confidence levels to 68% and 95%, respectively, the obtained confidence intervals for the human health damage category amount to, respectively:
[148.02; 325.09] DALY confidence level of 68% [98.47; 417.47] DALY confidence level of 95%
5.10 The Results of the Simulation |
145 |
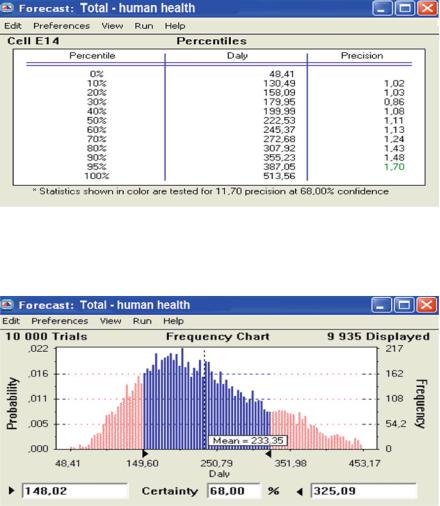
Fig. 5.20 The statistics report of the forecast of the total of six impact categories, that form the human health damage category, of the LCA analysis of waste management in the MSP Power Plant, in an annual cycle – Percentiles (Source: Own work)
Fig. 5.21 The frequency chart of the TOTAL forecast – human health (confidence level of 68%) (Source: Own work)
The range width of the set confidence interval, after rounding the values determining the intervals, is 465.14 DALY (Fig. 5.19) – this is equivalent to the difference between the 0th and the 100th percentile, as can be seen in Fig. 5.20. The display range is between 48.41 DALY and 513.56 DALY. Spadaro and Rabl (2008) bring our attention to the fact that in a probabilistic analysis of the damage category (and human health is such a category) interval estimations are usually based on a confidence interval of 95%.
146 |
5 Stochastic Analysis, Using Monte Carlo (MC) Simulation |
Fig. 5.22 The frequency chart of the TOTAL forecast – human health (confidence level of 95%) (Source: Own work)
5.11Sensitivity Analysis
The data sensitivity analysis has been carried out. The data consists of impact categories characterising the human health damage category. The procedure has been conducted by taking into account the variability of the analysed parameters and using MC simulation based on CB program. The sensitivity analysis is presented using the following three formats:
•Clustered bar chart (Fig. 5.23),
•Tornado chart (Fig. 5.24),
•Spider chart (Fig. 5.25).
A conclusion can be drawn from Fig. 5.23 that the greatest impact, 82.6% share, in the human health damage category, has the respiratory system – non-organic compounds, expressed in DALY. The second and third most influential impact categories – carcinogenic agents and climate change – have only 15.7% share and 1.7% share, respectively. The influence of the remaining impact categories does not exceed 0% share.
The tornado and spider charts have been created on the basis of data included in the newly built tables (Tables 5.9 and 5.10), which are filled in with values resulting from an MC simulation performed after the activation of two decision fields (found in the Tornado Chart dialog window – see Fig. 4.15): Tornado chart and Spider chart, respectively. The impact categories, with the 0% share in the human health damage category are not included in the process of generating charts (Fig. 5.23). By analysing the charts shown in Figs. 5.24 and 5.25, it seems that respiratory system – non-organic compounds has the widest variability interval presented in the chart (Fig. 5.24) and is the most critical input variable – it corresponds to the line, which has the greatest incline towards the x axis, described in percentiles, which is
5.11 Sensitivity Analysis |
147 |
Fig. 5.23 The sensitivity analysis of the TOTAL forecast – human health (Source: Own work)
Fig. 5.24 Tornado sensitivity chart of the human health damage category. The error bars indicate mean standard error (Source: Own work)